. 2014 Jun 1;74(11):2946-2961.
doi: 10.1158/0008-5472.CAN-13-3375. Epub 2014 Apr 4.

Predictive performance of microarray gene signatures: impact of tumor heterogeneity and multiple mechanisms of drug resistance

Affiliations

Predictive performance of microarray gene signatures: impact of tumor heterogeneity and multiple mechanisms of drug resistance

Charlotte K Y Ng et al. Cancer Res. .

Abstract

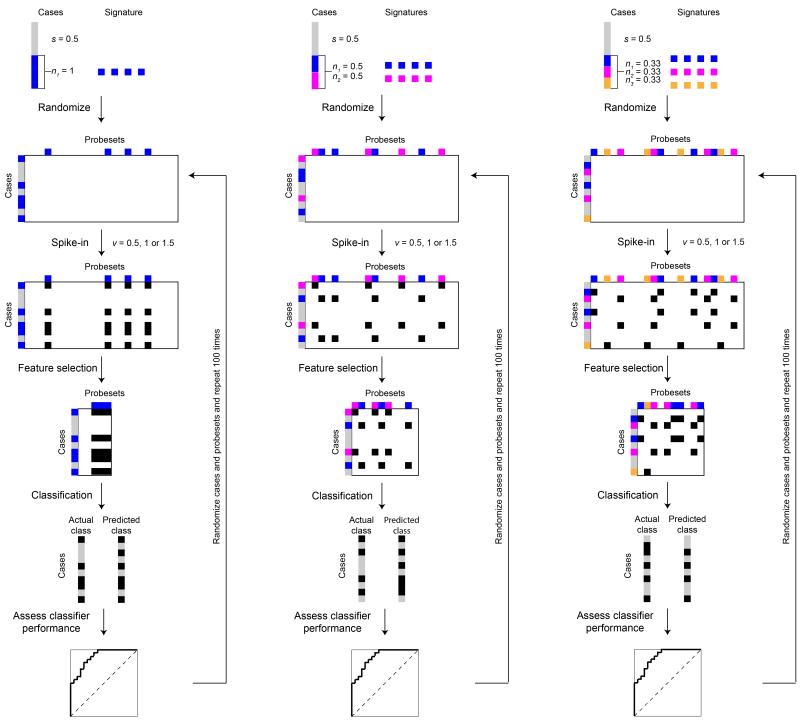
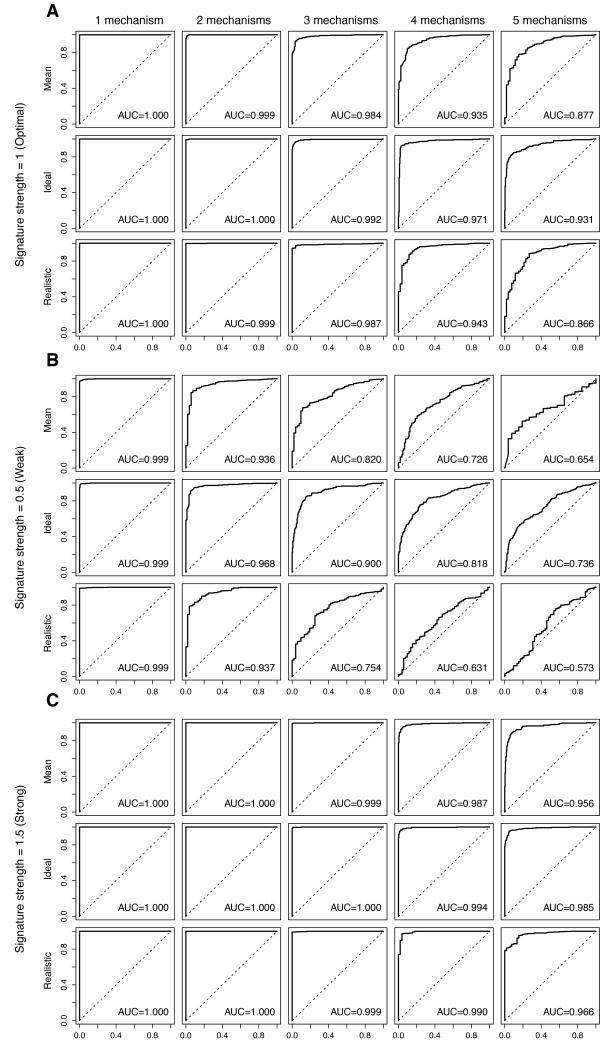
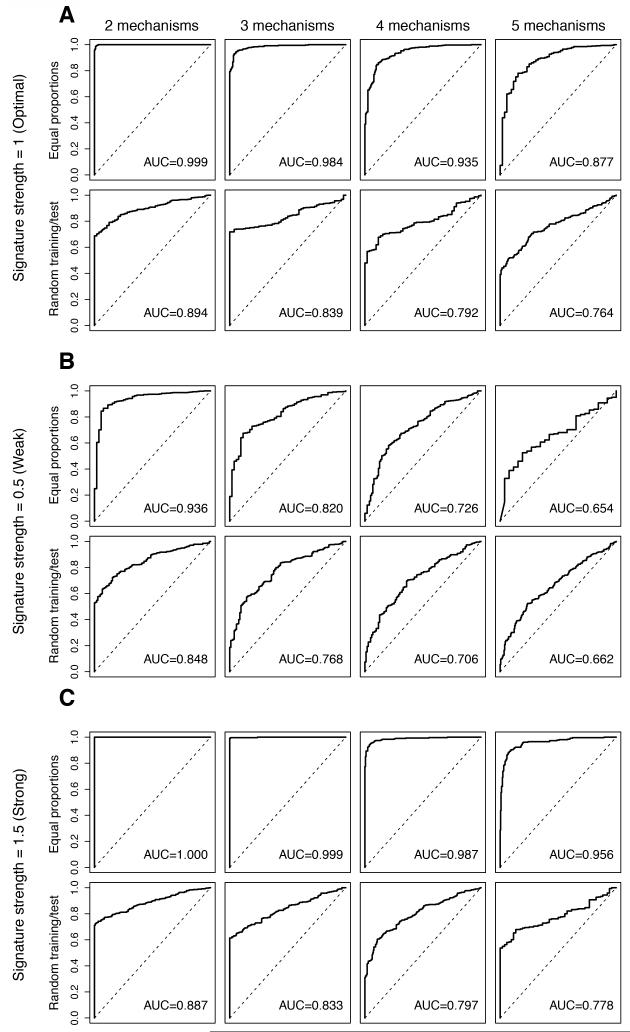
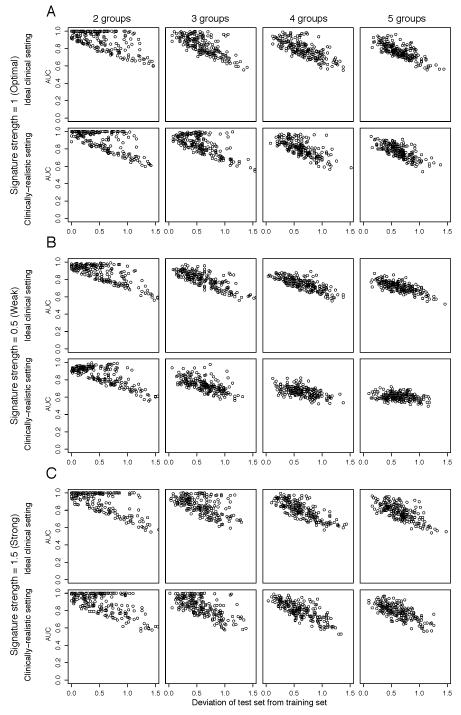
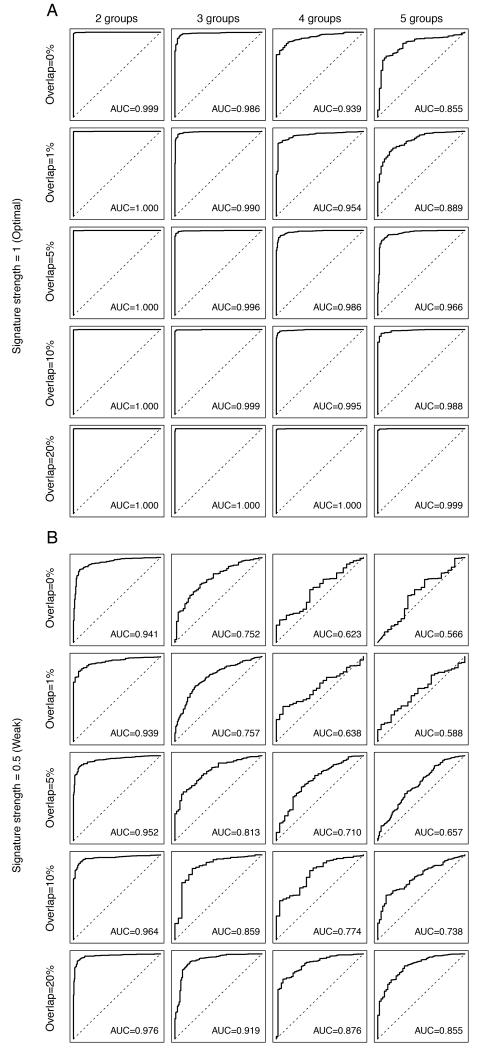
Gene signatures have failed to predict responses to breast cancer therapy in patients to date. In this study, we used bioinformatic methods to explore the hypothesis that the existence of multiple drug resistance mechanisms in different patients may limit the power of gene signatures to predict responses to therapy. In addition, we explored whether substratification of resistant cases could improve performance. Gene expression profiles from 1,550 breast cancers analyzed with the same microarray platform were retrieved from publicly available sources. Gene expression changes were introduced in cases defined as sensitive or resistant to a hypothetical therapy. In the resistant group, up to five different mechanisms of drug resistance causing distinct or overlapping gene expression changes were generated bioinformatically, and their impact on sensitivity, specificity, and predictive values of the signatures was investigated. We found that increasing the number of resistance mechanisms corresponding to different gene expression changes weakened the performance of the predictive signatures generated, even if the resistance-induced changes in gene expression were sufficiently strong and informative. Performance was also affected by cohort composition and the proportion of sensitive versus resistant cases or resistant cases that were mechanistically distinct. It was possible to improve response prediction by substratifying chemotherapy-resistant cases from actual datasets (non-bioinformatically perturbed datasets) and by using outliers to model multiple resistance mechanisms. Our work supports the hypothesis that the presence of multiple resistance mechanisms in a given therapy in patients limits the ability of gene signatures to make clinically useful predictions.


Figures

Figure 1
Figure 1. Schematic representation of the study design
Perturbed datasets were generated using microarray-based gene expression profiles of 1,550 breast cancer cases analyzed with the Affymetrix U133a2 platform. We assumed that s% of the cases were therapy sensitive (grey boxes), while the remaining 1-s% were therapy resistant (colored boxes). Within the 1-s% resistant cases, we further assumed that there were n resistance mechanisms, where the resistant cases were randomly allocated into the nth resistance mechanism (colored boxes). For illustration purposes, we assumed up to three resistance mechanisms (i.e. n=1, 2 or 3). Each resistance mechanism was represented by adding v (v=0.5, 1.0 or 1.5) to the Log2-expression value of 100 randomly selected, but not necessarily mutually exclusive, probes (black boxes). Predictive signature models were derived by ranking the features (probes) by t-tests using the CMA package. The top 100 features were then used as the predictive gene signature for diagonal linear discriminant analysis (DLDA) or supervised principal components (superPC) classification. Validation of the predictive gene signature was performed by stratified 3-fold Monte-Carlo cross-validation, repeated 50 iterations. Comparing the predicted and actual classes, we calculated the area under curve of receiver operating characteristic curves, sensitivity, specificity, accuracy, positive predictive value and negative predictive for each predictive gene signature. For each combination of variables, we repeated the spiking-in and classification up to 200 times.
Figure 2
Figure 2. Impact of multiple mechanisms of resistance on the performance of the predictive signatures
Perturbed datasets in which s% (s%=5%, 10%, 20%, 30%, 40% or 50%) of the cases were designated to be therapy sensitive were generated. Within the 1-s% resistant cases, we allocated the cases randomly into n (n=1, 2, 3, 4, 5) equally sized groups of resistance mechanisms. For each nth resistance mechanism, 100 genes were randomly selected as the “true” gene expression changes and were spiked-in by v (v=0.5, 1, 1.5). For each combination of s, n and v, we repeated the spiking and classification 100 times. Representative receiver operating characteristic (ROC) curves and the mean area under curve (AUC) for the cases are shown, where the Log2-expression of the 100-gene “true” gene expression changes were spiked-in by 1 (A, labeled “Signature strength=1 (Optimal)”), 0.5 (B, labeled “Signature strength=0.5 (Weak)”) and 1.5 (C, labeled “Signature strength=1.5 (Strong)”). Within each of A, B and C, (top row, labeled “Mean”) simulations for 1-s%=50%, 60%, 70%, 80%, 90% or 95%, (middle row, labeled “Ideal”) simulations for an optimal setting where 1-s%=50% and (bottom row, labeled “Realistic”) simulations for a clinically-realistic setting where 1-s%=90% are shown. Within each row, the representative ROCs for (from left) n=1 (“1 mechanism”), n=2 (“2 mechanisms”), n=3 (“3 mechanisms”), n=4 (“4 mechanisms”), n=5 (“5 mechanisms”) groups of distinct resistance mechanisms are shown.
Figure 3
Figure 3. Impact of varying proportions of resistance mechanisms within the resistant groups of the training and test sets on the performance of the predictive gene signature
Perturbed datasets in which s% (s%=5%, 10%, 20%, 30%, 40% or 50%) of the cases were designated to be therapy sensitive were generated. For “Equal proportions”, within the 1-s% resistant cases, we allocated the cases evenly either into n (n=2, 3, 4, 5) equally sized groups of resistance mechanisms. For “Random training/test”, within the resistant cases, although the total percentage of resistant cases remained the same in training and test sets, the cases were allocated randomly into n (n=2, 3, 4, 5) groups of resistance mechanisms and the case allocation for training and test datasets was performed independently. Furthermore, for each nth resistance mechanism, 100 genes were randomly selected as the “true” gene expression changes and were spiked-in by v (v=0.5, 1, 1.5). For each combination of s, n and v, we repeated the spiking and classification 100 times for “Equal proportions” and 200 times for “Random training/test”. Representative receiver operating characteristic (ROC) curves and the mean area under curve (AUC) for the cases are shown, where the Log2-expression of the 100-gene “true” gene expression changes were spiked-in by 1 (A, labeled “Signature strength=1 (Optimal)”), 0.5 (B, labeled “Signature strength=0.5 (Weak)”) and 1.5 (C, labeled “Signature strength=1.5 (Strong)”). Within each of A, B and C, representative ROCs and mean AUCs of “Equal proportions” (top row, labeled “Equal proportions”) and of “Random training/test” (bottom row, labeled “Random training/test”) scenarios are shown. Within each row, the representative ROC curves of 2 to 5 resistance mechanisms are presented from left to right. The AUC values presented are the mean values for n resistance mechanisms.
Figure 4
Figure 4. Comparative impact of multiple unevenly distributed resistance mechanisms with random and independent prevalence in training and test sets on the performance of the predictive gene signatures
Perturbed datasets in which s% (s%=5%, 10%, 20%, 30%, 40% or 50%) of the cases were designated to be therapy sensitive were generated. Within the resistant 1-s% cases, the cases were allocated randomly into n (n=2, 3, 4, 5) groups of resistance mechanisms and the case allocation for training and test datasets was performed independently, in both test and training sets, the total proportion of resistant cases is identical. For each nth resistance mechanism, 100 genes were randomly selected as the “true” gene expression changes and were spiked-in by v (v=0.5, 1, 1.5). For each combination of s, n and v, we repeated the spiking and classification 200 times. The performance of the predictive gene signature for each repeat where each data point represents the median of 50 Monte-Carlo Cross Validation (MCCV) repeats. The performance of the predictive gene signature was measured by the area under curve (AUC) of receiver operating characteristic (ROC) curves. For v=1 (A, labeled “Signature strength=1 (Optimal)”), v=0.5 (B, labeled “Signature strength=0.5 (Weak)”) and v=1.5 (C, labeled “Signature strength=1.5 (Strong)”), AUC is plotted against the deviation of the sizes of the distinct resistance mechanism groups in the test dataset from those in the training dataset, calculated as Σi=2nfi,testfi,train where fi,test is the size of the ith subgroup in the test set and fi,train is the size of the ith subgroup in the training set for (from left) n=2 (labeled “2 groups”), n=3 (labeled “3 groups”), n=4 (labeled “4 groups”) and n=5 (labeled “5 groups”). For each of (A), (B) and (C), AUCs are plotted for the “Ideal clinical setting” (where s%=50%) and for “Clinically-realistic setting” (where s%=10%).
Figure 5
Figure 5. Impact of the extent of overlapping gene expression changes caused by distinct mechanisms of resistance on the performance of the predictive gene signature
Perturbed datasets in which s% (s%=5%, 10%, 20%, 30%, 40% or 50%) of the cases were designated to be therapy sensitive were generated. Within the 1-s% resistant cases, we allocated the cases randomly into n (n=2, 3, 4, 5) equally sized groups of resistance mechanisms. For each nth resistance mechanism, 100 genes were selected as the “true” gene expression changes, of which o% (o%=0%, 1%, 5%, 10%, 20%) of the 100 genes were common to all n mechanisms. The selected genes were then spiked-in by v (v=0.5, 1, 1.5). For each combination of s, n, o and v, we repeated the spiking and classification 100 times. Representative receiver operating characteristic (ROC) curves of the cases where the Log2-expression of the “true” gene expression changes were spiked-in by 1 (A, labeled “Signature strength=1 (Optimal)”) and 0.5 (B, labeled “Signature strength=0.5 (Weak)”). Within each of A and B, we showed the representative ROCs depicting the mean area under curve (AUC) for simulations where 1-s%=90%, and o%=0% (“Overlap=0%”), o%=1% (“Overlap=1%”), o%=5% (“Overlap=5%”), o%=10% (“Overlap=10%”), o%=20% (“Overlap=20%”)(top to bottom). Within each row, the representative ROCs for n=2 (“2 groups”), n=3 (“3 groups”), n=4 (“4 groups”), n=5 (“5 groups”) groups of resistance mechanisms are shown. The AUC values presented are the mean values for n resistance mechanisms.

Similar articles

Cited by

References

    1. Reis-Filho JS, Pusztai L. Gene expression profiling in breast cancer: classification, prognostication, and prediction. Lancet. 2011;378:1812–23. - PubMed
    1. Shi L, Campbell G, Jones WD, Campagne F, Wen Z, Walker SJ, et al. The MicroArray Quality Control (MAQC)-II study of common practices for the development and validation of microarray-based predictive models. Nat Biotechnol. 2010;28:827–38. - PMC - PubMed
    1. van ’t Veer LJ, Dai H, van de Vijver MJ, He YD, Hart AA, Mao M, et al. Gene expression profiling predicts clinical outcome of breast cancer. Nature. 2002;415:530–6. - PubMed
    1. Weigelt B, Pusztai L, Ashworth A, Reis JS. Challenges translating breast cancer gene signatures into the clinic. Nat Rev Clin Oncol. 2012;9:58–64. - PubMed
    1. Perou CM, Sorlie T, Eisen MB, van de Rijn M, Jeffrey SS, Rees CA, et al. Molecular portraits of human breast tumours. Nature. 2000;406:747–52. - PubMed

Publication types

MeSH terms

Substances