. 2014 Apr 1;19(4):630-41.
doi: 10.1016/j.cmet.2014.03.011.

Proteolytic cleavage of Opa1 stimulates mitochondrial inner membrane fusion and couples fusion to oxidative phosphorylation

Affiliations

Proteolytic cleavage of Opa1 stimulates mitochondrial inner membrane fusion and couples fusion to oxidative phosphorylation

Prashant Mishra et al. Cell Metab. .

Erratum in

  • Cell Metab. 2014 May 6;19(5):891

Abstract

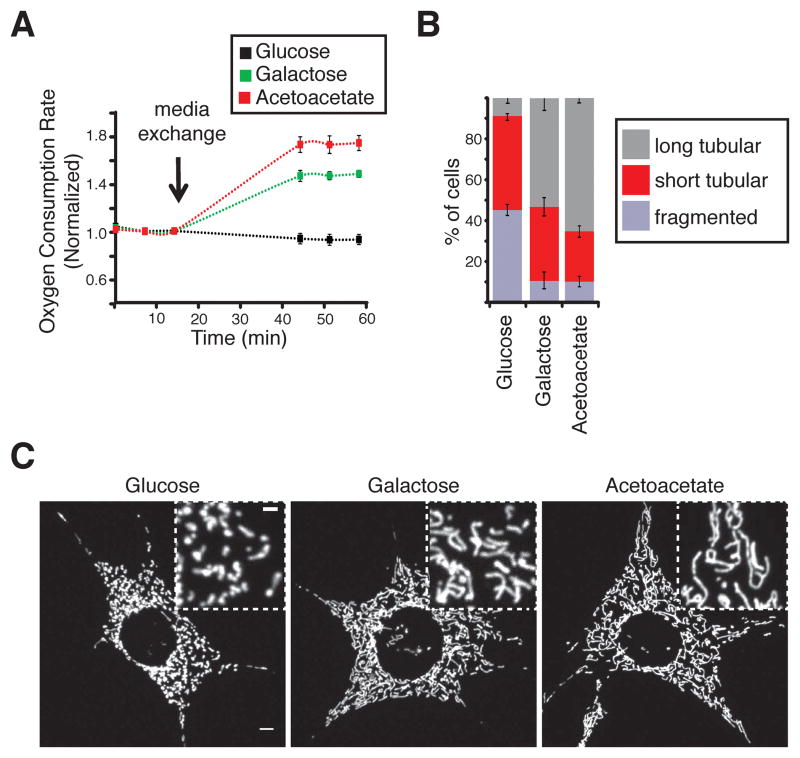
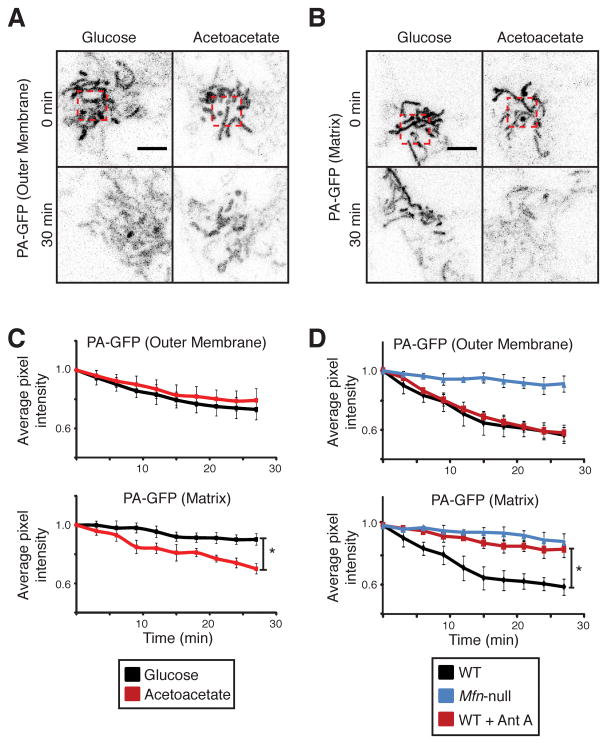
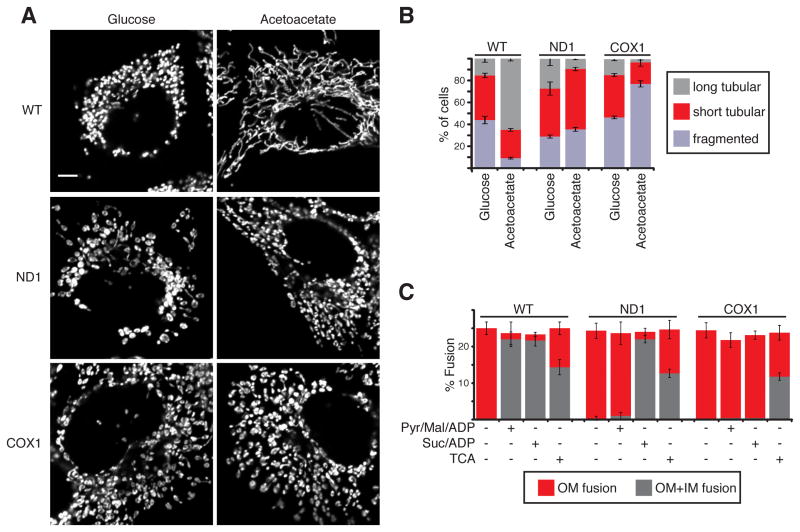
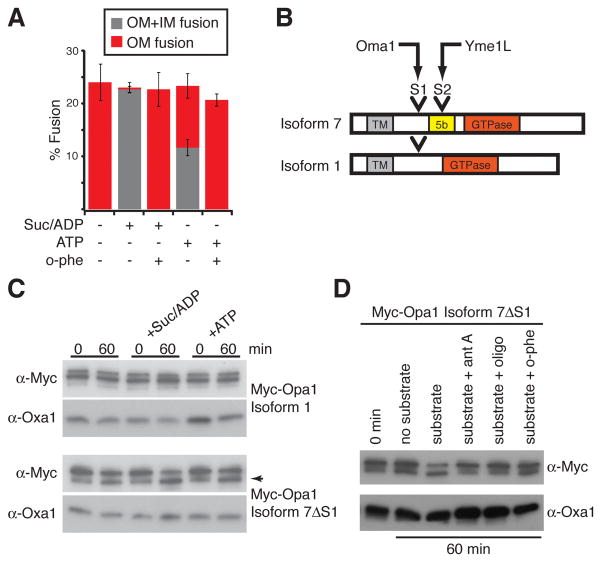
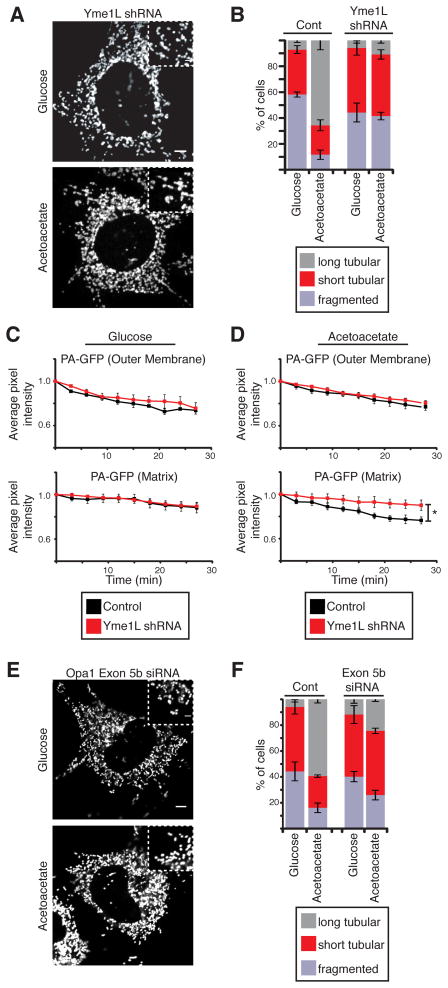
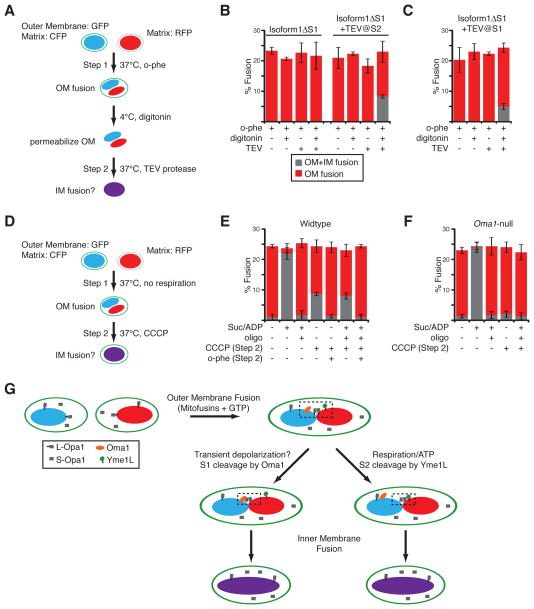
Mitochondrial fusion is essential for maintenance of mitochondrial function. The mitofusin GTPases control mitochondrial outer membrane fusion, whereas the dynamin-related GTPase Opa1 mediates inner membrane fusion. We show that mitochondrial inner membrane fusion is tuned by the level of oxidative phosphorylation (OXPHOS), whereas outer membrane fusion is insensitive. Consequently, cells from patients with pathogenic mtDNA mutations show a selective defect in mitochondrial inner membrane fusion. In elucidating the molecular mechanism of OXPHOS-stimulated fusion, we uncover that real-time proteolytic processing of Opa1 stimulates mitochondrial inner membrane fusion. OXPHOS-stimulated mitochondrial fusion operates through Yme1L, which cleaves Opa1 more efficiently under high OXPHOS conditions. Engineered cleavage of Opa1 is sufficient to mediate inner membrane fusion, regardless of respiratory state. Proteolytic cleavage therefore stimulates the membrane fusion activity of Opa1, and this feature is exploited to dynamically couple mitochondrial fusion to cellular metabolism.


Figures

Figure 1
Figure 1. Oxidative conditions stimulate mitochondrial fusion
(A) Inducing oxygen consumption with oxidative media. MEFs were grown in glucose-containing media and then switched to glucose, galactose or acetoacetate containing media. Error bars indicate standard deviations. (B) Quantitation of mitochondrial morphology at 24 hours after media shift. Cells were classified as having mostly fragmented mitochondria, short tubular mitochondria or long tubular mitochondria. Error bars indicate standard deviations. (C) Representative images of mitochondrial morphology (matrix-targeted DsRed) at 24 hours after media shift. Scale bar, 5 μm.
Figure 2
Figure 2. OXPHOS stimulates inner membrane fusion in vitro
(A) Schematic of the in vitro fusion assay. Mitochondria containing OM-targeted GFP and matrix CFP were mixed with mitochondria containing matrix RFP. Full fusion events (both OM and IM fusion) are indicated by colocalized CFP and RFP matrices that are surrounded by a single GFP membrane. OM fusion intermediates are indicated by apposed but distinct CFP and RFP matrices that are surrounded by a single GFP membrane. (B) Image of an in vitro fusion reaction showing unfused mitochondria, OM fusion intermediates (arrow), and full fusion events (arrowhead). Scale bar, 1 μm. (C) Dependence of OM and IM in vitro fusion events on respiratory substrates. Events are plotted as percentage of total mitochondria. (D) Sensitivity of in vitro fusion to ETC inhibition in respiratory conditions. ADP and GTP are present in all reactions. Pyruvate, malate (‘Pyr/Mal’, complex I substrates) or succinate (complex II substrate) was added as indicated. The following drugs were tested: rotenone (complex I inhibitor), atpenin A5 (AA5, complex II inhibitor), antimycin A (Ant A, complex III inhibitor), potassium cyanide (KCN, complex IV inhibitor), and oligomycin (oligo, complex V inhibitor). Same color schemes as (C). (E) Partial support of in vitro fusion events by ATP or the tricarboxylic acid cycle. Same color scheme as (C). GTP and ATP were added as indicated. TCA: substrates for the tricarboxylic acid cycle (α-ketoglutarate, aspartate, NADH). (F) OM (top) and IM (bottom) fusion rates in vitro as a function of oxygen consumption rate. All error bars indicate standard deviation.
Figure 3
Figure 3. Inner membrane fusion is inhibited under glycolytic conditions in vivo
(A) OM fusion in wildtype MEFs. At time t=0 min, PA-GFP in the OM was activated in a region of interest (red box). Dilution of the PA-GFP signal was followed every 3 min for 30 min. Representative images at 0 min and 30 min are shown. Scale bar, 5 μm. (B) IM fusion in wildtype MEFs. Same as in (A), but using PA-GFP targeted to the matrix. Scale bar, 5 μm. (C) OM and IM fusion rates in vivo in glycolytic and oxidative media, measured by dilution of PA-GFP. The p-values were calculated for the slopes (pixel intensity versus time) using the Student’s t-test. (D) OM and IM fusion rates in vivo in the presence and absence of the complex III inhibitor antimycin A (Ant A). As a negative control, data from mitofusin-deficient MEFs (Mfn: Mfn1 −/−, Mfn2 −/−) are shown. The p-values were calculated as in (C). All error bars indicate standard deviations. *p < 0.01.
Figure 4
Figure 4. Pathogenic mtDNA mutations impair OXPHOS-driven IM fusion
(A) Failure of ND1 (complex I mutant) and COXI (complex IV mutant) cells to elongate mitochondria when shifted to oxidative media for 4 hours. Mitochondria were visualized via expression of matrix-targeted DsRed. Scale bar, 5 μm. (B) Quantification of mitochondrial morphology in wildtype and mutant cells in glycolytic (“Glucose”) versus oxidative (“Acetoacetate”) media. (C) Defective IM fusion in vitro in mitochondria of mutant cells. All reactions contain GTP. Pyr, pyruvate; Mal, malate; Suc, succinate; TCA: substrates for the tricarboxylic acid cycle (α-ketoglutarate, aspartate, NADH). All error bars indicate standard deviations.
Figure 5
Figure 5. Opa1 processing at site S2 is necessary for OXPHOS-induced fusion
(A) Inhibition of IM fusion events in vitro by o-phenanthroline. All reactions contain GTP. Suc, succinate; o-phe, o-phenanthroline. Error bars indicate standard deviations. (B) Schematic of Opa1 mRNA splice forms 1 and 7, showing locations of the S1 and S2 cleavage sites. (C) Processing at the S1 (top two panels) and S2 (bottom two panels) sites of myc-Opa1 in vitro in response to respiratory conditions or ATP. Oxa1 levels are shown as a control. Processing to the short form of myc-Opa1 isoform 7ΔS1 (arrow) occurs in response to respiratory conditions. (D) Processing at the Opa1 S2 site in vitro in response to ETC inhibition. Substrate (succinate, ADP) and drugs [antimycin A (ant A), oligomycin (oligo) and o-phenanthroline (o-phe)] were added as indicated.
Figure 6
Figure 6. Yme1L is necessary for OXPHOS-induced fusion
(A) Representative images of mitochondrial morphology in Yme1L-depleted MEFs at 24 hours after shifting to glycolytic (top) or oxidative (bottom) media. Mitochondria were visualized via staining for Tom20, a mitochondrial outer membrane protein. Scale bar, 5 μm. (B) Quantification of mitochondrial morphology in control and Yme1L-depleted cells in glycolytic (“Glucose”) versus oxidative (“Acetoacetate”) media. (C) OM fusion rates (top) and IM fusion rates (bottom) measured by PA-GFP dilution in vivo under glycolytic conditions. Yme1L-knockdown cells are compared with control cells. (D) Same as (C), but under oxidative conditions. The p-values were calculated for the slopes (pixel intensity versus time) using the Student’s t-test. *p < 0.01. (E) Representative images of mitochondrial morphology in exon 5b knockdown cells after shifting to glycolytic (“Glucose”) or oxidative (“Acetoacetate”) media for 24 hours. Mitochondria were visualized via staining for Tom20, a mitochondrial OM protein. Scale bar, 5 μm. (F) Quantitation of mitochondrial morphology in control and exon 5b-depleted cells in glycolytic and oxidative media. All error bars indicate standard deviations.
Figure 7
Figure 7. Induced proteolytic processing of Opa1 promotes inner membrane fusion
(A) Schematic of the in vitro fusion experiment in (B) and (C). o-phenanthroline is present throughout, and digitonin and TEV protease are added after OM fusion. (B) Induction of IM fusion by engineered cleavage at S2. OM and IM fusion events in mitochondria containing Opa1 lacking a TEV site (1ΔS1) or containing a TEV site at the S2 position (1ΔS1 + TEV@S2). In the latter, S2 cleavage was controlled by addition of digitonin and TEV. (C) Induction of IM fusion by engineered cleavage at S1. The experiment is similar to (B), but using an Opa1 isoform containing a TEV site at the S1 position. Same color scheme as (B). (D) Schematic of the in vitro fusion experiment in (E) and (F). Isolated mitochondria are allowed to proceed through OM fusion (Step 1) in the absence of respiration. CCCP is then added to induce Opa1 processing at S1 (Step 2). (E) Induction of IM fusion by CCCP. OM and IM fusion events in wild-type mitochondria after CCCP-induced processing of Opa1. Suc, succinate; o-phe, o-phenanthroline; oligo, oligomycin. Same color scheme as (B). (F) Same as (E), except using Oma1-null mitochondria. All error bars indicate standard deviations. (G) Model for activation of Opa1 and IM fusion by proteolysis. OM fusion is permissive, as long as mitofusins and GTP are present. In contrast, IM fusion is regulated by the Yme1L or Oma1 metalloproteases, which acutely cleave long isoforms of Opa1 (L-Opa1) as part of the fusion mechanism. Yme1L activity is regulated by mitochondrial respiration and/or ATP levels, while Oma1 activity is potentially regulated by transient IM depolarizations.

Similar articles

Cited by

References

    1. Baracca A, Solaini G, Sgarbi G, Lenaz G, Baruzzi A, Schapira AH, Martinuzzi A, Carelli V. Severe impairment of complex I-driven adenosine triphosphate synthesis in leber hereditary optic neuropathy cybrids. Archives of neurology. 2005;62:730–736. - PubMed
    1. Cereghetti GM, Stangherlin A, Martins de Brito O, Chang CR, Blackstone C, Bernardi P, Scorrano L. Dephosphorylation by calcineurin regulates translocation of Drp1 to mitochondria. Proc Natl Acad Sci U S A. 2008;105:15803–15808. - PMC - PubMed
    1. Chan DC. Fusion and fission: interlinked processes critical for mitochondrial health. Annual review of genetics. 2012;46:265–287. - PubMed
    1. Chance B, Williams GR. Respiratory enzymes in oxidative phosphorylation. III. The steady state. J Biol Chem. 1955;217:409–427. - PubMed
    1. Chen H, Detmer SA, Ewald AJ, Griffin EE, Fraser SE, Chan DC. Mitofusins Mfn1 and Mfn2 coordinately regulate mitochondrial fusion and are essential for embryonic development. J Cell Biol. 2003;160:189–200. - PMC - PubMed

Publication types