System wide analyses have underestimated protein abundances and the importance of transcription in mammals
- PMID: 24688849
- PMCID: PMC3940484
- DOI: 10.7717/peerj.270
System wide analyses have underestimated protein abundances and the importance of transcription in mammals
Abstract
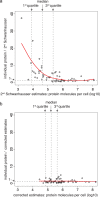
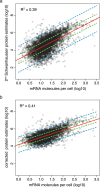
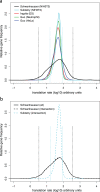
Large scale surveys in mammalian tissue culture cells suggest that the protein expressed at the median abundance is present at 8,000-16,000 molecules per cell and that differences in mRNA expression between genes explain only 10-40% of the differences in protein levels. We find, however, that these surveys have significantly underestimated protein abundances and the relative importance of transcription. Using individual measurements for 61 housekeeping proteins to rescale whole proteome data from Schwanhausser et al. (2011), we find that the median protein detected is expressed at 170,000 molecules per cell and that our corrected protein abundance estimates show a higher correlation with mRNA abundances than do the uncorrected protein data. In addition, we estimated the impact of further errors in mRNA and protein abundances using direct experimental measurements of these errors. The resulting analysis suggests that mRNA levels explain at least 56% of the differences in protein abundance for the 4,212 genes detected by Schwanhausser et al. (2011), though because one major source of error could not be estimated the true percent contribution should be higher. We also employed a second, independent strategy to determine the contribution of mRNA levels to protein expression. We show that the variance in translation rates directly measured by ribosome profiling is only 12% of that inferred by Schwanhausser et al. (2011), and that the measured and inferred translation rates correlate poorly (R(2) = 0.13). Based on this, our second strategy suggests that mRNA levels explain ∼81% of the variance in protein levels. We also determined the percent contributions of transcription, RNA degradation, translation and protein degradation to the variance in protein abundances using both of our strategies. While the magnitudes of the two estimates vary, they both suggest that transcription plays a more important role than the earlier studies implied and translation a much smaller role. Finally, the above estimates only apply to those genes whose mRNA and protein expression was detected. Based on a detailed analysis by Hebenstreit et al. (2012), we estimate that approximately 40% of genes in a given cell within a population express no mRNA. Since there can be no translation in the absence of mRNA, we argue that differences in translation rates can play no role in determining the expression levels for the ∼40% of genes that are non-expressed.
Keywords: Gene expression; Mass spectrometry; Protein abundance; Transcription; Translation.
Conflict of interest statement
Mark Biggin is an Academic Editor for PeerJ. The authors declare that they have no competing interests.
Figures


Comment in
-
Gene expression. Statistics requantitates the central dogma.Science. 2015 Mar 6;347(6226):1066-7. doi: 10.1126/science.aaa8332. Science. 2015. PMID: 25745146 No abstract available.
Similar articles
-
The Impact of Leadered and Leaderless Gene Structures on Translation Efficiency, Transcript Stability, and Predicted Transcription Rates in Mycobacterium smegmatis.J Bacteriol. 2020 Apr 9;202(9):e00746-19. doi: 10.1128/JB.00746-19. Print 2020 Apr 9. J Bacteriol. 2020. PMID: 32094162 Free PMC article.
-
Concordant regulation of translation and mRNA abundance for hundreds of targets of a human microRNA.PLoS Biol. 2009 Nov;7(11):e1000238. doi: 10.1371/journal.pbio.1000238. Epub 2009 Nov 10. PLoS Biol. 2009. PMID: 19901979 Free PMC article.
-
Absolute Quantification of Protein and mRNA Abundances Demonstrate Variability in Gene-Specific Translation Efficiency in Yeast.Cell Syst. 2017 May 24;4(5):495-504.e5. doi: 10.1016/j.cels.2017.03.003. Epub 2017 Mar 29. Cell Syst. 2017. PMID: 28365149
-
Insights into the regulation of protein abundance from proteomic and transcriptomic analyses.Nat Rev Genet. 2012 Mar 13;13(4):227-32. doi: 10.1038/nrg3185. Nat Rev Genet. 2012. PMID: 22411467 Free PMC article. Review.
-
Analysis of mRNA translation in cultured hippocampal neurons.Methods Enzymol. 2007;431:143-62. doi: 10.1016/S0076-6879(07)31008-2. Methods Enzymol. 2007. PMID: 17923234 Review.
Cited by
-
Pervasive isoform-specific translational regulation via alternative transcription start sites in mammals.Mol Syst Biol. 2016 Jul 18;12(7):875. doi: 10.15252/msb.20166941. Mol Syst Biol. 2016. PMID: 27430939 Free PMC article.
-
Arabidopsis TRM5 encodes a nuclear-localised bifunctional tRNA guanine and inosine-N1-methyltransferase that is important for growth.PLoS One. 2019 Nov 22;14(11):e0225064. doi: 10.1371/journal.pone.0225064. eCollection 2019. PLoS One. 2019. PMID: 31756231 Free PMC article.
-
Generally applicable transcriptome-wide analysis of translation using anota2seq.Nucleic Acids Res. 2019 Jul 9;47(12):e70. doi: 10.1093/nar/gkz223. Nucleic Acids Res. 2019. PMID: 30926999 Free PMC article.
-
Biology-inspired graph neural network encodes reactome and reveals biochemical reactions of disease.Patterns (N Y). 2023 May 22;4(7):100758. doi: 10.1016/j.patter.2023.100758. eCollection 2023 Jul 14. Patterns (N Y). 2023. PMID: 37521042 Free PMC article.
-
A genetics-based approach confirms immune associations with life history across multiple populations of an aquatic vertebrate (Gasterosteus aculeatus).Mol Ecol. 2018 Aug;27(15):3174-3191. doi: 10.1111/mec.14772. Epub 2018 Jul 9. Mol Ecol. 2018. PMID: 29924437 Free PMC article.
References
Grants and funding
LinkOut - more resources
Full Text Sources
Other Literature Sources

