. 2014 Feb 27;2(3):295-310.
doi: 10.1016/j.stemcr.2014.01.009. eCollection 2014 Mar 11.

Modeling hippocampal neurogenesis using human pluripotent stem cells

Affiliations

Modeling hippocampal neurogenesis using human pluripotent stem cells

Diana Xuan Yu et al. Stem Cell Reports. .

Erratum in

  • Stem Cell Reports. 2014 Jul 8;3(1):217

Abstract

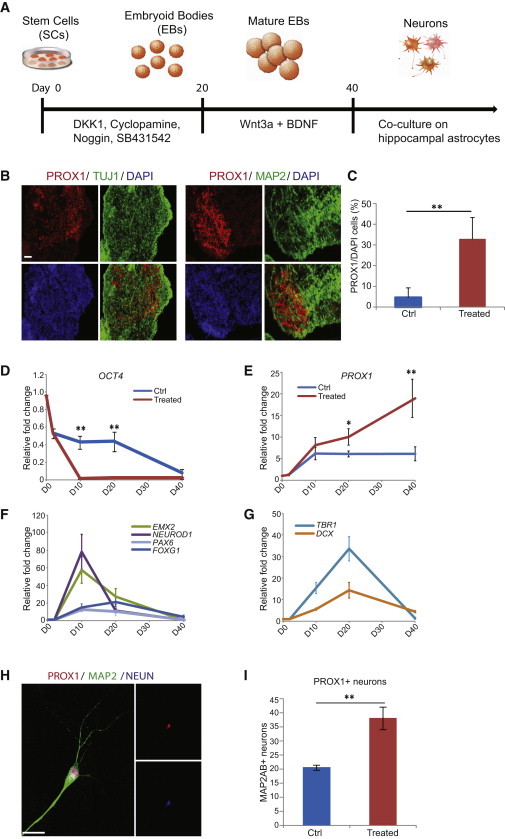
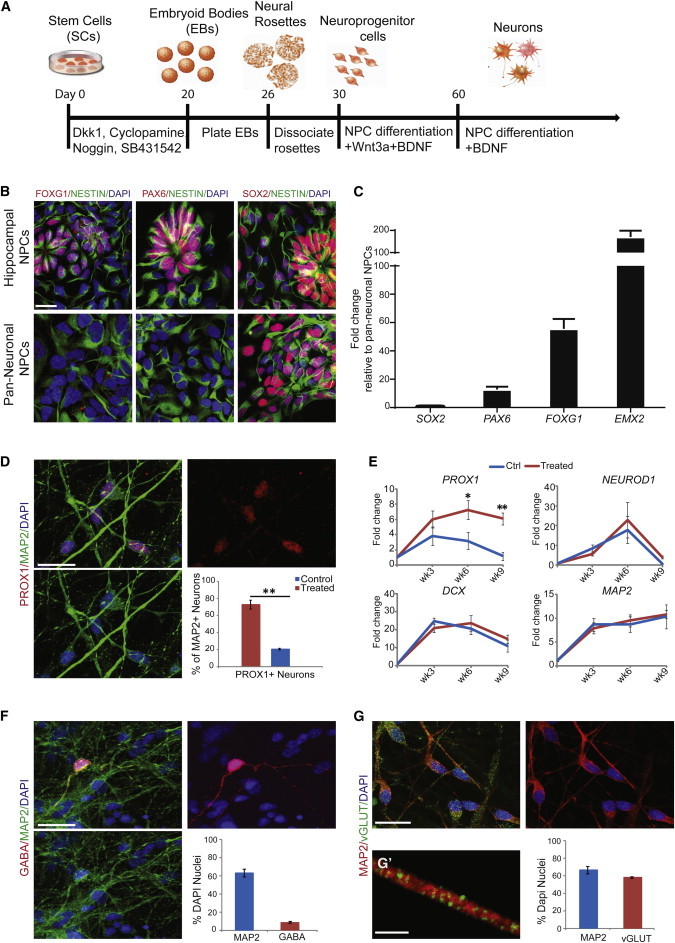
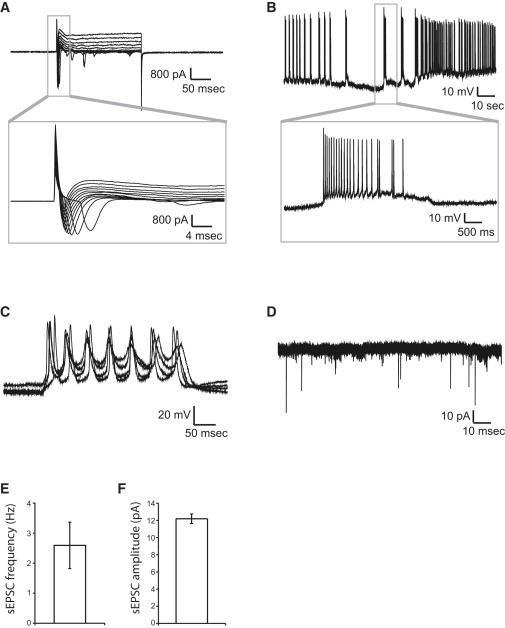
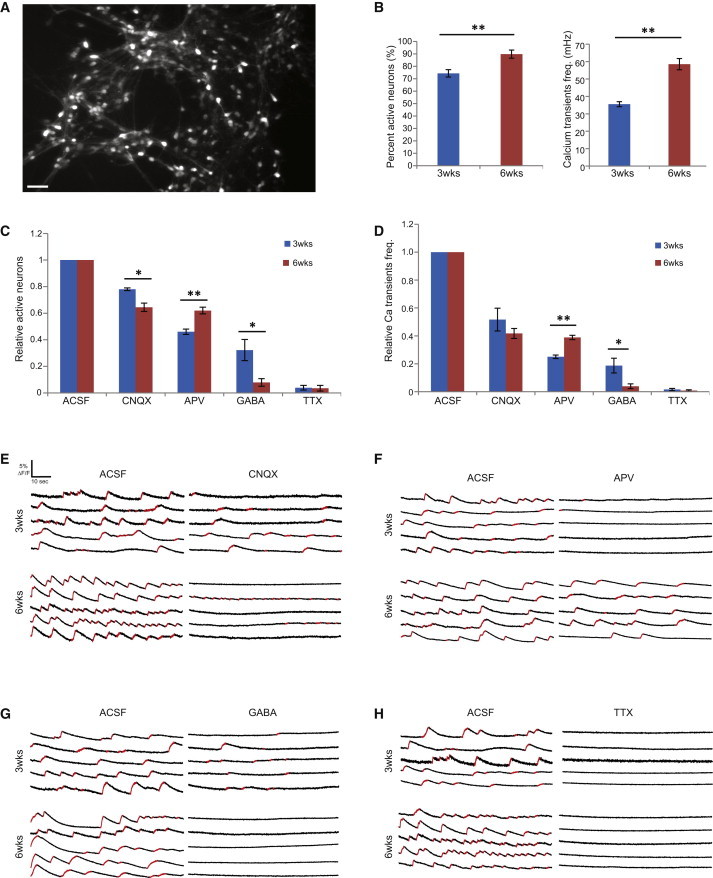
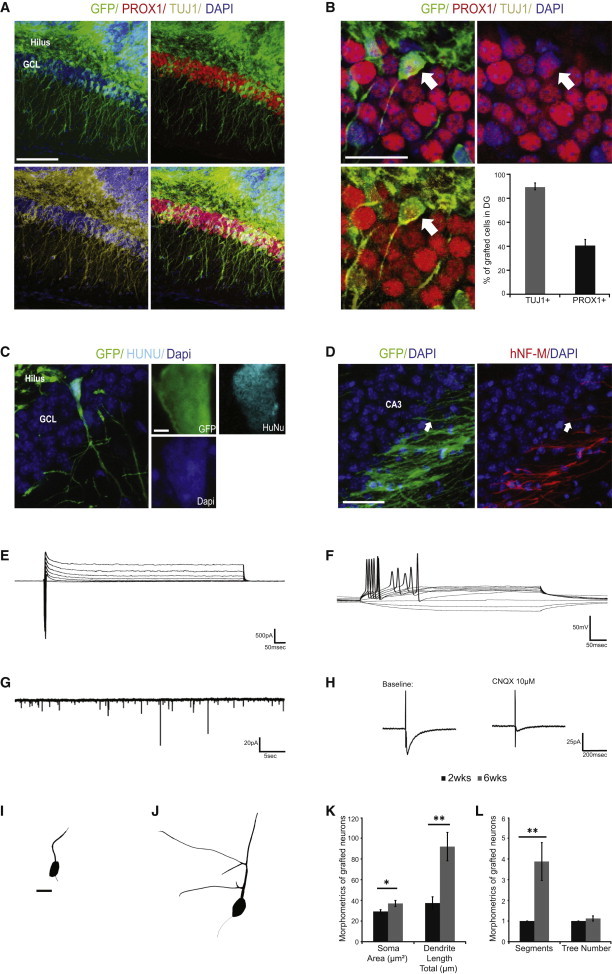
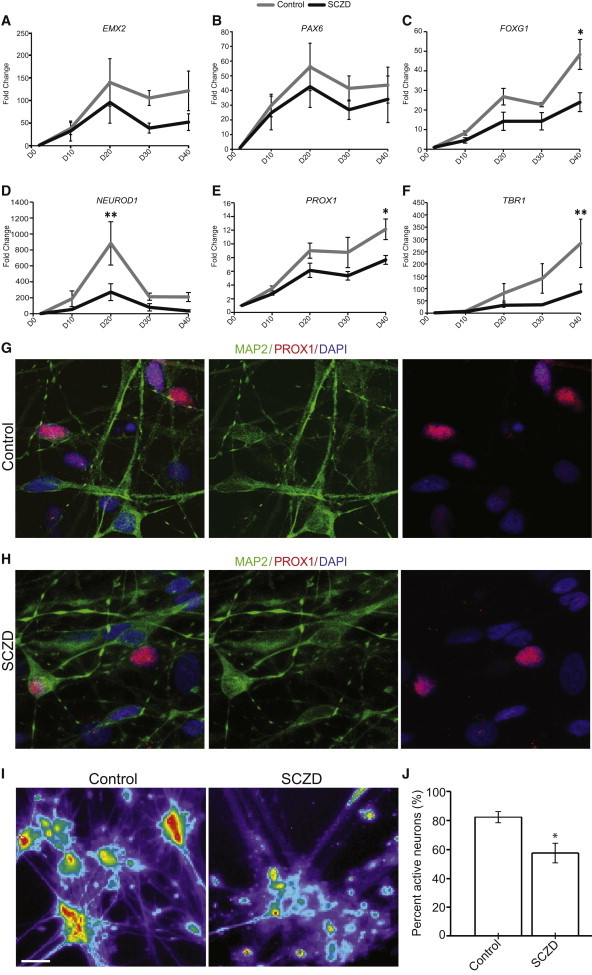
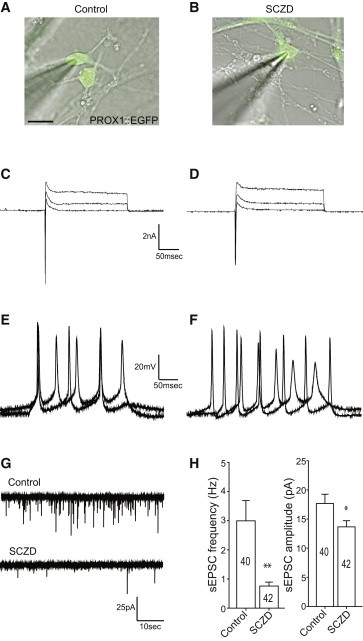
The availability of human pluripotent stem cells (hPSCs) offers the opportunity to generate lineage-specific cells to investigate mechanisms of human diseases specific to brain regions. Here, we report a differentiation paradigm for hPSCs that enriches for hippocampal dentate gyrus (DG) granule neurons. This differentiation paradigm recapitulates the expression patterns of key developmental genes during hippocampal neurogenesis, exhibits characteristics of neuronal network maturation, and produces PROX1+ neurons that functionally integrate into the DG. Because hippocampal neurogenesis has been implicated in schizophrenia (SCZD), we applied our protocol to SCZD patient-derived human induced pluripotent stem cells (hiPSCs). We found deficits in the generation of DG granule neurons from SCZD hiPSC-derived hippocampal NPCs with lowered levels of NEUROD1, PROX1, and TBR1, reduced neuronal activity, and reduced levels of spontaneous neurotransmitter release. Our approach offers important insights into the neurodevelopmental aspects of SCZD and may be a promising tool for drug screening and personalized medicine.


Figures

Figure 1
Figure 1
Generation of Hippocampal Granule Neurons from hESCs Using Embryoid Bodies (A) Schematic representation of the differentiation paradigm for generating hippocampal granule neurons using free-floating embryoid bodies (EBs). (B) Immunostaining of EB cross sections at differentiation day 35 showed the presence of PROX1 with TUJ1 and MAP2AB. Scale bar, 100 μm. (C) Quantification of PROX1+ immunostaining in EBs at differentiation day 35 showed a higher percentage of PROX1+ nuclei in EBs treated with cocktail of factors. n = 3 biological replicates; two-tailed t-test. (D) qPCR for OCT4 expression in control and treated EBs over time. (E) qPCR for PROX1 expression in control and treated EBs over time. (F) Expression patterns of genes EMX2, PAX6, FOXG1, and NEUROD1 found in hippocampal neural progenitors. (G) Expression patterns of genes DCX and TBR1 found in the immature and mature hippocampal granule neurons. (H) Immunostaining of hippocampal granule neurons dissociated from EBs at differentiation day 40 and cocultured with hippocampal astrocytes for 4 weeks. Scale bar, 15 μm. (I) Quantification of immunostaining in 4-week cocultures showed an increased number of PROX1+ neurons in treated cultures. p < 0.05; ∗∗p < 0.01. In (C) and (I), n = 3 biological replicates; two-tailed t test. In (D)–(G), n = 3 biological replicates; two-way ANOVA and Bonferroni post hoc test. All data are presented as mean ± SEM.
Figure 2
Figure 2
Generation of Hippocampal Granule Neurons from hESCs Using Monolayer Neural Progenitor Cells (A) Schematic representation of the differentiation paradigm for generating hippocampal granule neurons using neural progenitor cells (NPCs). (B) Representative images showing the presence of FOXG1, PAX6, and SOX2 in hESC-derived hippocampal NPCs compared to pan-neuronal NPCs generated without a cocktail of factors. Scale bar, 20 μm. (C) qPCR showing increased levels of PAX6, FOXG1, and EMX2 in hESC-derived hippocampal NPCs. (D) Representative image and quantification of PROX1+ neurons at differentiation week 5. Scale bar, 30 μm. (E) qPCR for expression pattern of genes relevant to hippocampal neurogenesis. (F) Representative image and quantification of GABAergic neurons at differentiation week 5. Scale bar, 30 μm. (G) Representative image and quantification of glutamatergic neurons at differentiation week 5Scale bar, 30 μm. (G′) High-magnification image of vGLUT puncta on a Map2+ dendrite. Scale bar, 3 μm. p < 0.05, ∗∗p < 0.01. In (D), n = 3 biological replicates, two-tailed t test. In (C), (F), and (G), n = 3 biological replicates. In (E), n = 3 biological replicates; two-way ANOVA and Bonferroni post hoc test. All data are presented as mean ± SEM.
Figure 3
Figure 3
Whole-Cell Patch-Clamp Recordings of hESC-Derived Hippocampal Granule Neurons at Differentiation Week 4 (A–D) The majority of the neurons patched (eight out of ten) showed Na+/K+ currents (A) and evoked action potentials (C) as well as spontaneous bursts of action potentials (B) and spontaneous postsynaptic currents (D). (E and F) Quantification of the frequency and amplitude of spontaneous postsynaptic currents in hESC-derived hippocampal granule neurons at 4 weeks postdifferentiation. All data are presented as mean ± SEM.
Figure 4
Figure 4
Calcium Imaging of hESC-Derived Hippocampal Granule Neurons at Differentiation Week 3 and Week 6 (A) Representative image of field of neurons used for calcium imaging. Scale bar, 50 μm. (B) The percentage of active neurons and frequency of calcium transients significantly increased from week 3 to week 6, indicating formation and maturation of neuronal networks. (C and D) Pharmacological perturbation of the neuronal networks showed increased sensitivity to CNQX and GABA but reduced sensitivity to APV from week 3 to week 6. (E–H) Representative traces of intracellular calcium in response to pharmacological perturbations at week 3 and week 6. p < 0.05; ∗∗p < 0.01. In (B)–(D), n = 15 and 16 movies (1,026 and 1,392 neurons) for 3 weeks and 6 weeks, respectively; two-tailed t test. All data are presented as mean ± SEM.
Figure 5
Figure 5
Transplantation of Hippocampal NPCs into Dentate Gyrus of P14 NOD-SCID Mice (A) Grafted GFP+ NPCs gave rise to neurons integrated into the endogenous granule cell layer (GCL) of the DG. Scale bar, 100 μm. (B and C) Graft-derived neurons in the GCL are positive for neuronal markers Tuj1 and Prox1 and human antigen marker HuNu. Scale bar, 50 μm; n = 3 animals. (D) Graft-derived neurons extended processes along the endogenous mossy fiber path to CA3 region. Scale bar, 50 μm. (E) Na+/K+ currents of grafted neurons in voltage clamp. (F) Evoked action potentials in response to somatic current injection. (G) Trace showing spontaneous postsynaptic currents in grafted neurons. (H) Trace showing excitatory postsynaptic currents in grafted neurons in response to stimulation at perforant path. The response can be blocked by 10 μM CNQX. (I) Representative morphology of graft-derived neurons at week 2 posttransplantation. (J) Representative morphology of graft-derived neurons at week 6 posttransplantation. Scale bar, 10 μm. (K) Morphometric analysis of graft-derived neurons showing increased soma size and total dendritic lengths between week 2 and week 6 posttransplantation. (L) Morphometric analysis of graft-derived neurons showing an increased number of dendritic segments and a similar number of dendritic trees between week 2 and week 6 posttransplantation. p < 0.05; ∗∗p < 0.01. n = 16 neurons traced; two-tailed t test. All data are presented as mean ± SEM.
Figure 6
Figure 6
Reduced Levels of Hippocampal Neurogenesis from SCZD NPCs (A–C) qPCR for genes expressed in hippocampal NPCs revealed comparable levels of EMX2 and PAX6 but reduced levels of FOXG1 in SCZD hiPSC lines differentiated using the EB method. (D–F) PCR for genes expressed in hippocampal granule neurons showed reduced levels of NEUROD1, PROX1, and TBR1 in SCZD hiPSC lines differentiated using the EB method. (G and H) Representative images of immunostaining for Prox1+ neurons dissociated from EBs at differentiation day 40 and cocultured with hippocampal astrocytes for 4 weeks. Scale bar, 50 μm. (I) Pseudocolored images showing increases in florescent intensities of Fluo-4AM calcium indicator in control and SCZD neural networks. Scale bar, 50 μm. (J) The number of neurons with calcium transients is normalized to the total neurons imaged in each field of view as indicated with lentiviral synapsin/red fluorescent protein. The percentage of active neurons significantly decreased in SCZD neural networks. p < 0.05; ∗∗p < 0.01. In (A)–(F), n = 4 SCZD lines and 4 control lines with three biological replicates done for each line, two-way ANOVA and Bonferroni post hoc test. In (J), p < 0.05, n = 4 SCZD lines and 4 control lines, n = 20 and 22 wells imaged for SCZD and control lines (four to seven wells per line), respectively; two-tailed t test. Data are presented as mean ± SEM.
Figure 7
Figure 7
Attenuated Spontaneous Neurotransmitter Release in SCZD Neurons (A and B) Fluorescence micrographs of representative control (A) and SCZD (B) neurons labeled with the PROX1-EGFP lentiviral vector. Scale bar, 15 μm. (C–F) Electrophysiological properties of control and SCZD neurons; transient Na+ currents and sustained K+ currents in response to voltage step depolarizations in control (C) and SCZD (D) neurons (command voltage varied from −20 to +30 mV in 5 mV increments when cells were voltage-clamped at −70 mV); action potentials evoked by somatic current injections in control (E) and SCZD (F) neurons (cells current-clamped at −60 mV, injected currents from 10 to 20 pA). (G) Representative traces of spontaneous postsynaptic currents in control and SCZD neurons. (H) Quantification of the frequency and amplitude of postsynaptic currents in control and SCZD neurons. p < 0.05, ∗∗p < 0.01; n = 40 control neurons, 42 SCZD neurons; two-tailed t test. Data are presented as mean ± SEM.

Similar articles

Cited by

References

    1. Brennand K.J., Simone A., Jou J., Gelboin-Burkhart C., Tran N., Sangar S., Li Y., Mu Y., Chen G., Yu D. Modelling schizophrenia using human induced pluripotent stem cells. Nature. 2011;473:221–225. - PMC - PubMed
    1. Di Giorgio F.P., Boulting G.L., Bobrowicz S., Eggan K.C. Human embryonic stem cell-derived motor neurons are sensitive to the toxic effect of glial cells carrying an ALS-causing mutation. Cell Stem Cell. 2008;3:637–648. - PubMed
    1. Dimos J.T., Rodolfa K.T., Niakan K.K., Weisenthal L.M., Mitsumoto H., Chung W., Croft G.F., Saphier G., Leibel R., Goland R. Induced pluripotent stem cells generated from patients with ALS can be differentiated into motor neurons. Science. 2008;321:1218–1221. - PubMed
    1. Erickson K.I., Prakash R.S., Voss M.W., Chaddock L., Heo S., McLaren M., Pence B.D., Martin S.A., Vieira V.J., Woods J.A. Brain-derived neurotrophic factor is associated with age-related decline in hippocampal volume. J. Neurosci. 2010;30:5368–5375. - PMC - PubMed
    1. Ganguly K., Schinder A.F., Wong S.T., Poo M. GABA itself promotes the developmental switch of neuronal GABAergic responses from excitation to inhibition. Cell. 2001;105:521–532. - PubMed

Publication types

MeSH terms

Substances