. 2014 Jun;24(6):906-19.
doi: 10.1101/gr.166702.113. Epub 2014 Mar 25.

Widespread context dependency of microRNA-mediated regulation

Affiliations

Widespread context dependency of microRNA-mediated regulation

Florian Erhard et al. Genome Res. 2014 Jun.

Abstract

Gene expression is regulated in a context-dependent, cell-type-specific manner. Condition-specific transcription is dependent on the presence of transcription factors (TFs) that can activate or inhibit its target genes (global context). Additional factors, such as chromatin structure, histone, or DNA modifications, also influence the activity of individual target genes (individual context). The role of the global and individual context for post-transcriptional regulation has not systematically been investigated on a large scale and is poorly understood. Here we show that global and individual context dependency is a pervasive feature of microRNA-mediated regulation. Our comprehensive and highly consistent data set from several high-throughput technologies (PAR-CLIP, RIP-chip, 4sU-tagging, and SILAC) provides strong evidence that context-dependent microRNA target sites (CDTS) are as frequent and functionally relevant as constitutive target sites (CTS). Furthermore, we found the global context to be insufficient to explain the CDTS, and that flanking sequence motifs provide individual context that is an equally important factor. Our results demonstrate that, similar to TF-mediated regulation, global and individual context dependency are prevalent in microRNA-mediated gene regulation, implying a much more complex post-transcriptional regulatory network than is currently known. The necessary tools to unravel post-transcriptional regulations and mechanisms need to be much more involved, and much more data will be needed for particular cell types and cellular conditions in order to understand microRNA-mediated regulation and the context-dependent post-transcriptional regulatory network.


Figures

Figure 1.
Figure 1.
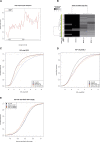
Validation of PAR-CLIP experiments. (A) The distribution of relative positions of target sites on mRNAs is shown. The x-axis represents the average length of 5′ untranslated regions (5′UTR), the coding regions (CDS), and the 3′ untranslated regions of all transcripts with at least one PAR-CLIP cluster. Each transcript was divided into 60 bins, and the relative frequency of target sites falling into each bin is shown on the y-axis. The data clearly illustrate the preferences of target sites in the 3′UTR as compared to CDS and 5′UTR. Viral microRNAs have the same preferences as cellular microRNAs. (B) The normalized number of reads in each cluster (rows) for each of the independent PAR-CLIP experiments (columns) is shown for KSHV microRNA target sites in the four PAR-CLIP libraries. KSHV-negative cell lines (columns 1 and 2) almost exclusively have no reads, whereas for KSHV-positive cell lines, dozens to hundreds of reads are observed per target site. Replicates are highly correlated, indicating high reproducibility. The additional annotations on the left side indicate the part of the transcript where a cluster is located (orange, 5′-UTR; yellow, coding; green, 3′-UTR; gray, not located on known mRNA) and the expression of the transcript in all experiments (red, at least twofold lower expression than the mean expression value for this transcript across all experiments; light red, at least 1.4-fold lower expression than the mean; light blue, at least 1.4-fold higher expression; blue, at least twofold higher expression). We also visualized and inspected individual target sites (Supplemental Fig. S1). (C,D) The log2 RIP-chip enrichment distributions of mRNAs only containing target sites of cellular microRNAs, only containing KSHV microRNA target sites, and containing target sites from both cellular and KSHV microRNAs in the uninfected cell line DG75 and the KSHV positive cell line BCBL1, respectively. KSHV targets are enriched in BCBL1 but not in DG75. (E) The mRNA half-life ratios are shown for the same sets of genes as in C and D. The half-life of mRNAs with KSHV target sites is significantly reduced in BCBL1.
Figure 2.
Figure 2.
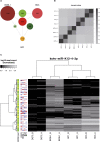
Comparison of PAR-CLIP data sets. (A) The number of target sites observed only in individual cell lines (outermost labeled circles), in two cell lines (circles on the edges between cell lines), and in all three cell lines (center circle), for KSHV microRNA target sites. Relatively few target sites appear to be active in multiple cell lines (see Supplemental Fig. S2A for overlaps of cellular microRNA targets). (B) Summary of all pairwise overlaps for clusters of cellular and viral microRNAs in all data sets. The Jaccard index (J) is the number of clusters in the intersection divided by the total number of clusters in any of the two experiments. Jaccard indices of ∼70% for all replicate measurements indicate high reproducibility, whereas comparisons across cell lines show relatively low overlap (J < 40%) (see also Supplemental Fig. S2). (C) The PAR-CLIP read heatmap for target sites of the KSHV microRNA miR-K12-4-3p (see Fig. 1B for more information about PAR-CLIP read heatmaps). Between KSHV-positive cell lines, there is no correlation, but there are distinct clusters of target sites. No obvious dependency between clusters and mRNA expression level is observable.
Figure 3.
Figure 3.
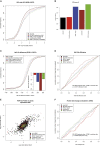
PAR-CLIP targets in RIP-chip experiments, mRNA half-life measurements, and expression measurements. (A) Differential RIP-chip enrichment scores (PC2 scores; positive values indicate higher enrichment in BCBL1 than in DG75). Generally, KSHV microRNA targets active in BCBL1 are significantly shifted toward higher values as compared to all other genes with any PAR-CLIP target site, in contrast to KSHV target sites exclusively active in BC1 or BC3 and not in BCBL1. B illustrates this further: The enrichment of genes with any KSHV site, with a constitutive or a BCBL1 exclusive site over genes with BC1/BC3 exclusive sites among all genes with PC2 score > 2 is about twofold in all cases. (C) Distributions of half-life differences between BCBL1 and DG75 for all genes with PAR-CLIP target sites. Thus, positive values indicate a longer mRNA half-life in BCBL1 than in DG75. Genes with KSHV microRNA targets active in BCBL1 tend to have shorter half-lives in BCBL1 than in DG75. This is highly significant for all BCBL1 target genes as well as the constitutive targets but not for BCBL1-specific targets, even if their half-life is on average ∼20 min shorter in BCBL1 than in DG75. However, KSHV microRNA targets that are inactive in BCBL1 do not show any shift in their half-lives. (D) The difference between targets active exclusively in BCBL1 is statistically significantly different from targets active exclusively in BC1 or BC3, when their ranks among all PAR-CLIP targets are considered. (E) Genes are scattered according to their mRNA log2 fold changes between BCBL1 and DG75 on the x-axis and to their protein log2 fold changes on the y-axis. In both dimensions, none of the KSHV target sets is significantly down-regulated on either the mRNA or protein level (Supplemental Fig. S5). However, target sites active in BCBL1 appear to be shifted toward the bottom right. These sites correspond to genes whose protein level fold change between BCBL1 and DG75 is lower than expected from the mRNA level. (F) The ranks of protein fold changes normalized to their mRNA levels for all gene sets considered. Normalized protein fold changes are significantly lower for genes with BCBL1-specific target sites than for genes with target sites inactive in BCBL1 (P < 0.01, Wilcoxon rank sum test) (see also Supplemental Fig. S3).
Figure 4.
Figure 4.
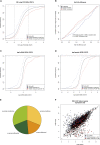
Analysis of context-dependent targets of cellular microRNAs. (A) Distributions of the differential RIP-chip scores as compared to all genes with any PAR-CLIP target sites (see also Fig. 3A). Both targets exclusively active in DG75 as well as in BCBL1 are significantly shifted toward stronger association with RISC in their respective context. The vertical lines indicate a threshold for strongly differentially RISC-associated genes. In both cases, the respective context-dependent targets are more than twofold enriched over the background genes (∼10% of background genes in comparison to >20% of the target genes in both cases). (B) The rank distribution of half-life differences for both sets of context-dependent targets is shown (see also Fig. 3D). BCBL1-specific targets are significantly shifted toward lower half-life difference ranks in comparison to DG75-specific targets indicative for effects of context-dependent microRNA/target interactions in the respective context only. (C,D) The distributions of mRNA and protein fold changes between BCBL1 and DG75 for context-dependent targets of cellular microRNAs, respectively, as compared to the background of all genes with any PAR-CLIP target site. Clearly, based on mRNA as well as on protein levels, context-dependent targets are more highly expressed in their target context. This indicates that the target mRNA expression directly contributes to the cellular context of microRNA-mediated regulation. (E) Depiction of how many genes with context-dependent target sites (n = 311) are constitutively (less than twofold) expressed in both cell lines on an mRNA level and have a protein detected in both cell lines (n = 97), how many are differentially expressed but with a detected protein (n = 54), how many do not have a protein and are differential (n = 63), and how many without a detected protein are constitutive (n = 97). (F) Scatterplot of the microarray intensity measurements for all genes with a PAR-CLIP target site. Interestingly, there seem to be subpopulations of target genes that have extremely low expression values in one of the two contexts and high intensities in the other, where respective target sites are exclusively active. These may indeed correspond to not expressed genes in their inactive target context (see also Supplemental Fig. S4).
Figure 5.
Figure 5.
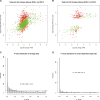
Comparison of mRNA fold changes to PAR-CLIP read count fold changes. (A) Scatterplot comparing mRNA fold changes to PAR-CLIP read count fold changes of all target sites of the cellular microRNAs analyzed. For the PAR-CLIP data, a pseudocount of 1 was used. Green dots represent target sites that can be explained by the mRNA fold change while respecting sampling noise of the read counts, whereas orange and red dots correspond to significant outliers (P < 0.05 and P < 0.01, respectively). The P-value distribution in C of all these target sites suggests that at least 14.9% (363 instances with P < 0.01 of overall 2436 target sites after subtraction of baseline indicated by the horizontal line) of all differential target site activities cannot be explained by the mRNA fold change and sampling noise. B and D illustrate this for the context-dependent microRNA/target interactions only. Here, >50% of all sites cannot be explained by mRNA levels (see also Supplemental Fig. S5).
Figure 6.
Figure 6.
Role of sequence motifs for context-dependent target sites. (A) The fraction of context-dependent target sites that contain a certain number of discriminative k-mers. Only target sites that cannot be explained by mRNA levels were used. A k-mer is discriminative if it occurs n times in the positive set (e.g., cellular BCBL1-exclusive sites in red) and does not occur in the corresponding negative set (e.g., cellular DG75-exclusive sites) (see Table 1). We sorted discriminative k-mers according to their number of occurrences in decreasing order and chose a cutoff for n based on our randomization experiments (Supplemental Fig. S6; Supplemental Table S3). In all cases, between 75% and 90% of all context-dependent target sites can be explained by a discriminative k-mer. (B) Putative explanations for the full sets of context-dependent target sites are illustrated. On average, >90% can be explained by either differential mRNA levels or the presence of a discriminative k-mer.
Figure 7.
Figure 7.
Conservation of target sites. Distributions of branch lengths of target sites are illustrated (see main text for a definition of branch lengths). Shaded regions indicate the maximal branch lengths of target sites conserved in primates, in primates and rodents, in mammals, and in vertebrates. All cellular microRNAs considered here are conserved in vertebrates. Constitutive target sites of these microRNAs are significantly more conserved (P < 0.00304, two-sided Kolmogorov-Smirnov test) than context-dependent target sites. Moreover, neither context-dependent nor constitutive target sites of viral microRNAs show evidence for evolutionary conservation (see also Supplemental Fig. S7).

Similar articles

Cited by

References

    1. Anders S, Huber W 2010. Differential expression analysis for sequence count data. Genome Biol 11: R106. - PMC - PubMed
    1. Baltz AG, Munschauer M, Schwanhäusser B, Vasile A, Murakawa Y, Schueler M, Youngs N, Penfold-Brown D, Drew K, Milek M, et al. 2012. The mRNA-bound proteome and its global occupancy profile on protein-coding transcripts. Mol Cell 46: 674–690 - PubMed
    1. Bartel DP 2004. MicroRNAs: genomics, biogenesis, mechanism, and function. Cell 116: 281–297 - PubMed
    1. Bartel DP 2009. MicroRNAs: target recognition and regulatory functions. Cell 136: 215–233 - PMC - PubMed
    1. Ben-Moshe NB, Avraham R, Kedmi M, Zeisel A, Yitzhaky A, Yarden Y, Domany E 2012. Context-specific microRNA analysis: identification of functional microRNAs and their mRNA targets. Nucleic Acids Res 40: 10614–10627 - PMC - PubMed

Publication types