. 2014 Mar 17;204(6):1045-61.
doi: 10.1083/jcb.201307106.

Both contractile axial and lateral traction force dynamics drive amoeboid cell motility

Affiliations

Both contractile axial and lateral traction force dynamics drive amoeboid cell motility

Effie Bastounis et al. J Cell Biol. .

Abstract

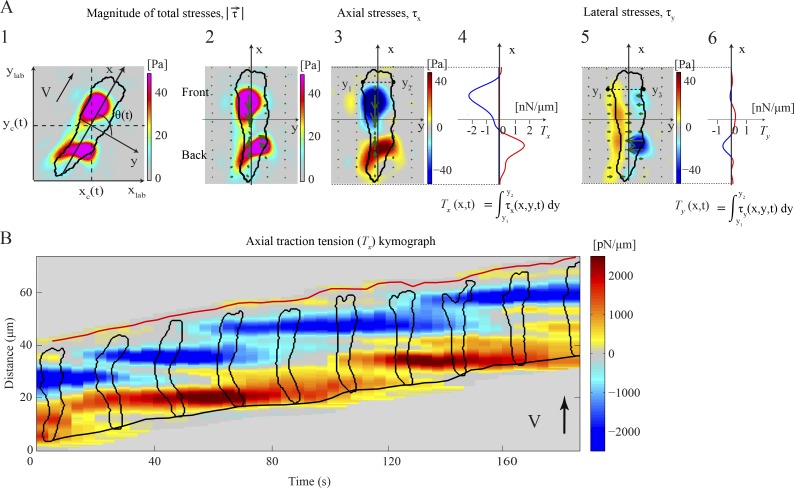
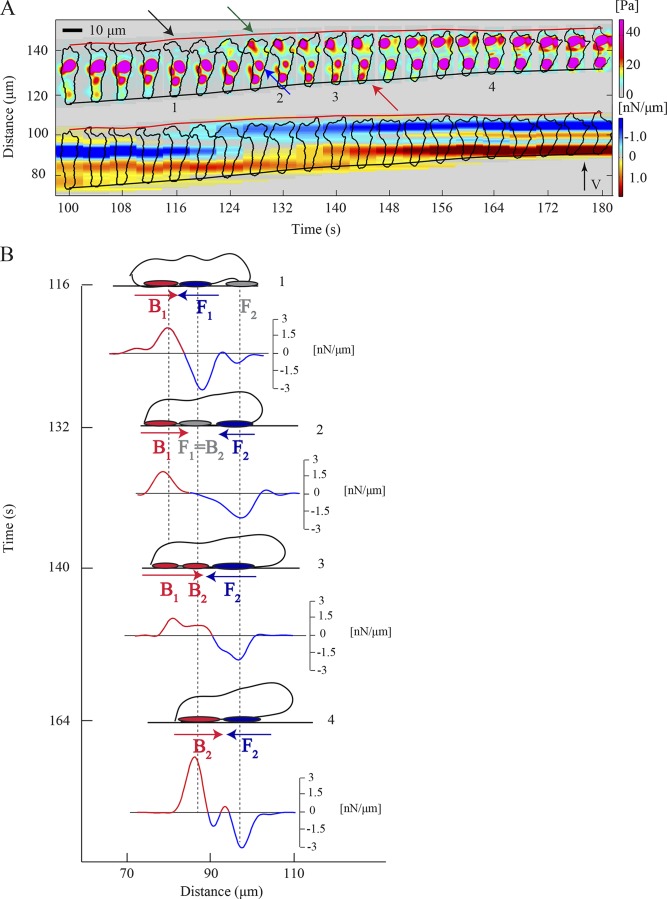
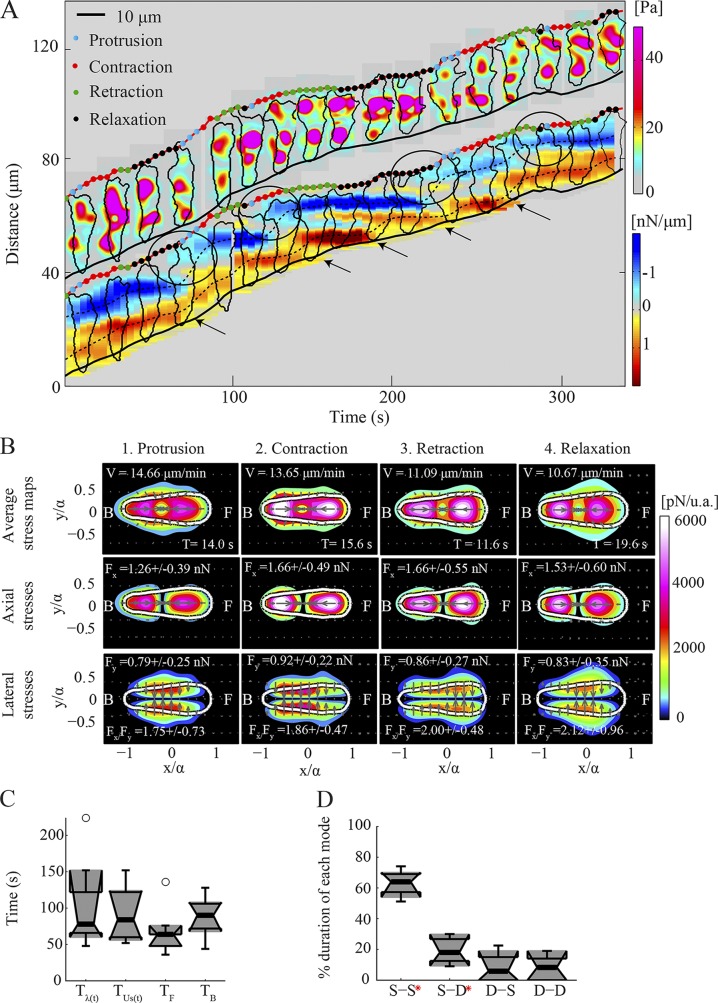
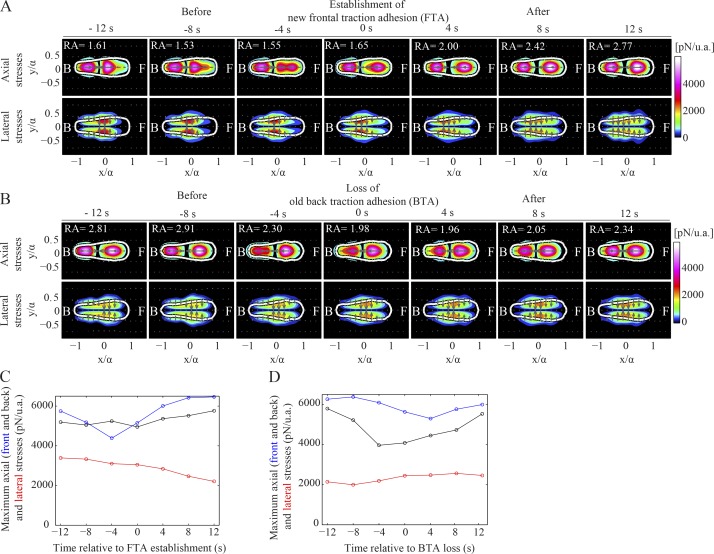
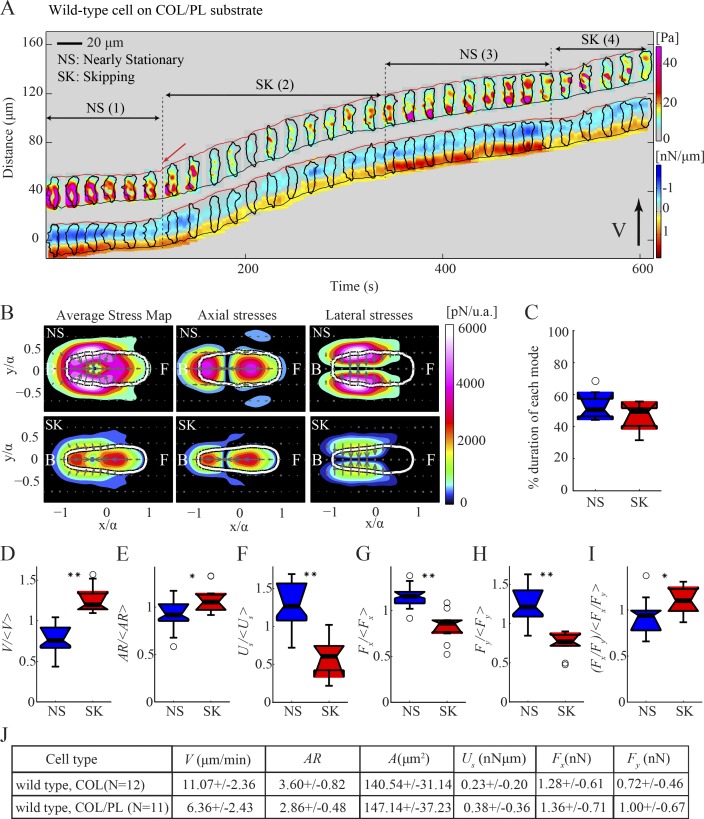
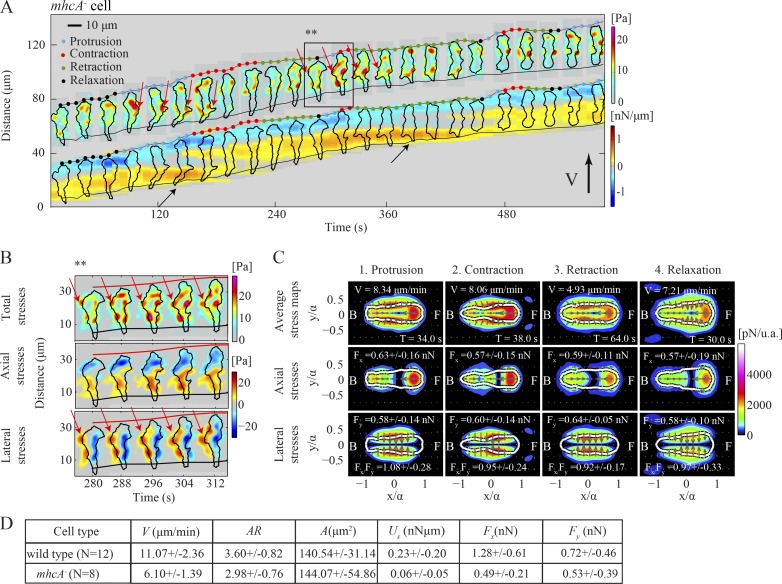
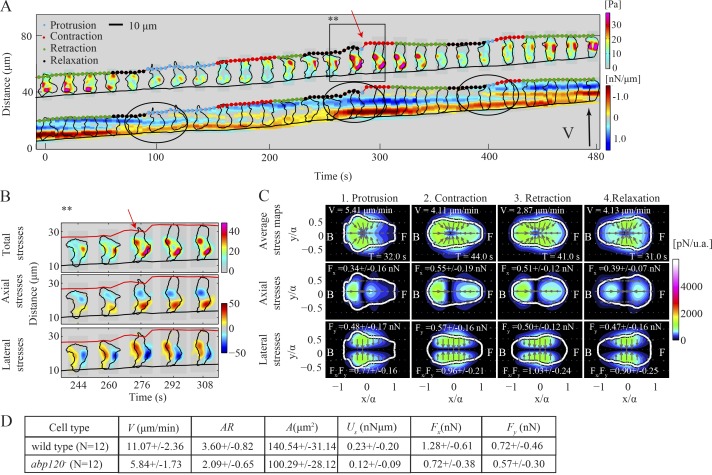
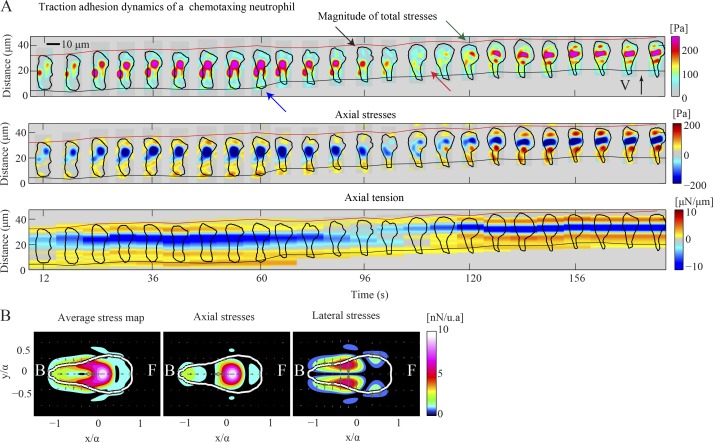
Chemotaxing Dictyostelium discoideum cells adapt their morphology and migration speed in response to intrinsic and extrinsic cues. Using Fourier traction force microscopy, we measured the spatiotemporal evolution of shape and traction stresses and constructed traction tension kymographs to analyze cell motility as a function of the dynamics of the cell's mechanically active traction adhesions. We show that wild-type cells migrate in a step-wise fashion, mainly forming stationary traction adhesions along their anterior-posterior axes and exerting strong contractile axial forces. We demonstrate that lateral forces are also important for motility, especially for migration on highly adhesive substrates. Analysis of two mutant strains lacking distinct actin cross-linkers (mhcA(-) and abp120(-) cells) on normal and highly adhesive substrates supports a key role for lateral contractions in amoeboid cell motility, whereas the differences in their traction adhesion dynamics suggest that these two strains use distinct mechanisms to achieve migration. Finally, we provide evidence that the above patterns of migration may be conserved in mammalian amoeboid cells.


Figures

Figure 1.
Figure 1.
Characterization of the dynamics of amoeboid motility with high spatiotemporal resolution. (A) Traction stresses (force/area) and tension (force/length) for a representative cell at a given instant of time. Color bars at the right side of each traction stress map indicate stress values in [Pa]. (1) Color contours mapping the instantaneous magnitude of the traction stresses, |τ|, in the laboratory reference frame (xlab, ylab). The black contour shows the cell outline. The axes (x, y) are aligned with the cell’s principal axes and their origin is located at the cell’s center of mass (xc, yc). V indicates the cell’s velocity and the black arrow shows the direction of motion. (2) |τ| in a reference frame rotated to coincide with (x, y). Green arrows show the intensity and direction of the stresses. (3) Axial traction stresses, τx. Stresses pointing toward the cell’s front are considered positive and are shown in red while negative stresses are shown in blue. (4) Integral of τx across the width of the cell (axial tension, Tx) as a function of the position along its length. The horizontal axis displays the Tx values in [nN/µm]. Positive and negative values are shown in red and blue, respectively. (5) Lateral traction stresses, τy. Stresses pointing toward the right of the cell are considered positive and are shown in red, whereas negative stresses are shown in blue. (6) Integral of τy across the width of the cell (lateral tension, Ty) as a function of the position along its length. (B) Spatiotemporal kymograph of Tx(x, t) as a function of the position along the cell trajectory, x, and time, t. At any given instant of time the centroid of the cell is displaced vertically according to its motion so that the cell is moving upward. The inclined red and black lines indicate the instantaneous position of the front and back cell edges. The black contours are cell outlines, shown every 20 s. The color map represents Tx in [pN/µm], plotted every 4 s. Red or blue patches represent positive or negative values of Tx and correspond to tensions aligned with the direction of cell motion or pointing in the opposite direction.
Figure 2.
Figure 2.
S-S motility mode. (A) Kymograph of the instantaneous magnitude of the traction stresses, |τ| (upper part), and traction tension, Tx (lower part), for a representative wild-type cell. The black arrow indicates pseudopod protrusion, followed by front TA formation (green arrow). The blue arrow shows the transition of the front TA to back and the red arrow points to the TA loss. The inclined red and black lines indicate the instantaneous position of the front and back cell edges. (B) Schematic representation of the time evolution of the magnitude and location of the TAs, illustrating the implementation of the S-S mode. A side view of the cell is shown as a cartoon for four instants of time and refers to the cell shown in A. The vertical axis indicates time and the horizontal axis depicts the cell location in the direction of motion. Front and back TAs are shown as blue and red ovals underneath the cell. Gray ovals represent weak, newly formed TAs or front TAs undergoing a transition in mechanical load and becoming back TAs. Blue and red arrows illustrate the direction of Tx at the cell’s front and back, respectively. Underneath each cartoon the corresponding Tx(x, t) is plotted. The vertical axis of each plot indicates the scale for Tx values [nN/µm]. Red or blue color indicates positive or negative Tx.
Figure 3.
Figure 3.
Wild-type cells implement the S-S mode periodically. (A) Kymograph of the instantaneous magnitude of the traction stresses, |τ| (upper part), and axial tension, Tx (lower part), for a representative wild-type cell (the cell shown in Fig. 2 corresponds to t = 100 s until t = 180 s). |τ| and cell contours are displayed every 20 s. The dots superimposed on the front cell edge indicate the phases of the cycle. Black circles show pseudopod protrusion and front TA formation. Black arrows show TA loss and back cell edge retraction. The inclined red and black lines indicate the instantaneous position of the front and back cell edges. (B) Phase-average traction stress maps in the cell-based reference frame for the cell shown in A. Each column corresponds to a different phase. The first, second, and third rows show the magnitude of the total, axial, and lateral traction stresses, respectively, for each phase. The color patches indicate the magnitude of the traction stresses, and the arrows denote their direction. The white contours depict the average cell shape. The cell’s front (F) and back (B) are indicated. For each phase, the mean duration (T), speed (V), axial and lateral force (Fx and Fy), and ratio of axial to lateral force (Fx/Fy) are displayed. (C) Box plots of the period of the oscillations of: the cell length, Tλ(t); strain energy, TUs(t); and the position of the minimum and maximum Tx at the cell’s front and back with respect to its centroid, TF and TB (n = 8). Circles represent outliers, and the box plots’ notched sections show the 95% confidence interval around the median. (D) Box plots of the relative time duration of each mode implemented by wild-type cells (n = 8). Red asterisks denote a distribution whose median is not 0 (P < 0.05).
Figure 4.
Figure 4.
Axial and lateral traction stresses during the establishment (and loss) of a TA. (A and B) Average stress maps during the establishment (A) and loss (B) of a TA (n = 8 cells). Top and bottom rows display the color contours of the magnitude of the axial and lateral traction stresses, respectively. Columns 1–7 show the average stress maps in a time interval of 12 s before and after the TA establishment or loss, and RA denotes the mean ratio of peak axial to lateral stress. (C and D) Average peak front axial (blue), back axial (black), and lateral stresses (red) during the establishment of a front TA (C) and the loss of a back TA (D). Average values refer to the cells shown in A and B. u.a., unit area.
Figure 5.
Figure 5.
Traction force dynamics in wild-type cells migrating on adhesive substrates. (A) Kymograph of the instantaneous magnitude of the traction stresses and axial tension for a wild-type cell chemotaxing on a highly adhesive substrate, showing that the cell alternates between the NS and SK modes. The inclined red and black lines indicate the instantaneous position of the front and back cell edges. (B) Left, middle, and right columns show the mean magnitude of the total, axial, and lateral stresses, respectively, in cell-based coordinates for the cell depicted in A during the NS (top) and SK (bottom) modes. (C) Box plots of the time duration of the NS (blue) and SK (red) modes (n = 9 cells). (D–I) Box plots of motility parameters corresponding to the NS and SK modes (n = 9 cells). Each parameter is normalized with its mean value for each cell. (D) Migration speed, V/V〉. (E) Aspect ratio, AR/AR〉. (F) Strain energy, Us/Us〉. (G) Axial force, Fx/Fx〉. (H) Lateral force, Fy/Fy〉. (I) Ratio of axial to lateral force, (Fx/Fy)/Fx/Fy〉. One or two asterisks denote statistically significant differences between medians (<0.05 or <0.01, respectively). (J) Table showing mean migration speed (V), aspect ratio (AR), cell area (A), strain energy (Us), axial and lateral force (Fx and Fy) for n = 11 cells on poly-L-Lys–coated substrate versus control (collagen only, n = 12).
Figure 6.
Figure 6.
Traction force dynamics in mhcA cells. (A and B) Kymograph of the instantaneous magnitude of the traction stresses and axial tension for a mhcA cell. Black and red arrows in A indicate stationary back and lateral TAs, respectively. A detailed view of the dynamics of the lateral TAs is shown in B, corresponding to the time interval indicated by the black box in A. Top, middle, and bottom rows show the magnitude of the total, axial, and lateral stresses, respectively. The inclined red and black lines indicate the instantaneous position of the front and back cell edges. (C) Same as Fig. 3 B but now corresponding to the mhcA cell shown in A. (D) Same as Fig. 5 J for n = 8 mhcA and n = 12 wild-type cells.
Figure 7.
Figure 7.
Traction force dynamics in abp120 cells. (A and B) Kymograph of the instantaneous magnitude of the traction stresses and axial tension for an abp120 cell. The black circles in A denote protrusion events. A detailed view of the pseudopod protrusion resulting from sideways squeezing is shown in B, corresponding to the time interval indicated by the black box in A. Top, middle, and bottom rows show the magnitude of the total, axial, and lateral stresses, respectively. The inclined red and black lines indicate the instantaneous position of the front and back cell edges. (C) Same as Fig. 3 B but corresponding to the abp120 cell shown in A. (D) Same as Fig. 5 J for n = 12 abp120 and n = 12 wild-type cells.
Figure 8.
Figure 8.
Traction force dynamics in a dHL60 cell. (A) Kymograph of the instantaneous magnitude of the traction stresses (top), axial stresses (middle), and axial traction tension (bottom) shown every 6 s for a chemotaxing dHL60 cell. The black arrow indicates pseudopod protrusion, followed by front TA formation (green arrow). The red arrow shows the transition of the front TA to the back. The blue arrow points to the back TA loss. The inclined red and black lines indicate the instantaneous position of the front and back cell edges. (B) Average maps of the magnitude of total (left), axial (middle), and lateral (right) traction stresses in cell-based coordinates for the cell shown in A.

Similar articles

Cited by

References

    1. Alonso-Latorre B. 2010. Force and shape coordination in amoeboid cell motility. PhD thesis University of California, San Diego: 152 pp
    1. Alonso-Latorre B., Del Álamo J.C., Meili R., Firtel R.A., Lasheras J.C. 2011. An oscillatory contractile pole-force component dominates the traction forces exerted by migrating amoeboid cells. Cell. Mol. Bioeng. 4:603–615 10.1007/s12195-011-0184-9 - DOI - PMC - PubMed
    1. Bagorda A., Mihaylov V.A., Parent C.A. 2006. Chemotaxis: moving forward and holding on to the past. Thromb. Haemost. 95:12–21 - PubMed
    1. Balaban N.Q., Schwarz U.S., Riveline D., Goichberg P., Tzur G., Sabanay I., Mahalu D., Safran S., Bershadsky A.D., Addadi L., Geiger B. 2001. Force and focal adhesion assembly: a close relationship studied using elastic micropatterned substrates. Nat. Cell Biol. 3:466–472 10.1038/35074532 - DOI - PubMed
    1. Ballestrem C., Hinz B., Imhof B.A., Wehrle-Haller B. 2001. Marching at the front and dragging behind: differential alphaVbeta3-integrin turnover regulates focal adhesion behavior. J. Cell Biol. 155:1319–1332 10.1083/jcb.200107107 - DOI - PMC - PubMed

Publication types

LinkOut - more resources