A diverse array of cancer-associated MTOR mutations are hyperactivating and can predict rapamycin sensitivity
- PMID: 24631838
- PMCID: PMC4012430
- DOI: 10.1158/2159-8290.CD-13-0929
A diverse array of cancer-associated MTOR mutations are hyperactivating and can predict rapamycin sensitivity
Abstract
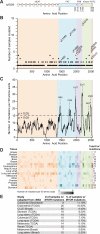
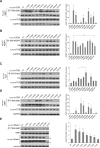
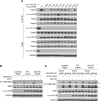
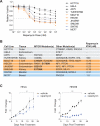
Genes encoding components of the PI3K-AKT-mTOR signaling axis are frequently mutated in cancer, but few mutations have been characterized in MTOR, the gene encoding the mTOR kinase. Using publicly available tumor genome sequencing data, we generated a comprehensive catalog of mTOR pathway mutations in cancer, identifying 33 MTOR mutations that confer pathway hyperactivation. The mutations cluster in six distinct regions in the C-terminal half of mTOR and occur in multiple cancer types, with one cluster particularly prominent in kidney cancer. The activating mutations do not affect mTOR complex assembly, but a subset reduces binding to the mTOR inhibitor DEPTOR. mTOR complex 1 (mTORC1) signaling in cells expressing various activating mutations remains sensitive to pharmacologic mTOR inhibition, but is partially resistant to nutrient deprivation. Finally, cancer cell lines with hyperactivating MTOR mutations display heightened sensitivity to rapamycin both in culture and in vivo xenografts, suggesting that such mutations confer mTOR pathway dependency.
Figures


Similar articles
-
Vascular tumors have increased p70 S6-kinase activation and are inhibited by topical rapamycin.Lab Invest. 2013 Oct;93(10):1115-27. doi: 10.1038/labinvest.2013.98. Epub 2013 Aug 12. Lab Invest. 2013. PMID: 23938603
-
Point mutations of the mTOR-RHEB pathway in renal cell carcinoma.Oncotarget. 2015 Jul 20;6(20):17895-910. doi: 10.18632/oncotarget.4963. Oncotarget. 2015. PMID: 26255626 Free PMC article.
-
The Enigma of Rapamycin Dosage.Mol Cancer Ther. 2016 Mar;15(3):347-53. doi: 10.1158/1535-7163.MCT-15-0720. Epub 2016 Feb 25. Mol Cancer Ther. 2016. PMID: 26916116 Free PMC article. Review.
-
Catalytic mTOR inhibitors can overcome intrinsic and acquired resistance to allosteric mTOR inhibitors.Oncotarget. 2014 Sep 30;5(18):8544-57. doi: 10.18632/oncotarget.2337. Oncotarget. 2014. PMID: 25261369 Free PMC article.
-
New inhibitors of the PI3K-Akt-mTOR pathway: insights into mTOR signaling from a new generation of Tor Kinase Domain Inhibitors (TORKinibs).Curr Top Microbiol Immunol. 2010;347:241-62. doi: 10.1007/82_2010_64. Curr Top Microbiol Immunol. 2010. PMID: 20549474 Review.
Cited by
-
Hemispheric cortical dysplasia secondary to a mosaic somatic mutation in MTOR.Neurology. 2015 May 19;84(20):2029-32. doi: 10.1212/WNL.0000000000001594. Epub 2015 Apr 15. Neurology. 2015. PMID: 25878179 Free PMC article.
-
Wnt/β-Catenin, Carbohydrate Metabolism, and PI3K-Akt Signaling Pathway-Related Genes as Potential Cancer Predictors.J Healthc Eng. 2019 Oct 20;2019:9724589. doi: 10.1155/2019/9724589. eCollection 2019. J Healthc Eng. 2019. PMID: 31781361 Free PMC article.
-
mTORC Inhibitors as Broad-Spectrum Therapeutics for Age-Related Diseases.Int J Mol Sci. 2018 Aug 8;19(8):2325. doi: 10.3390/ijms19082325. Int J Mol Sci. 2018. PMID: 30096787 Free PMC article. Review.
-
Mechanistic target of rapamycin inhibitors: successes and challenges as cancer therapeutics.Cancer Drug Resist. 2019 Dec 19;2(4):1069-1085. doi: 10.20517/cdr.2019.87. eCollection 2019. Cancer Drug Resist. 2019. PMID: 35582282 Free PMC article. Review.
-
Molecular basis for the functions of dominantly active Y35N and inactive D60K Rheb mutants in mTORC1 signaling.J Mol Cell Biol. 2020 Sep 1;12(9):741-744. doi: 10.1093/jmcb/mjaa025. J Mol Cell Biol. 2020. PMID: 32470140 Free PMC article. No abstract available.
References
-
- Cerami E, Gao J, Dogrusoz U, Gross BE, Sumer SO, Aksoy BA, et al. The cBio cancer genomics portal: an open platform for exploring multidimensional cancer genomics data. Cancer Discov. 2(5):401–4. Epub 2012/05/17. doi: 2/5/401 [pii] 10.1158/2159-8290.CD-12-0095. PubMed PMID: 22588877. - PMC - PubMed
Publication types
MeSH terms
Substances
Grants and funding
LinkOut - more resources
Full Text Sources
Other Literature Sources
Research Materials
Miscellaneous

