. 2014 Feb 27;10(2):e1003974.
doi: 10.1371/journal.ppat.1003974. eCollection 2014 Feb.

The Epstein-Barr virus-encoded microRNA MiR-BART9 promotes tumor metastasis by targeting E-cadherin in nasopharyngeal carcinoma

Affiliations

The Epstein-Barr virus-encoded microRNA MiR-BART9 promotes tumor metastasis by targeting E-cadherin in nasopharyngeal carcinoma

Chung-Yuan Hsu et al. PLoS Pathog. .

Abstract

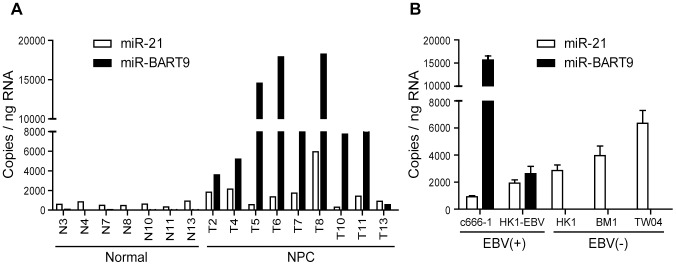
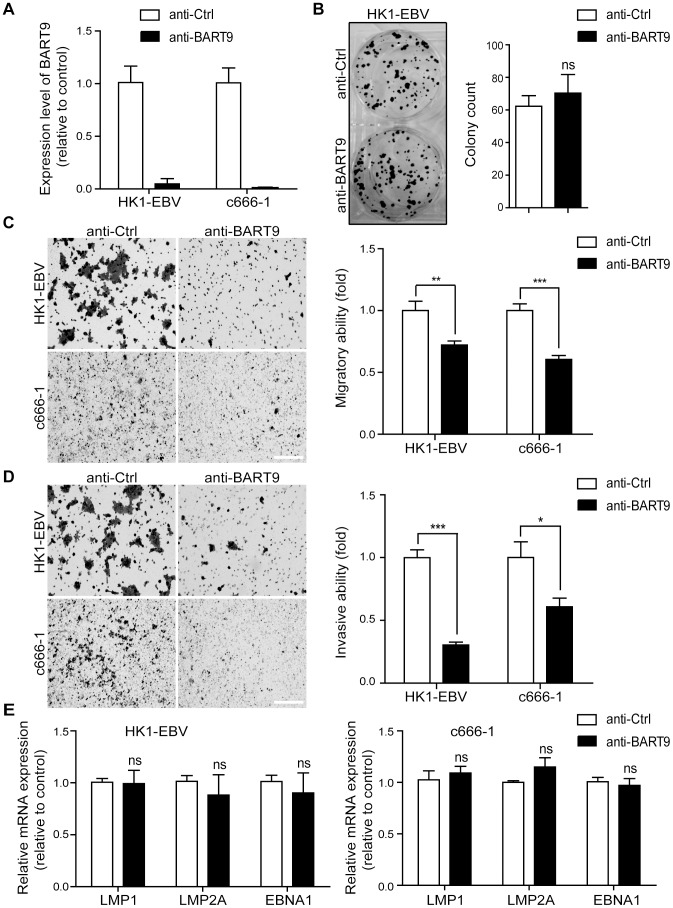
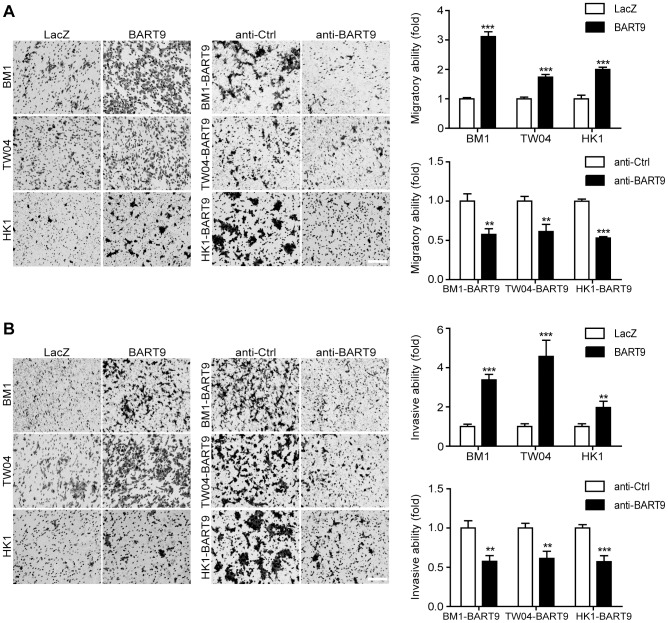
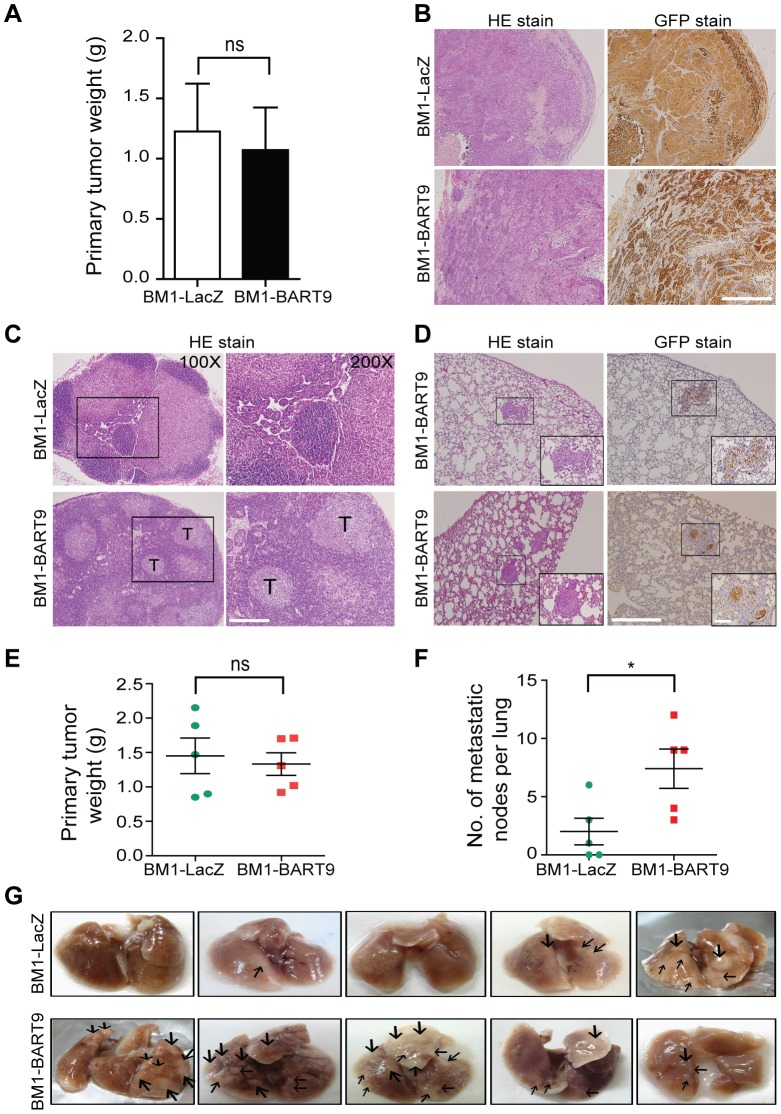
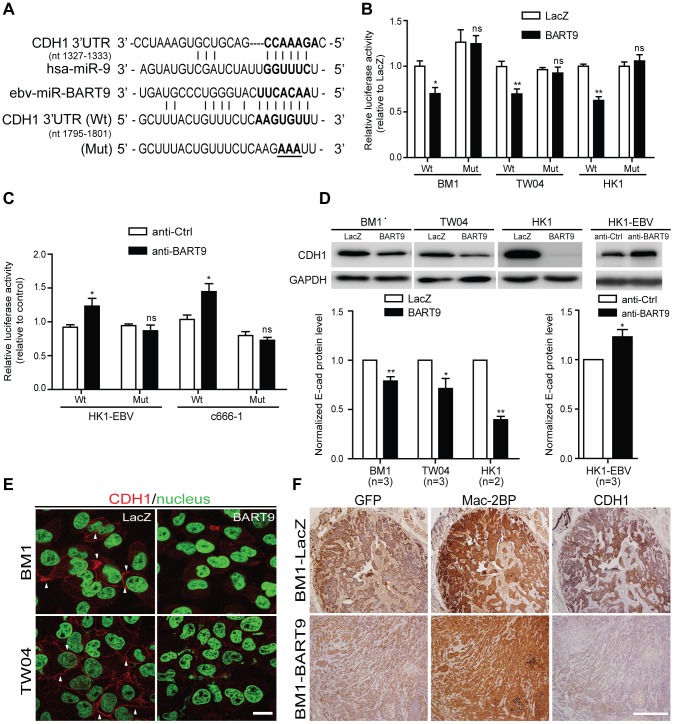
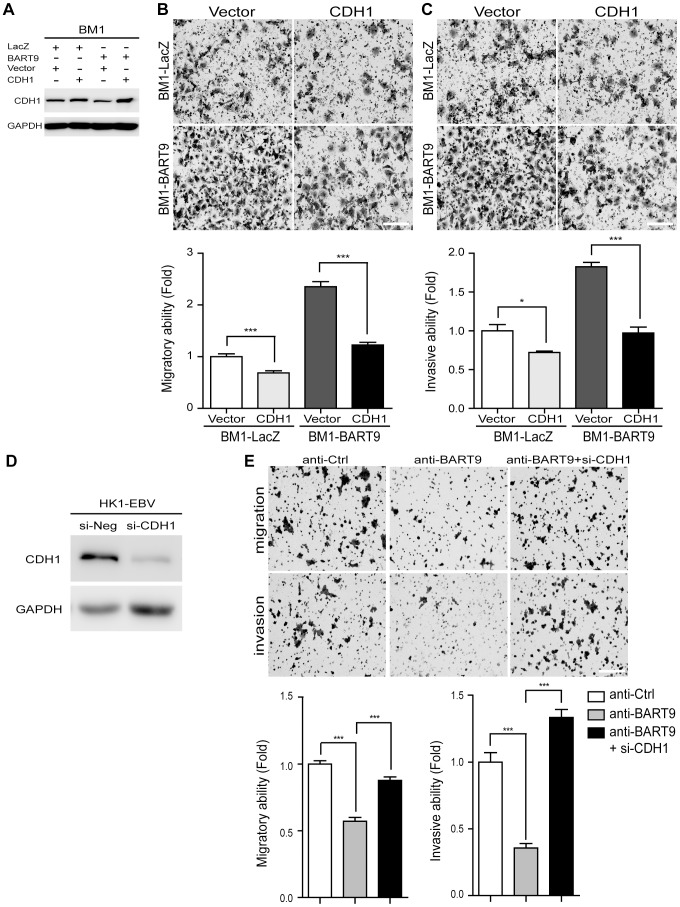
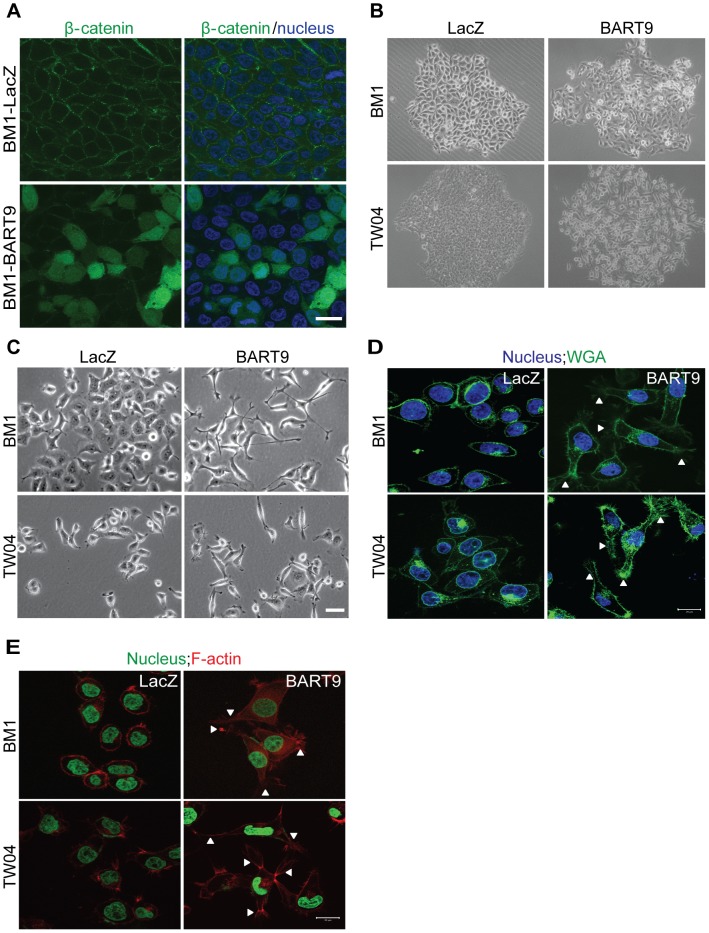
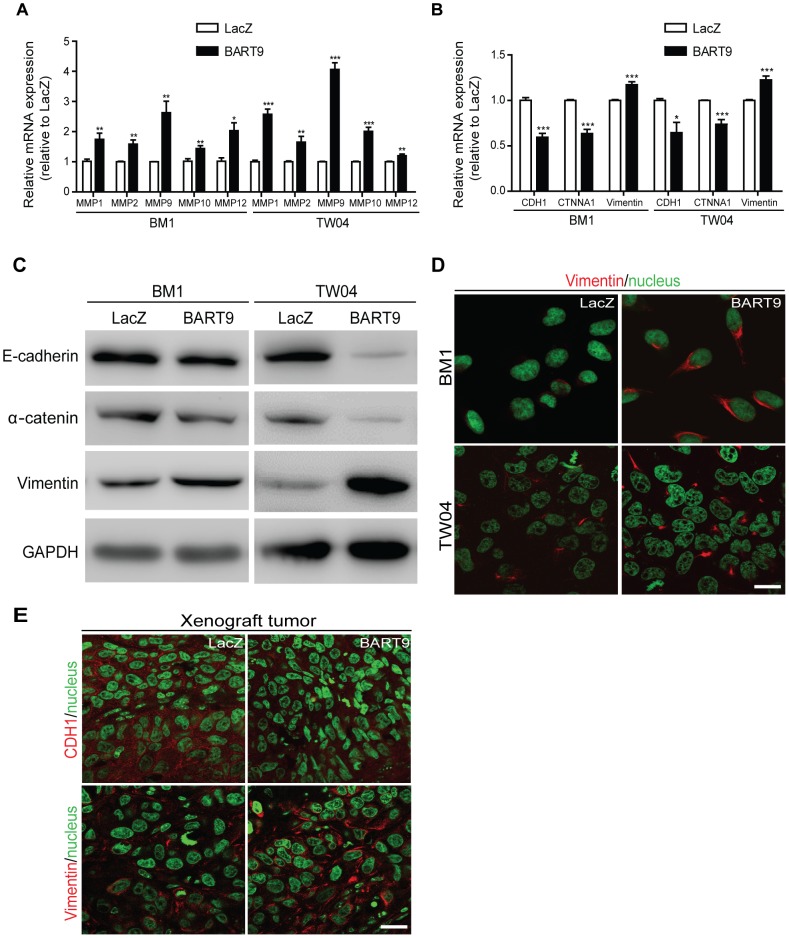
MicroRNAs (miRNAs) are a family of small RNA molecules that negatively regulate the expression of protein-coding genes and play critical roles in orchestrating diverse cellular processes. This regulatory mechanism is also exploited by viruses to direct their life cycle and evade the host immune system. Epstein-Barr virus (EBV) is an oncogenic virus that is closely associated with multiple human diseases, including nasopharyngeal carcinoma (NPC), which is a highly metastatic type of tumor and is frequently reported in South Asia. Several viral proteins have been found to promote the migration and invasiveness of NPC cells. However, not all tumor tissues express these viral oncoproteins, suggesting that other mechanisms may contribute to the aggressive behavior of NPC tumor cells. A previous sequencing study by our group revealed that the EBV miRNA miR-BART9 was expressed at high levels in all EBV-positive NPC tissues. In the present study, we used gain- and loss-of-function approaches to investigate the effect of miR-BART9 in EBV-negative and EBV-positive NPC cells. We discovered that miR-BART9 promotes the migration and invasiveness of cultured NPC cells. The promigratory activity observed in vitro was manifested as an enhanced metastatic ability in vivo. Computational analysis revealed that miR-BART9 may target E-cadherin, a membrane protein that is pivotal in preserving cell-cell junctions and the epithelial phenotype. Through biochemical assays and functional rescue analysis, we confirmed that miR-BART9 specifically inhibits E-cadherin to induce a mesenchymal-like phenotype and promote the migration of NPC cells. These results indicated that miR-BART9 is a prometastatic viral miRNA and suggested that high levels of miR-BART9 in EBV-positive NPC cells may contribute to the aggressiveness of tumor cells.


Conflict of interest statement

The authors have declared that no competing interests exist.

Figures

Figure 1
Figure 1. Expression of cellular miR-21 and EBV-miR-BART9 in NPC tissues and cells.
(A) Expression levels of miR-21 and miR-BART9 in 9 NPC tumor tissues and 7 adjacent normal tissues. (B) Expression of miR-21 and miR-BART9 in 2 EBV-positive and 3 EBV-negative NPC cell lines. Error bars indicate standard deviations for four replicate assays.
Figure 2
Figure 2. Depletion of endogenous miR-BART9 suppresses the migration and invasiveness of EBV-positive NPC cells.
(A) LNA-modified anti-BART9 efficiently decreases the level of mature miR-BART9 in EBV-positive HK1-EBV and C666-1 cells. HK1-EBV and C666-1 cells were treated with a 12.5 nM concentration of an LNA-modified miR-BART9 antisense oligo (anti-BART9) or a scramble control (anti-Ctrl) for 48 hr. The expression level of miR-BART9 was determined via qPCR. (B) HK1-EBV cells were treated with anti-BART9 or anti-Ctrl for 24 hr and the plated for colony formation assays. Colony formation activity was determined via crystal violet staining after 11 days in culture. (C, D) Transwell migration assay (C) and Matrigel invasion assay (D) for HK1-EBV and C666-1 cells. Cells were treated with a 12.5 nM concentration of an LNA-modified miR-BART9 antisense oligo (anti-BART9) or a scramble control (anti-Ctrl) for 48 hr before the migration or invasion assay. Images of cells adhered to the lower surface of the filter insert from a representative experiment are shown. (Left panel). The numbers of migratory or invasive cells were quantified using image J and expressed as the fold change relative to the appropriate cell line (bar graphs). (E) Expression levels of LMP1, LMP2A and EBNA1 in HK1-EBV and C666-1 cells treated with a 12.5 nM concentration of an LNA-modified miR-BART9 antisense oligo (anti-BART9) or a scramble control (anti-Ctrl). Total RNA was collected 48 hr after transfection and mRNA levels were determined via qPCR. The data were normalized to cellular EEF1A1 levels and expressed as the fold change relative to the appropriate cell line. The bar graphs in (B), (C), (D), (E) show means ± SEM from three independent experiments and two-tailed Student's t-tests were performed (*, P<0.05; **, P<0.01; ***, P<0.001).
Figure 3
Figure 3. miR-BART9 promotes the migration and invasion of EBV-negative NPC cells.
Transwell migration assay (A) and Matrigel invasion assay (B) for miR-BART9- or LacZ-expressing EBV-negative NPC cells. BM1, TW04 and HK1 cells were infected with the miR-BART9 (BART9) or control (LacZ) vector. Cells expressing miR-BART9 or LacZ were directly compared in terms of migratory activity or invasion activity in the same assay (Left panel). In a separate assay, cells expressing miR-BART9 were treated with a 12.5 nM concentration of an LNA-modified miR-BART9 antisense oligo (anti-BART9) or a scramble control (anti-Ctrl) for 48 hr before the migration or invasion assay (middle panel). Images of cells adhered to the lower surface of the filter insert from a representative experiment are shown. The numbers of migratory or invasive cells were quantified using image J and expressed as the fold change relative to the appropriate cell line (bar graphs). The data are expressed as the means ± SEM from three independent experiments and two-tailed Student's t-tests were performed (*, P<0.05; **, P<0.01; ***, P<0.001). Scale bar = 200 µm.
Figure 4
Figure 4. miR-BART9 enhances the metastatic activity of EBV-negative NPC cells in vivo.
(A) Primary tumor weights in nude mice subcutaneously injected with 1×10⁶ BM1 cells expressing miR-BART9 or LacZ, at 8 weeks after inoculation. The data are presented as the means ± SEM (20 mice per group). (B) Hematoxylin/eosin (HE)-stained (left) and GFP-stained (right) sections of primary tumors isolated from mice that received BM1 cells expressing miR-BART9 or LacZ. Images were acquired at 100×. Scale bar = 500 µm. (C) Representative images of metastatic NPC cells in lymph nodes. HE-stained sections of lymph nodes isolated from mice that received BM1 cells expressing miR-BART9 or LacZ. Rectangular boxes indicate tumor cells in lymph nodes. Images were acquired at 100× and 200×. Scale bar = 200 µm. (D) Representative images of miR-BART9-expressing BM1 cells after metastasis to lung tissue. HE-stained and GFP-stained sections of lung tissues isolated from mice that received miR-BART9-expressing BM1 cells. Rectangular boxes indicate clusters of micrometastatic cells in the lung. Images were acquired at 100× and 400×. Scale bar = 500 µm and 100 µm. (E and F) Weights of primary tumors (E) and numbers of visible lung metastases (F) in nude mice that received 5×10⁶ miR-BART9- or LacZ-expressing BM1 cells injected into the right flank, at week 8 after inoculation. The data are presented as the means ± SEM (each data point represents a different mouse; n = 5 mice per group). P value calculated by two-tailed Student's t-test. (G) Representative images of visible nodules on the surface of the lungs. Arrows indicate clusters of tumor cells that have colonized the lung tissue.
Figure 5
Figure 5. miR-BART9 directly targets E-cadherin.
(A) Predicted duplex formation between miR-BART9 and human E-cadherin 3′UTR (Wt). The seed sequence region is highlighted in bold. The putative target sequence of E-cadherin 3′UTR at nt 1795–1801. Mut indicates the mutated E-cadherin 3′UTR sequence used as a control in the reporter assay. Mutated bases are specified by underlining. (B) Luciferase activity of the wild type (Wt) or mutant (Mut) E-cadherin 3′UTR reporter in BM1, TW04 and HK1 cells expressing miR-BART9 or LacZ. (C) Luciferase activity of the wild type (Wt) or mutant (Mut) E-cadherin 3′UTR reporter in HK1-EBV and C666-1 cells treated with a 12.5 nM concentration of an LNA-modified miR-BART9 antisense oligo (anti-BART9) or a scramble control (anti-Ctrl). (D) Top panel: Immunoblotting analysis of E-cadherin in BM1, TW04 and HK1 cells expressing miR-BART9 or LacZ. (Left) or HK1-EBV cells treated with an LNA-modified miR-BART9 antisense oligo (anti-BART9) or scramble control (anti-Ctrl) (Right). GAPDH was used as a loading control. Bottom panel: E-cadherin protein levels were normalized to GAPDH levels, and then compared with the LacZ or anti-Ctrl cells whose normalized levels were expressed as 1.0. Bar graphs provide the means ± SEM of independent experiments and two-tailed Student's t-test were performed (*, P<0.05; **, P<0.01). (E) Representative immunofluorescence staining of E-cadherin and DAPI staining to detect the nucleus in BM1 and TW04 cells expressing miR-BART9 or LacZ. Arrows indicate cell-cell junctions. Scale bar = 20 µm. (F) Representative IHC staining of GFP, human Mac2BP and E-cadherin in sections of primary tumors formed by BM1 cells expressing miR-BART9 or LacZ. Scale bar = 500 µm.
Figure 6
Figure 6. E-cadherin plays a pivotal role in miR-BART9-mediated migration and invasion in NPC cells.
(A) Protein level of E-cadherin was increased after introducing pcDNA6/His-CDH1, which contains CDH1 open reading frame without 3′-UTR. Transwell migration assay (B) and Matrigel invasion assay (C) for miR-BART9- or LacZ-expressing BM1 cells with or without ectopic expression of E-cadherin. (D) HK1-EBV cells were transfected with 10 nM siRNA negative control (si-Neg) or CDH1 siRNA (si-CDH1). Expression of E-cadherin was examined by Western blotting. GAPDH was used as a loading control. (E) Transwell migration assay (Upper) and Matrigel invasion assay (Middle) of HK1-EBV cells treated with an LNA-modified miR-BART9 antisense oligo (anti-BART9), scramble control (anti-Ctrl), or anti-BART9 plus E-cadherin siRNA (si-CHD1). Images of cells adhered to the lower surface of the filter insert from a representative experiment are shown. The numbers of migratory or invasive cells were quantified using image J and are expressed as the fold change relative to the appropriate cell line (bar graphs). The data are expressed as the means ± SEM from three independent experiments and two-tailed Student's t-tests were performed (*, P<0.05; ***, P<0.001). Scale bar = 200 µm.
Figure 7
Figure 7. miR-BART9 induces β-catenin translocation and a mesenchymal-like morphology in EBV-negative NPC cells.
(A) Representative immunofluorescence staining of β-catenin and DAPI staining to detect the nucleus in BM1 cells expressing miR-BART9 or LacZ. Scale bar = 20 µm. (B) Phase contrast images of BM1 and TW04 cells infected with an miR-BART9-expressing vector (BART9) or control vector (LacZ). Cells were plated in 60-mm dishes at the same density. Images were acquired 9 days after plating. (C) Phase contrast images of BM1 and TW04 cells infected with an miR-BART9-expressing vector (BART9) or control vector (LacZ). Cells were seeded on 60-mm dishes at the same density. Images were acquired 2 days after seeding. Scale bar = 10 µm. (D) DAPI (nucleus) and FITC-conjugated wheat germ agglutinin (WGA) staining in BM1 and TW04 cells expressing the miR-BART9 or control vector (LacZ). Arrowheads indicate filopodia structures. Scale bar = 20 µm. (E) DAPI (nucleus) and Alexa Fluor 594-conjugated phalloidin (F-actin) staining in BM1 and TW04 cells expressing the miR-BART9 or control vector (LacZ). Arrowheads indicate stress fibers. Scale bar = 20 µm.
Figure 8
Figure 8. miR-BART9 up-regulates mesenchymal markers in EBV-negative NPC cells.
Expression levels of matrix metalloproteases MMP1, MMP2, MMP9, MMP10 and MMP12 (A) and E-cadherin (CDH1), α-catenin (CTNNA1) and vimentin (B) in BM1 and TW04 cells infected with lentivirus expressing the miR-BART9 or control (LacZ) vector. mRNA levels were determined via qPCR. The data were normalized to cellular EEF1A1 levels and expressed as the fold change relative to the appropriate cell line. Bar graphs provide the means ± SEM of three independent experiments and two-tailed Student's t-test were performed (*, P<0.05; **, P<0.01; ***, P<0.001). (C) Western blot analysis for the expression of indicated EMT markers. GAPDH protein was used as a protein loading control. (D) Representative immunofluorescence staining of vimentin and DAPI staining to detect the nucleus in BM1 and TW04 cells expressing miR-BART9 or LacZ. Scale bar = 20 µm. (E) Representative immunofluorescence staining of E-cadherin (CDH1) and vimentin and DAPI staining to detect the nucleus in sections of primary tumors formed by BM1 cells expressing miR-BART9 or LacZ. Scale bar = 20 µm.

Similar articles

Cited by

References

    1. Klein E, Kis LL, Klein G (2007) Epstein-Barr virus infection in humans: from harmless to life endangering virus-lymphocyte interactions. Oncogene 26 (9) 1297–305. - PubMed
    1. Tao Q, Young LS, Woodman CB, Murray PG (2006) Epstein-Barr virus (EBV) and its associated human cancers–genetics, epigenetics, pathobiology and novel therapeutics. Front Biosci 11: 2672–713. - PubMed
    1. Bar-Sela G, Kuten A, Minkov I, Gov-Ari E, Ben-Izhak O (2004) Prevalence and relevance of EBV latency in nasopharyngeal carcinoma in Israel. J Clin Pathol 57 (3) 290–3. - PMC - PubMed
    1. Mirzamani N, Salehian P, Farhadi M, Tehran EA (2006) Detection of EBV and HPV in nasopharyngeal carcinoma by in situ hybridization. Exp Mol Pathol 81 (3) 231–4. - PubMed
    1. Tsao SW, Tramoutanis G, Dawson CW, Lo AK, Huang DP (2002) The significance of LMP1 expression in nasopharyngeal carcinoma. Semin Cancer Biol 12 (6) 473–87. - PubMed

Publication types

MeSH terms

Grants and funding

This work was supported by grants from the National Science Counsel, Taiwan (NSC 100-2320-B-182-023 and NSC 101-2320-B-182-013-MY3), to HCC. The funders had no role in study design, data collection and analysis, decision to publish, or preparation of the manuscript.

LinkOut - more resources