RNA-DNA differences are generated in human cells within seconds after RNA exits polymerase II
- PMID: 24561252
- PMCID: PMC4918108
- DOI: 10.1016/j.celrep.2014.01.037
RNA-DNA differences are generated in human cells within seconds after RNA exits polymerase II
Abstract
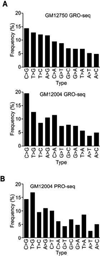
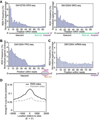
RNA sequences are expected to be identical to their corresponding DNA sequences. Here, we found all 12 types of RNA-DNA sequence differences (RDDs) in nascent RNA. Our results show that RDDs begin to occur in RNA chains ~55 nt from the RNA polymerase II (Pol II) active site. These RDDs occur so soon after transcription that they are incompatible with known deaminase-mediated RNA-editing mechanisms. Moreover, the 55 nt delay in appearance indicates that they do not arise during RNA synthesis by Pol II or as a direct consequence of modified base incorporation. Preliminary data suggest that RDD and R-loop formations may be coupled. These findings identify sequence substitution as an early step in cotranscriptional RNA processing.
Copyright © 2014 The Authors. Published by Elsevier Inc. All rights reserved.
Figures


Similar articles
-
The non-coding B2 RNA binds to the DNA cleft and active-site region of RNA polymerase II.J Mol Biol. 2013 Oct 9;425(19):3625-38. doi: 10.1016/j.jmb.2013.01.035. Epub 2013 Feb 8. J Mol Biol. 2013. PMID: 23416138 Free PMC article.
-
Human RNA Polymerase II Segregates from Genes and Nascent RNA and Transcribes in the Presence of DNA-Bound dCas9.Int J Mol Sci. 2024 Aug 1;25(15):8411. doi: 10.3390/ijms25158411. Int J Mol Sci. 2024. PMID: 39125980 Free PMC article.
-
RNA polymerase II associates with active genes during DNA replication.Nature. 2023 Aug;620(7973):426-433. doi: 10.1038/s41586-023-06341-9. Epub 2023 Jul 19. Nature. 2023. PMID: 37468626
-
RNA polymerase II transcriptional fidelity control and its functional interplay with DNA modifications.Crit Rev Biochem Mol Biol. 2015;50(6):503-19. doi: 10.3109/10409238.2015.1087960. Epub 2015 Sep 22. Crit Rev Biochem Mol Biol. 2015. PMID: 26392149 Free PMC article. Review.
-
Structural and biochemical analysis of DNA lesion-induced RNA polymerase II arrest.Methods. 2019 Apr 15;159-160:29-34. doi: 10.1016/j.ymeth.2019.02.019. Epub 2019 Feb 22. Methods. 2019. PMID: 30797902 Free PMC article. Review.
Cited by
-
RNA-DNA sequence differences in Saccharomyces cerevisiae.Genome Res. 2016 Nov;26(11):1544-1554. doi: 10.1101/gr.207878.116. Epub 2016 Sep 16. Genome Res. 2016. PMID: 27638543 Free PMC article.
-
Genomic Landscapes of Noncoding RNAs Regulating VEGFA and VEGFC Expression in Endothelial Cells.Mol Cell Biol. 2021 Jun 23;41(7):e0059420. doi: 10.1128/MCB.00594-20. Epub 2021 Jun 23. Mol Cell Biol. 2021. PMID: 33875575 Free PMC article.
-
Pause & go: from the discovery of RNA polymerase pausing to its functional implications.Curr Opin Cell Biol. 2017 Jun;46:72-80. doi: 10.1016/j.ceb.2017.03.002. Epub 2017 Mar 28. Curr Opin Cell Biol. 2017. PMID: 28363125 Free PMC article. Review.
-
The introduction of RNA-DNA differences underlies interindividual variation in the human IL12RB1 mRNA repertoire.Proc Natl Acad Sci U S A. 2015 Dec 15;112(50):15414-9. doi: 10.1073/pnas.1515978112. Epub 2015 Nov 30. Proc Natl Acad Sci U S A. 2015. PMID: 26621740 Free PMC article.
-
Splicing and transcription touch base: co-transcriptional spliceosome assembly and function.Nat Rev Mol Cell Biol. 2017 Oct;18(10):637-650. doi: 10.1038/nrm.2017.63. Epub 2017 Aug 9. Nat Rev Mol Cell Biol. 2017. PMID: 28792005 Free PMC article. Review.
References
-
- Ardehali MB, Lis JT. Tracking rates of transcription and splicing in vivo. Nature structural & molecular biology. 2009;16:1123–1124. - PubMed
Publication types
MeSH terms
Substances
Grants and funding
LinkOut - more resources
Full Text Sources
Other Literature Sources
Molecular Biology Databases
Research Materials

