

The distribution of sex acts and condom use within partnerships in a rural sub-Saharan African population
- PMID: 24558387
- PMCID: PMC3928170
- DOI: 10.1371/journal.pone.0088378
The distribution of sex acts and condom use within partnerships in a rural sub-Saharan African population
Abstract
Introduction: In an HIV/AIDS epidemic driven primarily by heterosexual transmission, it is important to have an understanding of the human sexual behaviour patterns that influence transmission. We analysed the distribution and predictors of within-partnership sexual behaviour and condom use in rural Zimbabwe and generated parameters for use in future modelling analyses.
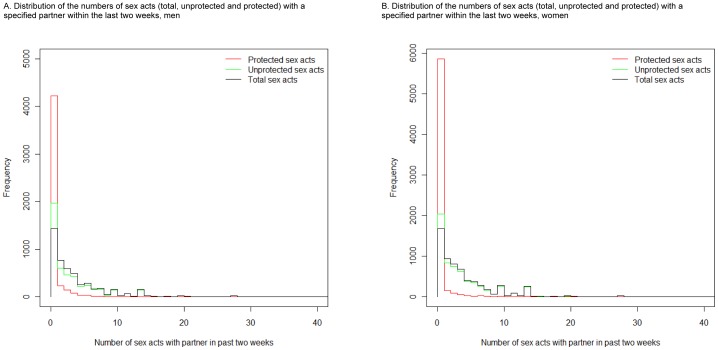
Methods: A population-based cohort was recruited from a household census in 12 communities. A baseline survey was carried out in 1998-2000 with follow-up surveys after 3 and 5 years. Statistical distributions were fitted to reported within-partnership numbers of total, unprotected and protected sex acts in the past two weeks. Multilevel linear and logistic regression models were constructed to assess predictors of the frequency of unprotected sex and consistent condom use.
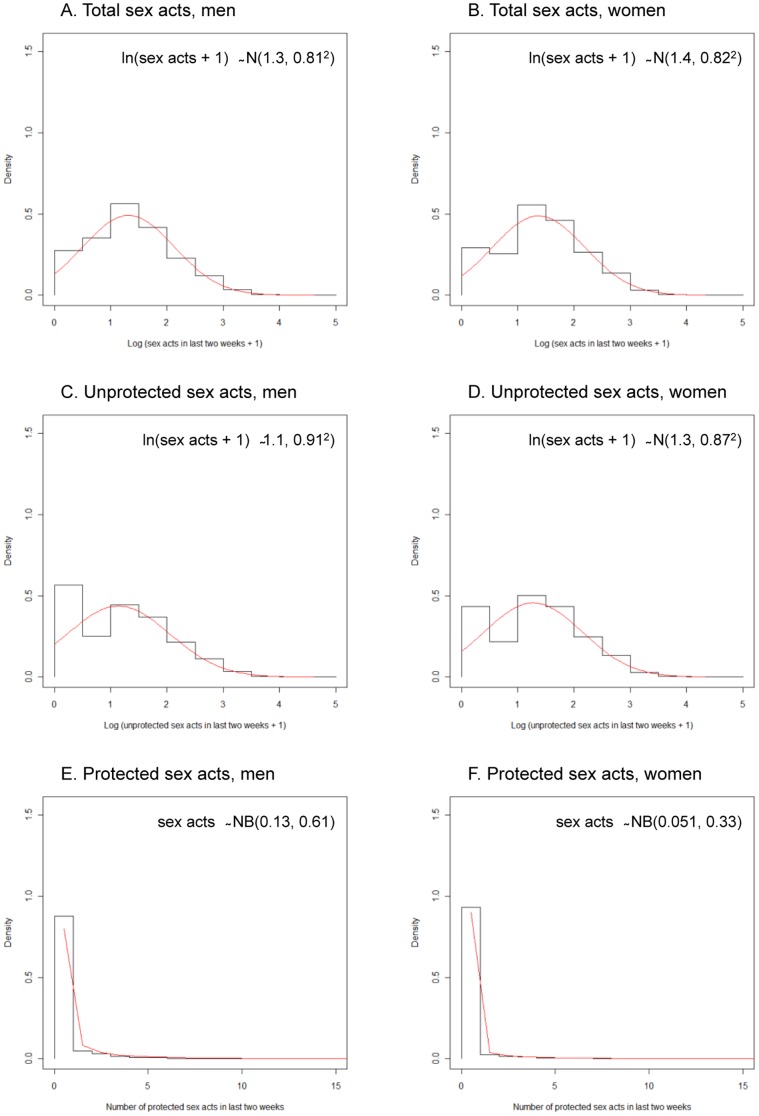
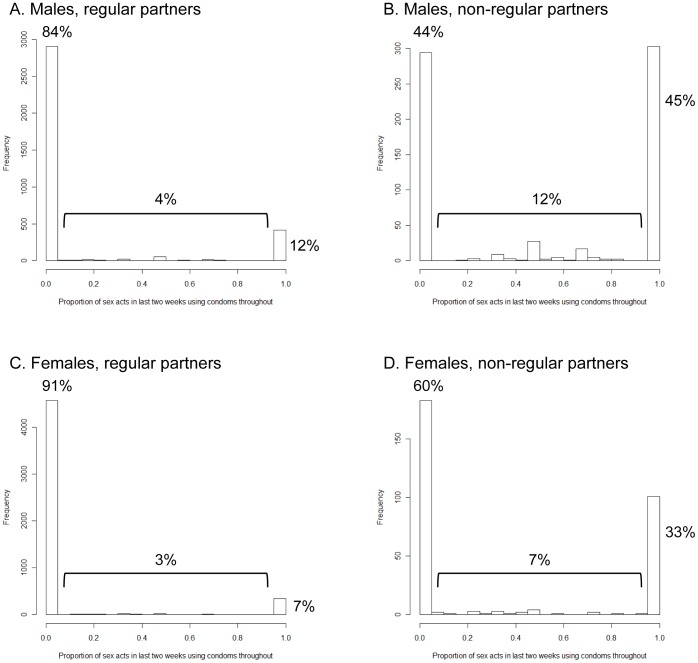
Results: A normal distribution of ln(sex acts+1) provided the best fit for total and unprotected sex acts for men and women. A negative binomial distribution applied to the untransformed data provided the best fit for protected sex acts. Condom use within partnerships was predominantly bimodal with at least 88% reporting zero or 100% use. Both men and women reported fewer unprotected sex acts with non-regular compared to regular partners (men: 0.26 fewer every two weeks (95% confidence interval 0.18-0.34); women: 0.16 (0.07-0.23)). Never and previously married individuals reported fewer unprotected sex acts than currently married individuals (never married men: 0.64 (0.60-0.67); previously married men: 0.59 (0.50-0.67); never married women: 0.51 (0.45-0.57); previously married women: 0.42 (0.37-0.47)). These variables were also associated with more consistent condom use.
Discussion: We generated parameters that will be useful for defining transmission models of HIV and other STIs, which rely on a valid representation of the underlying sexual network that determines spread of an infection. This will enable a better understanding of the spread of HIV and other STDs in this rural sub-Saharan population.
Conflict of interest statement
Figures
Similar articles
-
Patterns of condom use and sexual behavior among never-married women.Sex Transm Dis. 1993 Jul-Aug;20(4):201-8. doi: 10.1097/00007435-199307000-00005. Sex Transm Dis. 1993. PMID: 8211537
-
[Current status of the female condom in Africa].Sante. 1997 Nov-Dec;7(6):405-15. Sante. 1997. PMID: 9503499 Review. French.
-
Predictors of AIDS knowledge, condom use and high-risk sexual behaviour among women in Dar-es-Salaam, Tanzania.Int J STD AIDS. 1995 May-Jun;6(3):175-83. doi: 10.1177/095646249500600307. Int J STD AIDS. 1995. PMID: 7647120
-
Sexual risk of HIV infection among expatriates posted in AIDS endemic areas.AIDS. 1997 Jul 15;11(9):1173-81. doi: 10.1097/00002030-199709000-00014. AIDS. 1997. PMID: 9233466
-
AIDS in rural Africa: a paradigm for HIV-1 prevention.Int J STD AIDS. 1996 Jul;7(4):236-43. doi: 10.1258/0956462961917906. Int J STD AIDS. 1996. PMID: 8876353 Review.
Cited by
-
HIV Infection and AIDS in Sub-Saharan Africa: Current Status, Challenges and Opportunities.Open AIDS J. 2016 Apr 8;10:34-48. doi: 10.2174/1874613601610010034. eCollection 2016. Open AIDS J. 2016. PMID: 27347270 Free PMC article.
-
Relationships between changes in HIV risk perception and condom use in East Zimbabwe 2003-2013: population-based longitudinal analyses.BMC Public Health. 2020 May 24;20(1):756. doi: 10.1186/s12889-020-08815-1. BMC Public Health. 2020. PMID: 32448365 Free PMC article.
-
Partner age differences and associated sexual risk behaviours among adolescent girls and young women in a cash transfer programme for schooling in Malawi.BMC Public Health. 2018 Mar 27;18(1):403. doi: 10.1186/s12889-018-5327-7. BMC Public Health. 2018. PMID: 29587710 Free PMC article. Clinical Trial.
-
Documenting and explaining the HIV decline in east Zimbabwe: the Manicaland General Population Cohort.BMJ Open. 2017 Oct 6;7(10):e015898. doi: 10.1136/bmjopen-2017-015898. BMJ Open. 2017. PMID: 28988165 Free PMC article.
-
Potential Impact of Sexual Transmission on Ebola Virus Epidemiology: Sierra Leone as a Case Study.PLoS Negl Trop Dis. 2016 May 2;10(5):e0004676. doi: 10.1371/journal.pntd.0004676. eCollection 2016 May. PLoS Negl Trop Dis. 2016. PMID: 27135922 Free PMC article.
References
-
- Schmid GP, Buvé A, Mugyenyi P, Garnett GP, Hayes RJ, et al. (2004) Transmission of HIV-1 infection in sub-Saharan Africa and effect of elimination of unsafe injections. The Lancet 363: 482–488. - PubMed
-
- UNAIDS (2004) Report on the global AIDS epidemic.
-
- Low-Beer D, Sarkar S (2010) Catalyzing HIV prevention in Asia: from individual to population level impact. AIDS 24: S12–S19. - PubMed
Publication types
MeSH terms
Grants and funding
LinkOut - more resources
Full Text Sources
Other Literature Sources
Miscellaneous
