. 2014 Feb 18;9(2):e88217.
doi: 10.1371/journal.pone.0088217. eCollection 2014.

pY RNA1-s2: a highly retina-enriched small RNA that selectively binds to Matrin 3 (Matr3)

Affiliations

pY RNA1-s2: a highly retina-enriched small RNA that selectively binds to Matrin 3 (Matr3)

Fumiyoshi Yamazaki et al. PLoS One. .

Abstract

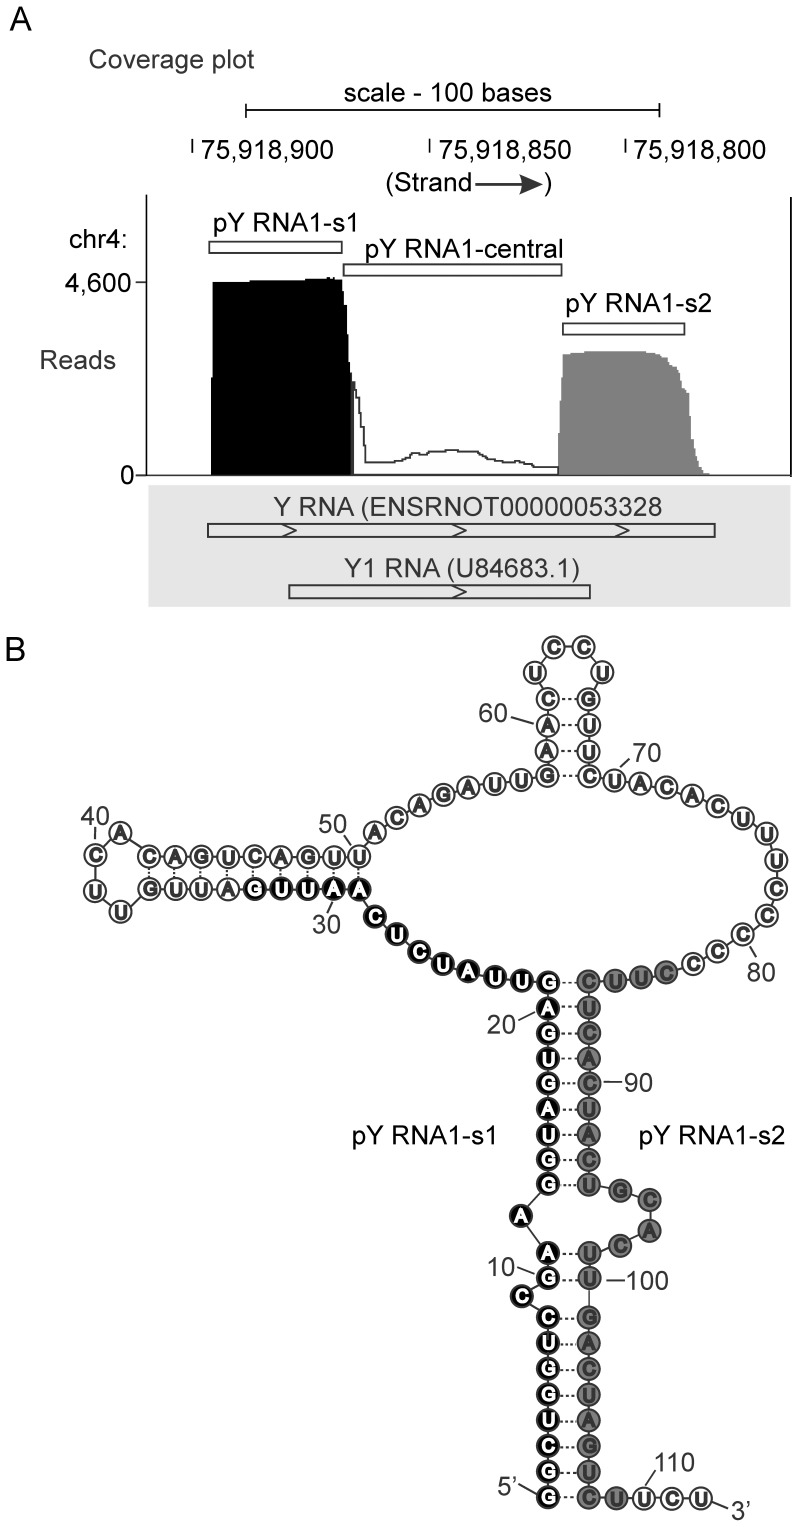
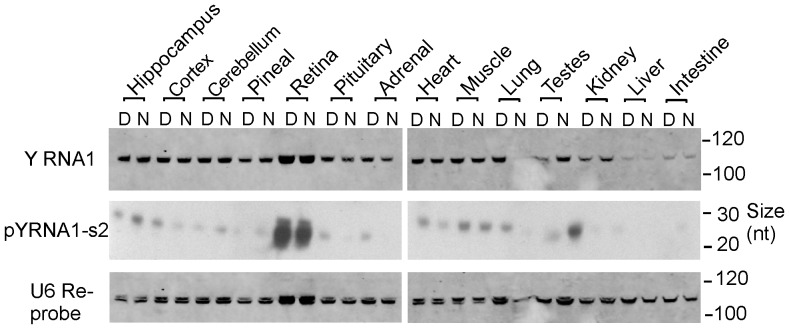
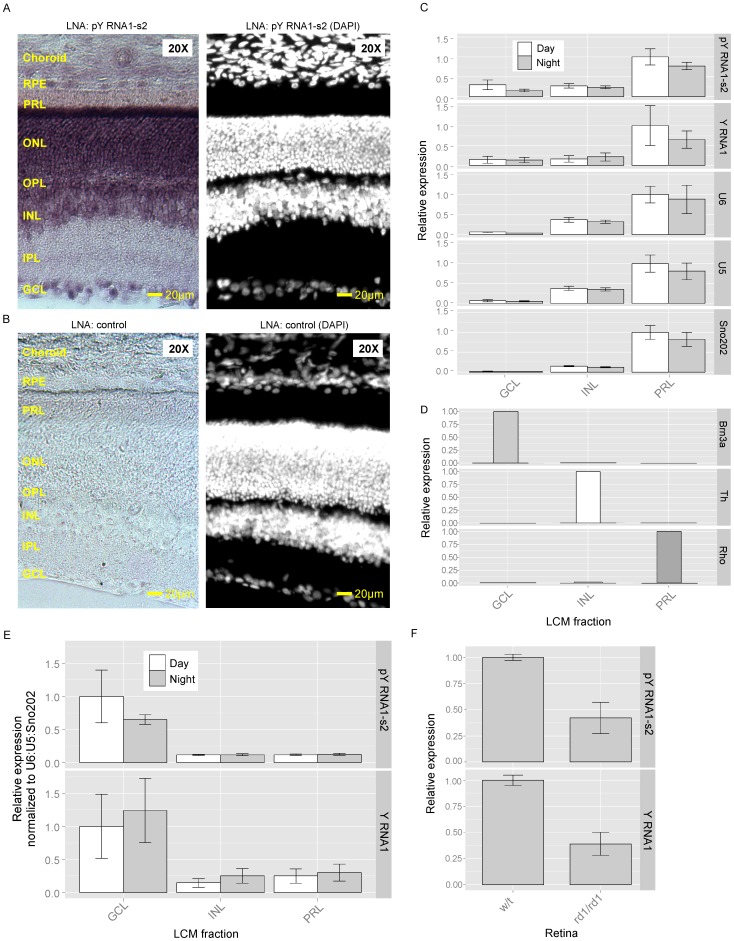
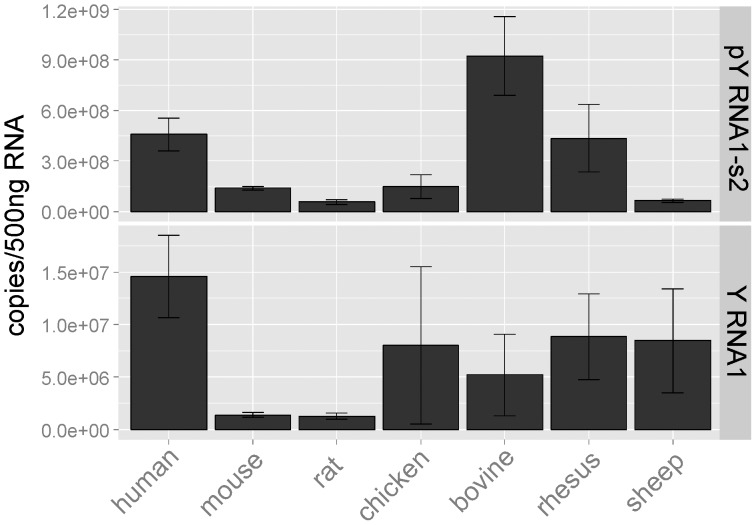
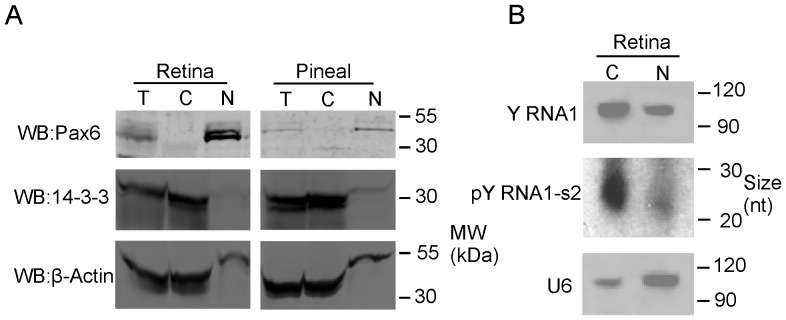
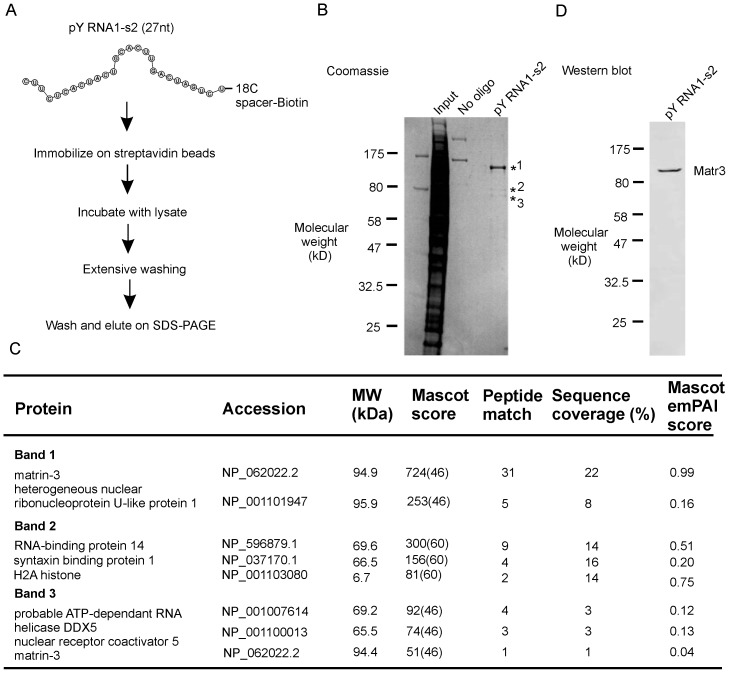
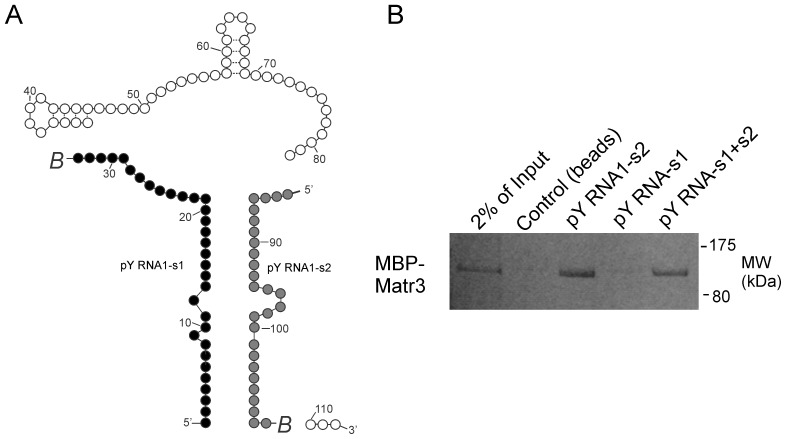
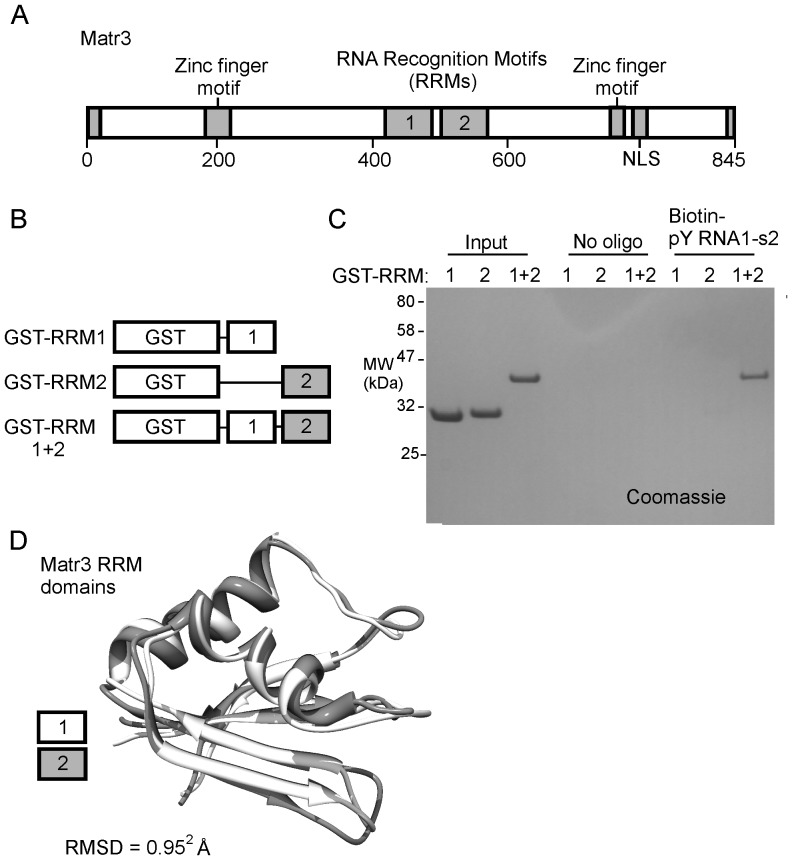
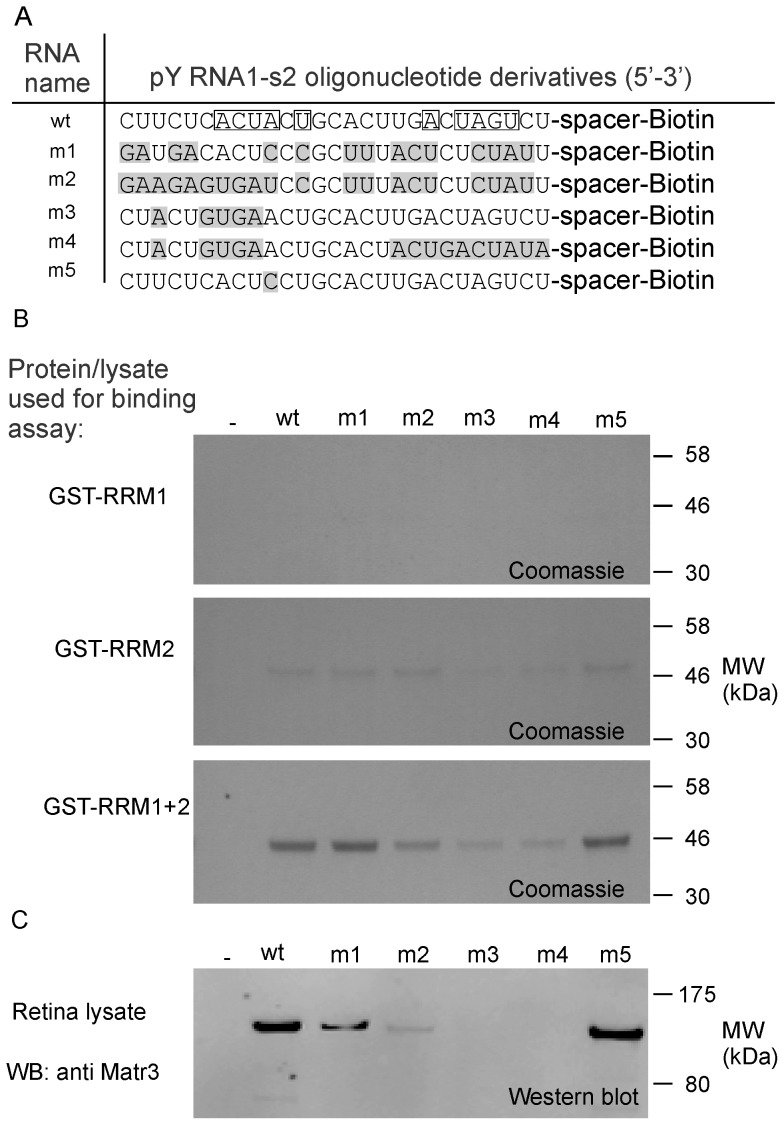
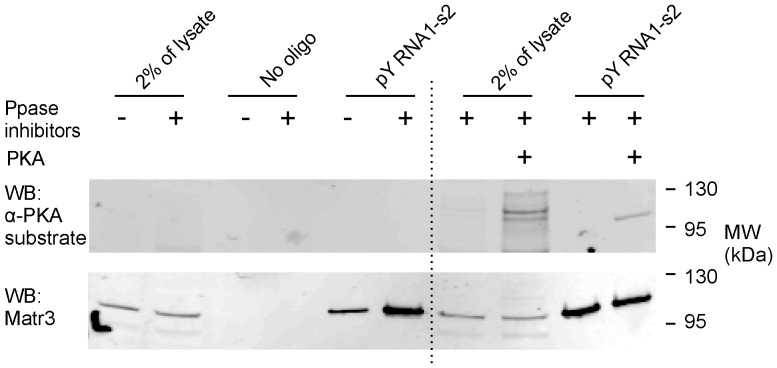
The purpose of this study was to expand our knowledge of small RNAs, which are known to function within protein complexes to modulate the transcriptional output of the cell. Here we describe two previously unrecognized, small RNAs, termed pY RNA1-s1 and pY RNA1-s2 (processed Y RNA1-stem -1 and -2), thereby expanding the list of known small RNAs. pY RNA1-s1 and pY RNA1-s2 were discovered by RNA sequencing and found to be 20-fold more abundant in the retina than in 14 other rat tissues. Retinal expression of pY RNAs is highly conserved, including expression in the human retina, and occurs in all retinal cell layers. Mass spectrometric analysis of pY RNA1-S2 binding proteins in retina indicates that pY RNA1-s2 selectively binds the nuclear matrix protein Matrin 3 (Matr3) and to a lesser degree to hnrpul1 (heterogeneous nuclear ribonucleoprotein U-like protein). In contrast, pY RNA1-s1 does not bind these proteins. Accordingly, the molecular mechanism of action of pY RNA1-s2 is likely be through an action involving Matr3; this 95 kDa protein has two RNA recognition motifs (RRMs) and is implicated in transcription and RNA-editing. The high affinity binding of pY RNA1-s2 to Matr3 is strongly dependent on the sequence of the RNA and both RRMs of Matr3. Related studies also indicate that elements outside of the RRM region contribute to binding specificity and that phosphorylation enhances pY RNA-s2/Matr3 binding. These observations are of significance because they reveal that a previously unrecognized small RNA, pY RNA1-s2, binds selectively to Matr3. Hypothetically, pY RNA1-S2 might act to modulate cellular function through this molecular mechanism. The retinal enrichment of pY RNA1-s2 provides reason to suspect that the pY RNA1-s2/Matr3 interaction could play a role in vision.


Conflict of interest statement

Competing Interests: The authors have declared that no competing interests exist.

Figures

Figure 1
Figure 1. Massively parallel sequencing of small RNAs purified from the rodent pineal gland .
A. Coverage plot indicating the number of reads aligned to the rat genome (build rn4) using the Novoalign alignment tool and visualized using the UCSC genome browser . The aligner was used with ‘miRNA mode’ switched on and multiple good–quality alignments (of each read) were reported, full details in “Materials and Methods”. Reads that align to the small cytoplasmic Y RNA1 and are distributed into two distinct populations, indicated by black (5′ stem region; pY RNA1-s1) and grey (3′ stem region; pY RNA1-s2) shading. Approximately 4,600 reads map to Y RNA-s1 and ∼3,000 to pY RNA1-s2. The transcripts indicated in the grey box are the Ensembl prediction for Y RNA1 and the incomplete Genbank entry for Y RNA1 in rat (U84683.1). Approximately 20 bases are missing from the 5′ and 3′ end GenBank entry U84683.1, as indicated by the histogram above. B. Secondary structure of the Y RNA gene adapted from , modified to reflect the locations of pY RNA1-S1 and pY RNA1-s2: the location of processed small RNAs is indicated with black and grey circles (pY RNA1-s1 and pY RNA1-s2, respectively) that correspond to the coverage plot in A.
Figure 2
Figure 2. Tissue specific expression of pY RNA1-s2.
Northern blotting of RNA extracted from the indicated tissue obtained during the Day (ZT 7) and Night (ZT 19). Tissues from three rats were pooled and RNA was extracted as described in “Materials and Methods”. Equal amounts (1 µg) of total RNA were separated on 15% TBE-Urea polyacrylamide gels, transferred and chemically cross-linked to the membrane, followed by probing with an LNA™-probe, designed against pY RNA1-s2. For further details see “Materials and Methods”. The upper panel; full-length Y RNA; middle panel, pY RNA1-s2; lower panel, U6 as loading control. This analysis was repeated two more times with similar results.
Figure 3
Figure 3. A. pY RNA1-s2/Y RNA1 is enriched in the ganglion cell layer (GCL) and photoreceptive layers (PRL) of retina.
An antisense dioxygenin-labelled Locked Nucleic Acid (LNA):DNA probe was used to identify the location of Y RNA1 and pY RNA1-s2 in the retina of rat; full details are given in “Materials and Methods”. Intense staining is evident in the GCL and PRL, in particular the region corresponding to rods & cones. Other layers indicated are: IPL, inner plexiform layer; INL, inner nuclear layer; OPL, outer plexiform layer; ONL, outer nuclear layer; Rods & Cones; RPE, Retinal Pigmented Epithelium. Similar results were obtained with tissue from two other individuals. B. DAPI staining of retina cross section. The retinal section was DAPI stained to aid identification of cell morphology. C. Quantitative real-time PCR of small RNA species in regions of a mouse retina separated by laser capture micro-dissection (LCM). RNA was extracted from the indicated sections representing the GCL, INL and PRL and analyzed for the presence of pY RNA1-s2, Y RNA (full length Y RNA) and three control RNAs: U6, U5 and sno202. Retina were collected and dissected from animals housed in a 12∶12 L∶D6 lighting (day, white bars; and grey, night bars). Expression is reported as relative to the maximum signal for each small RNA. cDNA libraries were prepared using the QuanitMiR system and the same cDNA library was used for each qRT-PCR analysis. Samples of RNA from each of four pools of tissue from three animals were analyzed; error bars represent SEM. D. Validation of laser capture microdissection (LCM). The results of LCM are validated by determining the abundance of three retinal layer-specific markers in the microdissected samples. The markers used are Brn3a (GCL), mGluR6 (rod and ON-type cone bipolar cells in INL), and Rho (rods in the PRL). Brn3a was only detected in the GCL sample and mGluR6 only in the INL sample; Rho was 500-fold more abundant in the PR sample as compared to the INL sample and was not detected in the GCL sample. E. Values of Y RNA1 and pY RNA1-s2 are reported relative to the maximum signal and normalized using the geometric mean of U6, U5 and Sno202. F. Relative quantitation of pY RNA1-s2 and Y RNA1 in a mouse model of retinal degeneration. Wild type retina: w/t, degenerated retina: rd1/rd1. Error bars are SEM, n = 3.
Figure 4
Figure 4. Presence of pY RNA1-s2 in mammalian and bird retinas.
RNA was extracted from three retinas obtained from each of the indicated species; all samples were obtained during the day. Equal amounts of tissue were extracted using miRVana columns; cDNA libraries were created using the QuanitMiR system. The values are reported as copies of pY RNA1-s2/500 ng total RNA. It is apparent that the abundances of pY RNA1-s2 and of YRNA1 vary from species to species and that pY RNA1-s2 appears to be 50 to 100 times more abundant that Y RNA1, in all cases except the ovine retina. The Y RNA1 versus pY RNA1-s2 differences may reflect secondary structure differences which influence the efficiency of the RT reaction, resulting in greater amplification of pY RNA1-s2 over Y RNA1. Error bars are SEM.
Figure 5
Figure 5. Cellular distribution of Y RNA1 and pY RNA1-s2.
A. Retinal tissue was obtained from three animals, pooled and dissociated in lysis buffer with the addition of RNAse inhibitors, as described in “Materials and Methods”. These preparations were pooled and partitioned into nuclear and cytoplasmic fractions. Equal proportions of each fraction were subjected to SDS-PAGE and western blotted for Pax 6 (nuclear fraction control), 14-3-3 (cytoplasmic control) and β-Actin (cytoplasmic control). B. Northern blot of total RNA extracted from cytoplasmic and nuclear fractions as described above, separated on a denaturing 15% TBE-Urea PAGE gel, using a probe directed toward pY RNA1-s2, indicating the predominance of pY RNA1-s2 in the cytoplasm, but also detectable in the nuclear fraction. The panel indicated by “Y RNA1” shows the un-processed Y RNA and the panel labeled “pY RNA1-s2” shows the processed Y RNA1 that migrates at ∼27 nt. The blot was re-probed with a probe directed to U6 (as a control) indicating the majority is present in the nucleus.
Figure 6
Figure 6. Identification of pY RNA1-s2 interacting proteins by affinity chromatography and mass spectroscopy.
A. Scheme of the RNA:protein complex isolation procedure used in this investigation: a biotinylated RNA oligonucleotide corresponding to pY RNA1-s2 was synthesized with an 18C spacer, followed by a Biotin moiety at the 3′ terminus. The pY RNA1-s2 probe was coupled to streptavidin beads and incubated with lysate prepared from a pool of six rat retinas, followed by extensive washing and elution by SDS-PAGE. B. Coomassie blue staining shows pY RNA1-s2 predominantly associates with a protein migrating at ∼120 kDa, indicated with *1. Two minor bands are also present - indicated with *2 and *3; details in the table below. C. Table summarizing LC-MS/MS analysis of pY RNA1-s2-bound proteins. Mascot results were filtered for significance with p<0.05 and an identity score cut-off value set to report only ion scores with extensive homology. Results are sorted by best Mascot score. Key: Protein – Name of the protein in indicated band, Accession – the RefSeq protein Accession number, MW – Molecular weight in kDa, Mascot score – Probability score calculated by the Mascot search algorithm – parenthesis indicates the value at which the mascot score reaches identity, Peptide match - number of significant peptides recorded for each protein, Sequence coverage (%): sum of amino acids in matching peptides divided by the total number of amino acids in the protein, Mascot emPAI score: provides a measure of protein abundance. See “Materials and Methods” for a full explanation of how the parameters are calculated. D. Confirmation of Matrin3 association with pY RNA1-s2 by western blot, revealed by repeating the experiment performed in A, and using Matr3 antiserum (described in “Materials and Methods”).
Figure 7
Figure 7. pY RNA1-s2 selectively binds to Matr3.
A. Schematic depicting the two regions of Y RNA used in a binding assay with a Maltose Binding Protein fusion with Matr3 (MBP-Matr3). Biotin groups, indicated with italic B, were chemically attached to the 3′ end of each oligo. pY RNA1-s1 is indicated with black circles and pY RNA1-s2 with grey circles. B. the RNA oligonucleotides pY RNA1-s1, pY RNA1-s2 or an equimolar mix of both oligos (pY RNA1-s1+s2) were coupled to streptavidin beads, incubated with MBP-Matr3 and then washed extensively. A lysate prepared from six rat retinas was subsequently incubated with the beads, which were then washed; the proteins associated with the beads were recovered into sample buffer, resolved by SDS-PAGE and detected by Coomassie staining (details are available in the “Materials and Methods”).
Figure 8
Figure 8. Both RRM domains of Matr3 are required for the interaction with pY RNA1-s2.
A. Schematic of Matr3 indicating the Zinc finger binding domains and the RNA Recognition Motifs (RRMs) from within Matr3. B. Schematic of constructs created as N-terminal Glutathione S-transferase (GST) fusion proteins with the RRM from Matr3, used in this binding study. C. Immobilized pY RNA1-s2 was incubated with the indicated GST-RRM proteins and SDS-PAGE followed by Coomassie blue staining; this demonstrates that RRM1+2, but not RRM1 or RRM2 alone bind to pY RNA1-s2. “Input” lanes represent the total amount of each protein (2 µg) that was incubated with either beads alone (no oligo lanes) or with 100 pmols of pY RNA1-s2-biotin pre-coupled to streptavidin M280 beads (Biotin-pY RNA1-s2 lanes). D. Alignment of crystal structures of the Matr3 RRM domains (PDB ID: 1WEX and 1X4F) obtained from the RCSB database reveal an RMSD of 1.03 Å.
Figure 9
Figure 9. Isolated RNA recognition domains and endogenous Matr3 bind to pY RNA1-s2 in a sequence specific manner.
A. Details of RNA oligonucleotides used to examine the interaction with Matr3. Mutated bases with respect to wild type (wt) are indicated with grey shading (m1, m2, m3, m4 and m5). “Spacer” indicates an 18C spacer moiety attached to the 3′ end of the RNA, terminated with Biotin. Boxed residues indicate a pseudo-palindrome sequence. B. Derivatives of Matr3 conjugated with GST were incubated with the indicated RNA oligonucleotide. The constructs are detailed in Figure 8B and comprise: GST-RRM1, GST-RRM-2 and GST-RRM1+2 respectively. The interaction was examined by Streptavidin conjugated magnetic bead pull-down experiments: the bound protein is revealed by SDS-PAGE analysis followed by Coomassie blue staining. C. Matr3 is identified by western blot, revealing the interaction of pY RNA1-s2 and mutants with native Matr3. Lysate prepared from rat retina was incubated with the same pY RNA1-s2 mutants as used in B.
Figure 10
Figure 10. Phosphorylation enhances the interaction between Matr3 and pY RNA1-s2.
Pre-conjugated biotinylated pY RNA1-s2: streptavidin beads (indicated with “pY RNA1-s2”) were incubated with retina lysates prepared from six animals, as described in “Materials and Methods”. Negative control binding assays are labeled “control”. Load controls are indicated with “2% of lysate”. The recovered proteins were subjected to SDS-PAGE and western blotting using an antibody raised against a generic phosphorylated substrate (α-PKA substrate) followed by re-probing against Matr3. Prior to the binding assay, retina lysates were prepared in the absence (−) or presence (+) of phosphatase inhibitors (Ppase inhibitors) or recombinant protein kinase A (PKA), to enhance phosphorylation of endogenous Matr3. See “Materials and Methods” for details of inhibitors and PKA used. The lower panel shows a re-probe using an anti-Matr3 antibody of the upper blot.

Similar articles

Cited by

References

    1. Guo H, Ingolia NT, Weissman JS, Bartel DP (2010) Mammalian microRNAs predominantly act to decrease target mRNA levels. Nature 466: 835–840. - PMC - PubMed
    1. Meister G, Landthaler M, Peters L, Chen PY, Urlaub H, et al. (2005) Identification of novel argonaute-associated proteins. Curr Biol 15: 2149–2155. - PubMed
    1. Livak KJ (1990) Detailed structure of the Drosophila melanogaster stellate genes and their transcripts. Genetics 124: 303–316. - PMC - PubMed
    1. Czech B, Hannon GJ (2011) Small RNA sorting: matchmaking for Argonautes. Nat Rev Genet 12: 19–31. - PMC - PubMed
    1. Khurana JS, Theurkauf W (2010) piRNAs, transposon silencing, and Drosophila germline development. J Cell Biol 191: 905–913. - PMC - PubMed

Publication types

MeSH terms

LinkOut - more resources