. 2014 Feb 21;343(6173):857-63.
doi: 10.1126/science.1247485.

Dendritic inhibition in the hippocampus supports fear learning

Affiliations

Dendritic inhibition in the hippocampus supports fear learning

Matthew Lovett-Barron et al. Science. .

Abstract

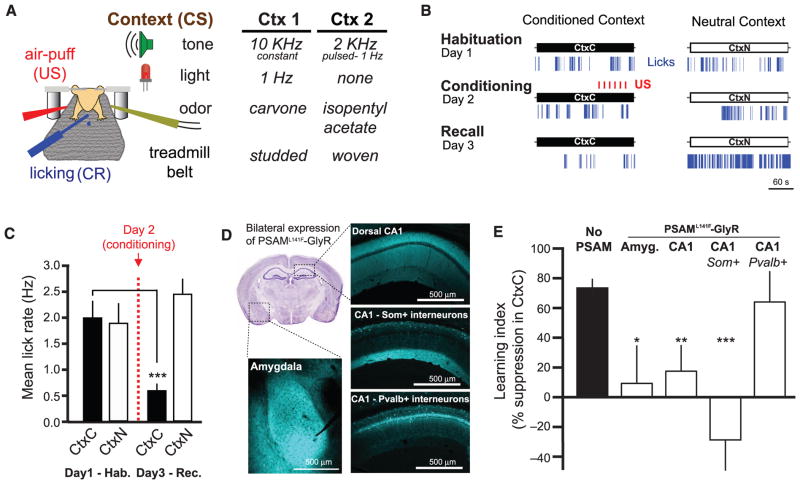
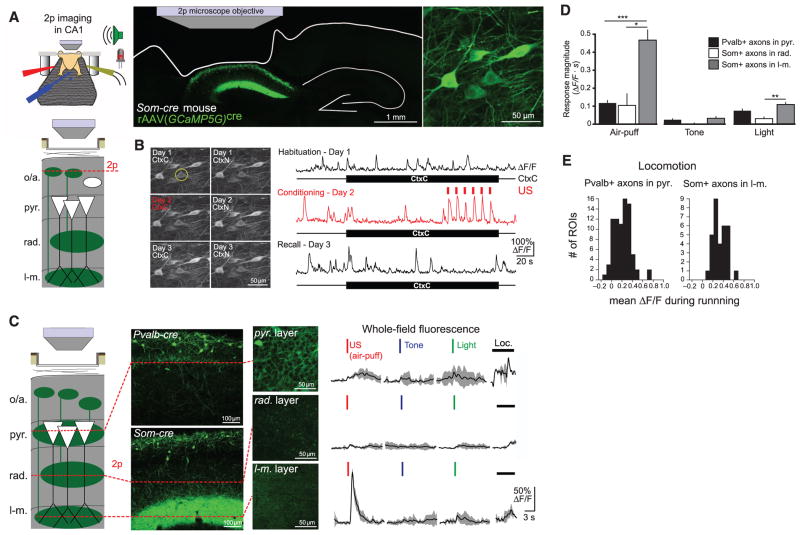
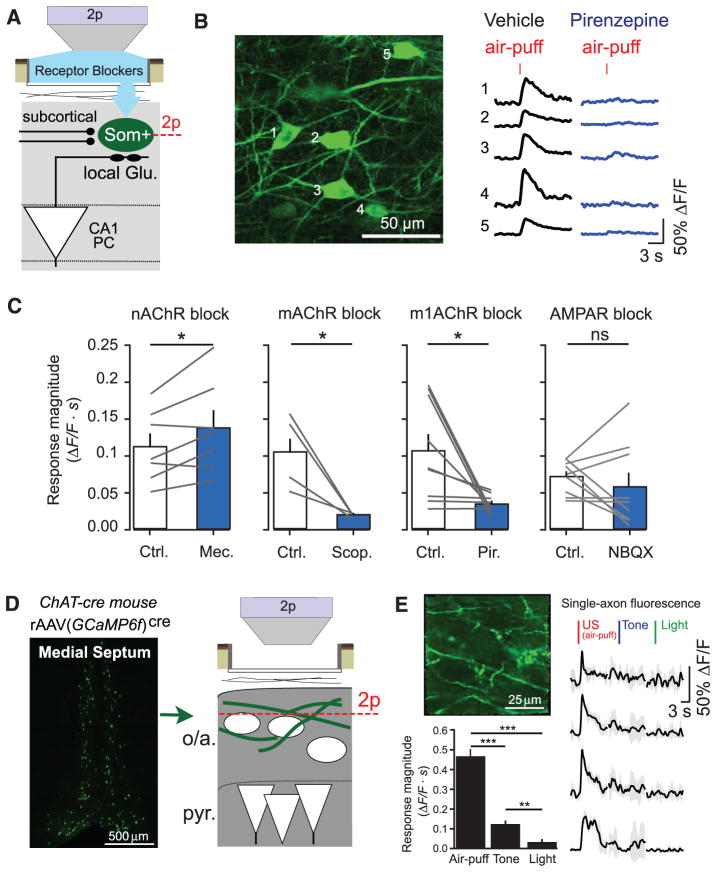
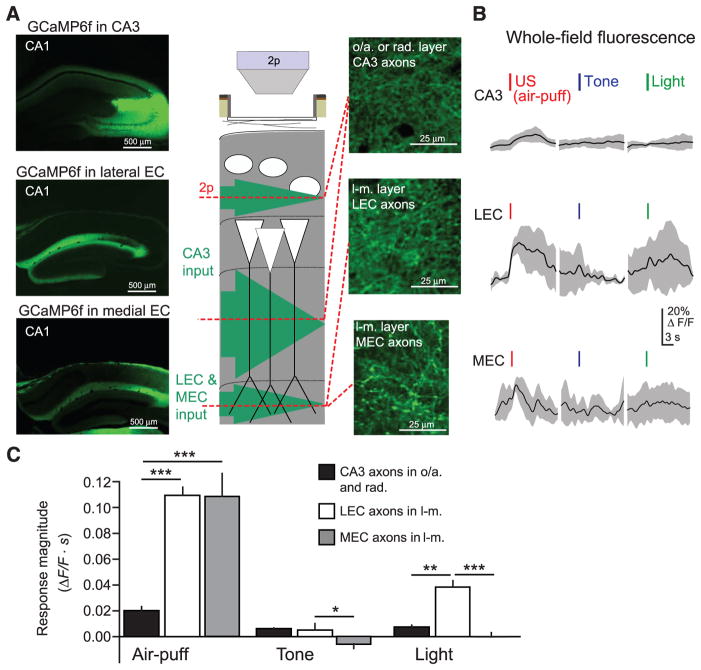
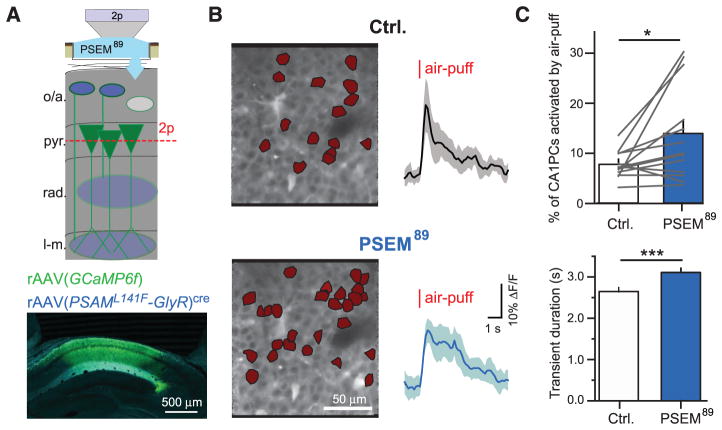
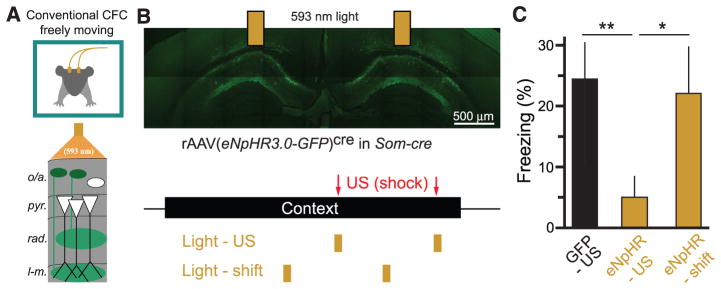
Fear memories guide adaptive behavior in contexts associated with aversive events. The hippocampus forms a neural representation of the context that predicts aversive events. Representations of context incorporate multisensory features of the environment, but must somehow exclude sensory features of the aversive event itself. We investigated this selectivity using cell type-specific imaging and inactivation in hippocampal area CA1 of behaving mice. Aversive stimuli activated CA1 dendrite-targeting interneurons via cholinergic input, leading to inhibition of pyramidal cell distal dendrites receiving aversive sensory excitation from the entorhinal cortex. Inactivating dendrite-targeting interneurons during aversive stimuli increased CA1 pyramidal cell population responses and prevented fear learning. We propose subcortical activation of dendritic inhibition as a mechanism for exclusion of aversive stimuli from hippocampal contextual representations during fear learning.


Figures

Fig. 1
Fig. 1. Som+ interneurons in CA1 are required for learning hf-CFC
(A) Schematic of hf-CFC task. A head-fixed mouse on a treadmill is exposed to contexts (CS) defined by distinct sets of multisensory stimuli. We used air puffs as the US and suppression of water-licking as a measure of learned fear (CR). The two distinct contexts used in this study are described at right. (B) Behavioral data from an example mouse over the hf-CFC paradigm. Conditioned (CtxC) and neutral (CtxN) contexts are each presented once a day, and lick rate is assessed during the 3-min context. (C) Summary data for 19 mice [two-way analysis of variance (ANOVA), context x session, F(1,19) = 9.34, P < 0.01]. Mice showed a selective decrease in mean lick rate between habituation and recall in CtxC but not CtxN (paired sign tests). (D) Viral expression of PSAML141F-GlyR in the amygdala or dorsal CA1, revealed by α-bungarotoxin-Alexa647 immunostaining. All injections were bilateral; for simplicity, only one hemisphere is shown. Image at top left is from the Allen Brain Atlas. (E) Summary data for mice injected with PSEM89 systemically 15 min before the conditioning session in CtxC (day 2 of hf-CFC paradigm). Learning is assessed by the percentage of lick-rate decrease in the CtxC recall session (day 3) relative to the mean lick rate in all sessions. Mice expressing PSAML141F-GlyR in amygdala cells (Amyg., n = 6 mice), dorsal CA1 cells (CA1, n = 5 mice), or CA1 Som+ interneurons (CA1-Som+, n = 8 mice) showed impaired learning compared with mice not expressing PSAML141F-GlyR (No PSAM, n = 11 mice), whereas mice expressing PSAML141F-GlyR in CA1 Pvalb+ interneurons (CA1-Pvalb+, n = 4 mice) did not. Comparisons are Mann-Whitney U tests. Error bars, mean ± SEM. *P < 0.05; **P < 0.01; ***P < 0.001.
Fig. 2
Fig. 2. Som+ interneurons targeting stratum lacunosum-moleculare are activated by the US
(A) (Top left) Schematic of hf-CFC during two-photon (2p) imaging from hippocampal neurons. (Bottom left) Schematic of recording configuration, with 2p imaging from Som+ interneurons in the oriens/alveus layers of CA1 in vivo (o/a, strata oriens/alveus; pyr., stratum pyramidale; rad., stratum radiatum; l-m., stratum lacunosum-moleculare). (Right) Confocal image of coronal section from mouse expressing GCaMP5G in Som+ interneurons in dorsal CA1. The 2p microscope objective and landmarks showing the outline of the brain, including the removed cortex and the contralateral hippocampus, are illustrated. An in vivo 2p image of GCaMP-expressing Som interneurons is shown at far right. (B) (Left) 2p images of the same field of view from (A) for the six hf-CFC sessions over the course of 3 days. Images are time averages of 2000 motion-corrected imaging frames collected for each imaging session. (Right) ΔF/F traces from an example Som+ CA1 interneuron (circled at left) over the three daily exposures to CtxC. (C) (Left) Schematic of recording configuration, with in vivo 2p imaging from Som+ axons in radiatum or lacunosum-moleculare layers of CA1, Pvalb+ axons in the pyramidale layer. (Middle) Expression of GCaMP5G in layer-specific axonal projections, revealed by confocal images of coronal sections and in vivo 2p images of each layer. (Right) Example trial-averaged responses (five trials each presented in pseudorandom order) of layer-specific whole-field fluorescence responses to discrete 200-ms sensory stimuli and locomotion (mean with shaded SD). (D) Summary data for sensory stimulation experiments shown in (C). Responses are quantified as the mean integral of whole-field ΔF/F over the 3 s after the stimulus. [two-way ANOVA, axon-type x stimulus type, F(4,84) = 16.9, P < 0.001; post hoc Mann-Whitney U tests]. Error bars, mean ± SEM. *P < 0.05; **P < 0.01; ***P < 0.001. (E) Summary data for whole-field ΔF/F responses to treadmill-running. Pvalb+ axons in pyramidale exhibit locomotion responses similar to Som+ axons in lacunosum-moleculare (Mann-Whitney U test, P = 0.101).
Fig. 3
Fig. 3. Cholinergic inputs from the medial septum drive CA1 Som+ interneurons during the US
(A) Schematic of recording configuration, with 2p imaging from Som+ interneurons in the oriens and alveus layers of CA1, and local pharmacological manipulations through an aperture in the imaging window. (B) Example in vivo 2p image of GCaMP-expressing Som+ interneurons and their fluorescence responses to air puffs in vehicle (cortex buffer) and in the presence of 1 mM pirenzepine. (C) Summary data for local pharmacological manipulations. Each point is the mean response of all Som+ interneurons within a field of view (FOV) to air puffs (5 trials each) in vehicle (Ctrl.) and upon drug application (nAChR block, 7 FOVs in 5 mice; mAChR block, 4 FOVs in 3 mice; m1AChR block, 9 FOVs in 5 mice; AMPAR block, 9 FOVs in 4 mice). Comparisons are paired t tests between drug conditions. (D) (Left) Coronal confocal image of GCaMP6f+/ChAT+ neurons in the medial septum of a ChAT-cre mouse. (Right) Schematic of recording configuration, with 2p imaging from ChAT+ axons in the oriens and alveus layers of CA1. (E) (Top left) Example in vivo 2p image of GCaMP6f-expressing ChAT+ axons in CA1. (Right) Mean responses of individual axons to sensory stimuli. (Bottom left) Summary data from ChAT+ axons averaged within each FOV (sign tests; n = 20 FOVs in 2 mice). Error bars, mean ± SEM. *P < 0.05; **P < 0.01; ***P < 0.001; ns, nonsignificant.
Fig. 4
Fig. 4. US-evoked excitatory input to CA1 PC distal dendrites
(A) (Left) Confocal images of coronal sections from dorsal hippocampus, showing expression of GCaMP6f in CA1-innervating axons from CA3 (top), LEC (middle), or MEC (bottom). (Middle) Schematic of recording configuration, with 2p imaging from excitatory axons in the oriens/radiatum layers (CA3 projections) or lacunosum-moleculare layer (LEC or MEC projections) of CA1. (Right) Example in vivo 2p images of GCaMP6f-expressing axons in CA1 (CA3, top; LEC, middle; MEC, bottom). (B) Example mean whole-field fluorescence traces from CA3, LEC, and MEC axons [examples in (A)], in response to discrete sensory stimuli (mean with shaded SD). (C) Summary data for sensory stimulation experiments. Responses are quantified as the mean integral of ΔF/F over the 3 s after the stimulus (two-way ANOVA, axon type x stimulus type, F(4,84) = 10.7, P < 0.001; post hoc Mann-Whitney U tests). Error bars, mean ± SEM. *P < 0.05; **P < 0.01; ***P < 0.001.
Fig. 5
Fig. 5. Effects of inactivating CA1 Som+ interneurons on US-evoked PC population activity
(A) (Top) Schematic of recording configuration, with 2p imaging from CA1 PC populations in the pyramidale layer of CA1 and local pharmacologenetic manipulation of PSAML141F-GlyR–expressing Som+ interneurons through an aperture in the imaging window. (Bottom) Confocal image of coronal CA1 sections, with GCaMP6f expression in all neurons (green) and PSAML141F-GlyR expression in Som+ interneurons, revealed by α-BTX immunostaining (blue). (B) (Left) Corrected time-average images of example recordings in pyr. of a mouse expressing PSAML141F-GlyR in Som+ interneurons. PCs with significant US responses are marked in red. (Right) Mean ΔF/F responses of cells active in both control and PSEM89 conditions from left (shading is SD). (C) Summary data for multiple FOVs between drug conditions. (Top) Mean percentage of significantly active CA1 PCs (ctrl, 7.6 ± 0.7%; PSEM89, 13.7 ± 2.5%; n = 13 FOVs; paired t test). (Bottom) Mean duration of significant transients in cells active in both drug conditions (ctrl, 2.64 ± 0.09 s; PSEM89, 3.09 ± 0.09 s; n = 96 cells; paired t test). Error bars, mean ± SEM. *P < 0.05; ***P < 0.001.
Fig. 6
Fig. 6. Inactivating CA1 Som+ interneurons during the US alone is sufficient to prevent CFC
(A) Schematic of optogenetic experiments in freely moving mice. Bilateral optic fibers deliver 593-nm light to inhibit eNpHR3.0-eGFP–expressing Som+ interneurons in CA1 during CFC in freely moving mice. (B) (Top) Confocal image of eNpHR3.0-eGFP–expressing Som+ interneurons in dorsal CA1 and indication of optic fiber positions. (Bottom) Experimental protocol. Mice are exposed to a context for 3 min, with two footshocks (2 s, 1 mA) 118 s and 178 s into the context. Two pulses of 593-nm light (6 s) were delivered through bilateral optical fibers starting at 116 s and 176 s (Light-US group) or 86 s and 146 s (Light-shift group). (C) Summary data for optogenetic stimulation experiments. GFP-US, n = 6 mice; eNpHR-US, n = 8 mice; eNpHR-shift, n = 6 mice; one-way ANOVA, F(2,19) = 3.87, P < 0.05; comparisons are unpaired t tests. Error bars, mean ± SEM. *P < 0.05; **P < 0.01.

Similar articles

Cited by

References

    1. Fanselow MS. Learn Motiv. 1986;17:16–39.
    1. Fanselow MS. Anim Learn Behav. 1990;18:264–270.
    1. Maren S. Annu Rev Neurosci. 2001;24:897–931. - PubMed
    1. Rudy JW, Huff NC, Matus-Amat P. Neurosci Biobehav Rev. 2004;28:675–685. - PubMed
    1. Fanselow MS, Poulos AM. Annu Rev Psychol. 2005;56:207–234. - PubMed

Publication types