. 2014 Apr 11;289(15):10702-10714.
doi: 10.1074/jbc.M113.526921. Epub 2014 Feb 18.

A charge-inverting mutation in the "linker" region of α-amino-3-hydroxy-5-methyl-4-isoxazolepropionic acid (AMPA) receptors alters agonist binding and gating kinetics independently of allosteric modulators

Affiliations

A charge-inverting mutation in the "linker" region of α-amino-3-hydroxy-5-methyl-4-isoxazolepropionic acid (AMPA) receptors alters agonist binding and gating kinetics independently of allosteric modulators

Jonathan E Harms et al. J Biol Chem. .

Abstract

AMPA receptors are gated through binding of glutamate to a solvent-accessible ligand-binding domain. Upon glutamate binding, these receptors undergo a series of conformational rearrangements regulating channel function. Allosteric modulators can bind within a pocket adjacent to the ligand-binding domain to stabilize specific conformations and prevent desensitization. Yelshansky et al. (Yelshansky, M. V., Sobolevsky, A. I., Jatzke, C., and Wollmuth, L. P. (2004) J. Neurosci. 24, 4728-4736) described a model of an electrostatic interaction between the ligand-binding domain and linker region to the pore that regulated channel desensitization. To test this hypothesis, we have conducted a series of experiments focusing on the R628E mutation. Using ultrafast perfusion with voltage clamp, we applied glutamate to outside-out patches pulled from transiently transfected HEK 293 cells expressing wild type or R628E mutant GluA2. In response to a brief pulse of glutamate (1 ms), mutant receptors deactivated with significantly slower kinetics than wild type receptors. In addition, R628E receptors showed significantly more steady-state current in response to a prolonged (500-ms) glutamate application. These changes in receptor kinetics occur through a pathway that is independent of that of allosteric modulators, which show an additive effect on R628E receptors. In addition, ligand binding assays revealed the R628E mutation to have increased affinity for agonist. Finally, we reconciled experimental data with computer simulations that explicitly model mutant and modulator interactions. Our data suggest that R628E stabilizes the receptor closed cleft conformation by reducing agonist dissociation and the transition to the desensitized state. These results suggest that the AMPA receptor external vestibule is a viable target for new positive allosteric modulators.

Keywords: Computer Modeling; Electrophysiology; Gating; Glutamate Receptors, Ionotropic (AMPA, NMDA); Glutamate Receptors, Metabotropic; Structural Biology.


Figures
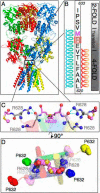
FIGURE 1.
FIGURE 1.
Arg-628 lies at a transition in receptor symmetry and forms the latch in the closed pore receptor state. A, GluA2 crystal structure (15) showing receptor subunits by color (A, green; B, yellow; C, blue; D, red). B, GluA2 amino acid sequence from Leu-620 in M3 (bottom) to Ile-633 in the linker region (top). Subunits A and C feature an extended M3 helix, creating a 4- to 2-fold symmetry transition over a region inclusive of Arg-628 (highlighted in red) and Met-629 (magenta text). C, the symmetry transition orients the Arg-628 side chain guanidino groups of subunits B and D within hydrogen bonding distance to the backbone oxygens of subunits C and A, respectively. D, the Arg-628 residues of subunits B and D (translucent) form a latch with Arg-628 residues of subunits A and C (opaque). This latch is adjacent to the pore-constricting Met-629 residues of subunits A and C (opaque pink spheres; Ref. 10).
FIGURE 2.
FIGURE 2.
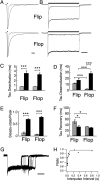
Electrophysiological recordings of R628E currents show altered receptor kinetics compared with wild type GluA2. A and B, representative current traces of outside-out patches pulled from HEK 293 cells expressing homomeric GluA2 flip (upper traces) or GluA2 flop (lower traces). R628E mutant (black) was normalized to wild type (gray) responses to a 10 mm pulse of glutamate (bar above trace) for 1 (A; deactivation) or 500 ms (B; desensitization). Scale bars, 5 ms for deactivation and 100 ms for desensitization. C–F, comparison of mean data between wild type (gray) and R628E (black) shows that the R628E mutant has significantly slower onset of deactivation (C) and increased steady-state current (E) for both flip and flop isoforms of GluA2. Only the flop isoform of R628E showed significantly slower desensitization (D), whereas only the flip isoform had significantly faster recovery (F). R628E deactivation data show the weighted mean of two exponential functions as shown in Table 1. G and H, representative paired pulse recovery sweep for R628E flop (G; scale bar, 100 ms) and the corresponding plot of the second peak to first peak ratio with increasing interpulse intervals (H). *, p < 0.05; ***, p < 0.001 using two-way analysis of variance with Sidak's correction. Error bars represent S.E. A paired pulse sweep entails a desensitizing pulse of glutamate with a second pulse following an incrementally increased recovery duration to measure percent recovery over time.
FIGURE 3.
FIGURE 3.
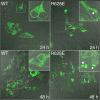
The R628E mutant shows impaired trafficking and formation of aggresomes. Confocal images of HEK 293 cells transiently transfected with YFP-tagged flip wild type (left) or R628E (right) constructs are shown. Top row, images taken 24 h after cell transfection; bottom row, images taken 48 h post-transfection. The inset in upper right corner of each panel shows magnification of the area drawn by the dotted white box. Note the increased presence of aggresomes (white arrows) in HEK 293 cells transfected with the R628E construct indicative of disrupted channel trafficking.
FIGURE 4.
FIGURE 4.
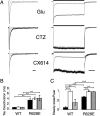
The R628E mutant does not occlude effects of modulator for the flip isoform of GluA2. A, representative current traces of outside-out patches pulled from HEK 293 cells transfected with homomeric GluA2 flip cDNA. R628E mutant (black) was normalized to wild type (gray) responses to a 10 mm pulse of glutamate (bar above trace) for 1 (left; deactivation) or 500 ms (right; desensitization). Currents were recorded with glutamate only (Glu) or in the continuous presence of 100 μm CTZ or 100 μm CX614. Scale bars, 10 ms for deactivation and 100 ms for desensitization. B and C, graphical comparisons of WT and R628E weighted deactivation (B) and ss/peak (C) in the absence of modulator (black) or presence of 100 μm CTZ (white) or 100 μm CX614 (gray). **, p < 0.01; ***, p < 0.001 using two-way analysis of variance with Sidak's correction. Error bars represent S.E.
FIGURE 5.
FIGURE 5.
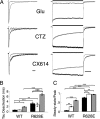
The R628E mutant does not occlude effects of allosteric modulators for the flop isoform of GluA2. A, representative current traces of outside-out patches pulled from HEK 293 cells transfected with homomeric GluA2 flοp cDNA. R628E mutant (black) was normalized to wild type (gray) responses to a 10 mm pulse of glutamate (bar above trace) for 1 (left; deactivation) or 500 ms (right; desensitization). Currents were recorded with glutamate only (Glu) or in the continuous presence of 100 μm CTZ or 100 μm CX614. Scale bars, 10 ms for deactivation and 100 ms for desensitization. B and C, graphical comparisons of WT and R628E weighted deactivation (B) and ss/peak (C) in the absence of modulator (black) or presence of 100 μm CTZ (white) or 100 μm CX614 (gray). *, p < 0.05; **, p < 0.01; ***, p < 0.001 using two-way analysis of variance with Sidak's correction. Error bars represent S.E.
FIGURE 6.
FIGURE 6.
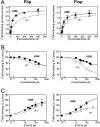
The R628E mutant shows altered agonist affinity with an isoform-specific effect in the presence of allosteric modulators. A, saturation binding curves for [3H]FW binding to wild type (open circles and gray line) and R628E receptors (closed circles and black line). Binding was measured at 1–400 nm radioligand at 0 °C. The data are shown as averages and S.E. of two (flip) or five (flop) experiments in which WT and mutant receptors were tested in tandem (absence of error bars indicates that the error was smaller than the symbol size). Data points were fitted with a logistic equation. KD, Bmax, and nH values are presented in the text. These data show that both flip (left) and flop (right) R628E receptors exhibit a shift toward higher agonist affinity. B and C, the effects of modulators CTZ (B) and CX614 (C) were measured using a fixed 5 nm [3H]FW concentration and varying concentrations of modulator (with maximum concentration limited by drug solubility). Binding at each modulator concentration was normalized to that without modulator and averaged across experiments. In the flop isoform (right panels), the CTZ-induced reduction in [3H]FW binding was greatly attenuated in R628E (−27% compared with −60% in WT). Conversely, the CX614-induced increase in [3H]FW binding was significantly enhanced in R628E receptors (+62% compared with +30% in WT). In the flip isoform (left panels), these changes in the effectiveness of CTZ and CX614 were much smaller. Error bars represent S.E.
FIGURE 7.
FIGURE 7.
R628E physiological data can be replicated using a kinetic rate model. A, model schematic showing receptor states and the transitions between them (black). A simplified agonist binding site model was used in which either one (R-Glu) or two molecules (R-Glu2) of glutamate can bind to the AMPA receptor (R) allowing transition to an open state (R*-Glu2). Alternatively, receptors can enter desensitized states (Rd-Glu and Rd-Glu2). Identical states have been constructed for receptor in the presence of allosteric modulators (light gray; RM, RM-Glu, RM-Glu2, R*M-Glu2, RdM-Glu, and RdM-Glu2) with receptors states transitioning between modulator-bound and -unbound (gray arrows). The accompanying table describes relationships between receptor states and transitions and the nomenclature of rates used for modeling (actual rates are provided in Table 2): kon, agonist binding; koff, agonist dissociation; β, channel opening; α, channel closing; δ, entrance into desensitization; γ, recovery from desensitization. Rates denoted as prime (e.g. kon) represent modulator-bound transitions; k+ denotes modulator on-rate constant; and k, k, and k denote dissociation rate constants of modulator. All modulator on-rate constants were set equal to simplify the model, and modulator dissociation rate constants do not vary independently but are dependent on other parameter changes to maintain microscopic reversibility. Thus, due to redundancy between the transitions, the rates that could be manipulated were kon, koff, α, β, δ, and γ for control wild type. B and C, simulations of flip (upper) and flop (lower) deactivation (B) and desensitization (C) using wild type (gray) and R628E (black) transition rates (bar above trace, 10 mm glutamate application; scale bars, 5 ms for deactivation and 100 ms for desensitization). D, simulated paired pulse recovery of R628E flop using an initial 200-ms desensitizing pulse of 10 mm glutamate followed by a second 10 mm pulse at increasing time intervals (scale bar, 100 ms). E, recovery from desensitization measured by the ratio of the second peak amplitude to the first peak amplitude with increasing interpulse interval (D). A single exponential function was fit to the resulting values, yielding a time constant for recovery from desensitization of τrecovery = 29.3 ms.
FIGURE 8.
FIGURE 8.
Fitting of fluorowillardiine binding indicates that R628E stabilizes the agonist-bound closed state of the AMPA receptor. A, fits to the 12-state binding model for equilibrium binding of [3H]FW to the flop isoform of either wild type (open circles and gray line) or R628E mutant (filled circles and black line) AMPA receptors. Experimental data for saturation binding curves for [3H]FW are the same as in Fig. 6A (right panel). Best fit rate constant parameters for FW binding in the absence of modulator were used as constants for transitions among states 1–6 for subsequent fits with different concentrations of modulator. B, fits (solid lines) of the 12-state binding model to the modulation of [3H]FW binding of flop isoform receptors by cyclothiazide. Experimental data are the same as in Fig. 6B (right panel). C, fits (solid lines) of the 12-state binding model to the modulation of [3H]FW binding of flop isoform receptors by CX614. Experimental data are the same as in Fig. 6C (right panel). For B and C, data and fits have been normalized to FW binding in the absence of modulator. Error bars are S.E. D, Gibbs free energy diagrams calculated using fitted rate constant parameters determined for wild type (gray lines) and R628E mutant (black lines) with the 12-state model solutions for flop isoform binding data. Troughs from left to right of the upper trace represent the unbound receptor, the agonist-bound closed channel receptor, and the agonist-bound open channel. The lower trace represents the transition between the agonist-bound, closed channel receptor and the agonist-bound, desensitized receptor. Peaks represent the transitions between the states and are marked by their rate constants as defined in Fig. 7A (with FW substituted for glutamate). Forward rate constants are positioned above the line; reverse rate constants are below the line. These diagrams show that the fitted solution to the binding data indicates that the mutant stabilizes the agonist-bound, closed channel conformation of the receptor.

Similar articles

Cited by

References

    1. Traynelis S. F., Wollmuth L. P., McBain C. J., Menniti F. S., Vance K. M., Ogden K. K., Hansen K. B., Yuan H., Myers S. J., Dingledine R. (2010) Glutamate receptor ion channels: structure, regulation, and function. Pharmacol. Rev. 62, 405–496 - PMC - PubMed
    1. Swanson G. T., Kamboj S. K., Cull-Candy S. G. (1997) Single-channel properties of recombinant AMPA receptors depend on RNA editing, splice variation, and subunit composition. J. Neurosci. 17, 58–69 - PMC - PubMed
    1. Koike M., Tsukada S., Tsuzuki K., Kijima H., Ozawa S. (2000) Regulation of kinetic properties of GluR2 AMPA receptor channels by alternative splicing. J. Neurosci. 20, 2166–2174 - PMC - PubMed
    1. Partin K. M., Mayer M. L. (1996) Negative allosteric modulation of wild-type and mutants AMPA receptors by GYKI 53655. Mol. Pharmacol. 49, 142–148 - PubMed
    1. Armstrong N., Gouaux E. (2000) Mechanisms for activation and antagonism of an AMPA-sensitive glutamate receptor: crystal structures of the GluR2 ligand binding core. Neuron 28, 165–181 - PubMed

Publication types

Substances

LinkOut - more resources