

Effects of minimum unit pricing for alcohol on different income and socioeconomic groups: a modelling study
- PMID: 24522180
- PMCID: PMC4018486
- DOI: 10.1016/S0140-6736(13)62417-4
Effects of minimum unit pricing for alcohol on different income and socioeconomic groups: a modelling study
Erratum in
- Lancet. 2014 May 10;383(9929):1636
Abstract
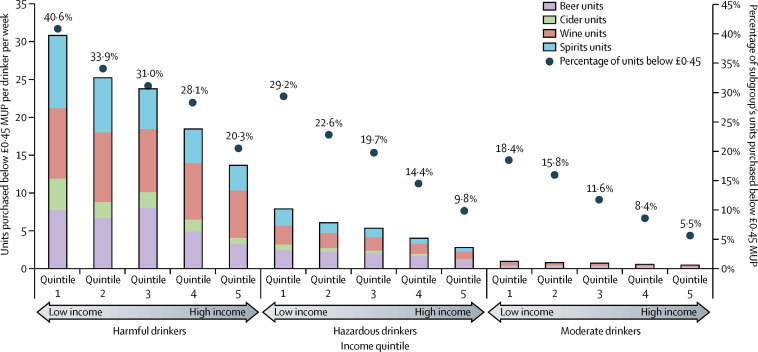
Background: Several countries are considering a minimum price policy for alcohol, but concerns exist about the potential effects on drinkers with low incomes. We aimed to assess the effect of a £0·45 minimum unit price (1 unit is 8 g/10 mL ethanol) in England across the income and socioeconomic distributions.
Methods: We used the Sheffield Alcohol Policy Model (SAPM) version 2.6, a causal, deterministic, epidemiological model, to assess effects of a minimum unit price policy. SAPM accounts for alcohol purchasing and consumption preferences for population subgroups including income and socioeconomic groups. Purchasing preferences are regarded as the types and volumes of alcohol beverages, prices paid, and the balance between on-trade (eg, bars) and off-trade (eg, shops). We estimated price elasticities from 9 years of survey data and did sensitivity analyses with alternative elasticities. We assessed effects of the policy on moderate, hazardous, and harmful drinkers, split into three socioeconomic groups (living in routine or manual households, intermediate households, and managerial or professional households). We examined policy effects on alcohol consumption, spending, rates of alcohol-related health harm, and opportunity costs associated with that harm. Rates of harm and costs were estimated for a 10 year period after policy implementation. We adjusted baseline rates of mortality and morbidity to account for differential risk between socioeconomic groups.
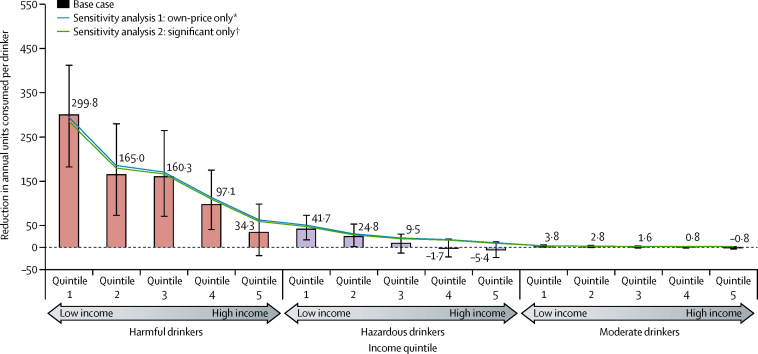
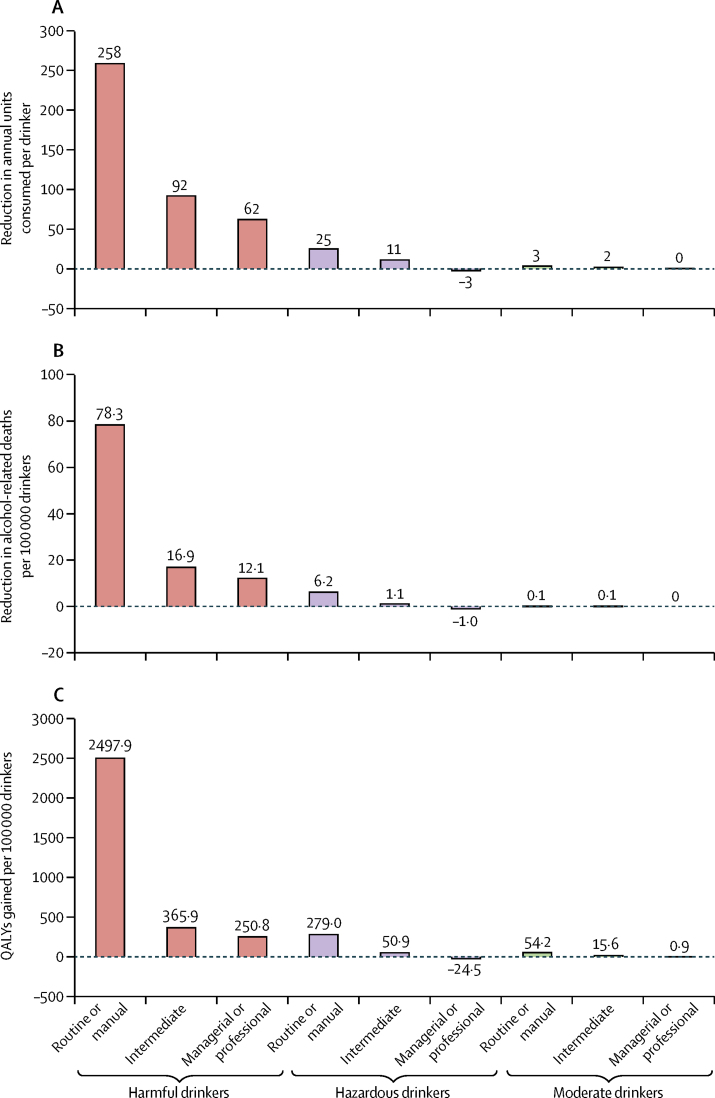
Findings: Overall, a minimum unit price of £0.45 led to an immediate reduction in consumption of 1.6% (-11.7 units per drinker per year) in our model. Moderate drinkers were least affected in terms of consumption (-3.8 units per drinker per year for the lowest income quintile vs 0.8 units increase for the highest income quintile) and spending (increase in spending of £0.04 vs £1.86 per year). The greatest behavioural changes occurred in harmful drinkers (change in consumption of -3.7% or -138.2 units per drinker per year, with a decrease in spending of £4.01), especially in the lowest income quintile (-7.6% or -299.8 units per drinker per year, with a decrease in spending of £34.63) compared with the highest income quintile (-1.0% or -34.3 units, with an increase in spending of £16.35). Estimated health benefits from the policy were also unequally distributed. Individuals in the lowest socioeconomic group (living in routine or manual worker households and comprising 41.7% of the sample population) would accrue 81.8% of reductions in premature deaths and 87.1% of gains in terms of quality-adjusted life-years.
Interpretation: Irrespective of income, moderate drinkers were little affected by a minimum unit price of £0.45 in our model, with the greatest effects noted for harmful drinkers. Because harmful drinkers on low incomes purchase more alcohol at less than the minimum unit price threshold compared with other groups, they would be affected most by this policy. Large reductions in consumption in this group would however coincide with substantial health gains in terms of morbidity and mortality related to reduced alcohol consumption.
Funding: UK Medical Research Council and Economic and Social Research Council (grant G1000043).
Copyright © 2014 Holmes et al. Open Access article distributed under the terms of CC BY. Published by Elsevier Ltd. All rights reserved.
Figures
Comment in
-
Alcohol minimum unit pricing and socioeconomic status.Lancet. 2014 May 10;383(9929):1616-1617. doi: 10.1016/S0140-6736(14)60154-9. Epub 2014 Feb 10. Lancet. 2014. PMID: 24522179 No abstract available.
Similar articles
-
Potential benefits of minimum unit pricing for alcohol versus a ban on below cost selling in England 2014: modelling study.BMJ. 2014 Sep 30;349:g5452. doi: 10.1136/bmj.g5452. BMJ. 2014. PMID: 25270743 Free PMC article.
-
Estimated Effects of Different Alcohol Taxation and Price Policies on Health Inequalities: A Mathematical Modelling Study.PLoS Med. 2016 Feb 23;13(2):e1001963. doi: 10.1371/journal.pmed.1001963. eCollection 2016 Feb. PLoS Med. 2016. PMID: 26905063 Free PMC article.
-
Tackling alcohol misuse: purchasing patterns affected by minimum pricing for alcohol.Appl Health Econ Health Policy. 2012 Jan 1;10(1):51-63. doi: 10.2165/11594840-000000000-00000. Appl Health Econ Health Policy. 2012. PMID: 22136104
-
Potential effects of minimum unit pricing at local authority level on alcohol-attributed harms in North West and North East England: a modelling study.Southampton (UK): NIHR Journals Library; 2021 Mar. Southampton (UK): NIHR Journals Library; 2021 Mar. PMID: 33764725 Free Books & Documents. Review.
-
Intended and unintended consequences of the implementation of minimum unit pricing of alcohol in Scotland: a natural experiment.Southampton (UK): NIHR Journals Library; 2021 Oct. Southampton (UK): NIHR Journals Library; 2021 Oct. PMID: 34699154 Free Books & Documents. Review.
Cited by
-
The increasing lifespan variation gradient by area-level deprivation: A decomposition analysis of Scotland 1981-2011.Soc Sci Med. 2019 Jun;230:147-157. doi: 10.1016/j.socscimed.2019.04.008. Epub 2019 Apr 16. Soc Sci Med. 2019. PMID: 31009881 Free PMC article.
-
The Preventable Risk Integrated ModEl and Its Use to Estimate the Health Impact of Public Health Policy Scenarios.Scientifica (Cairo). 2014;2014:748750. doi: 10.1155/2014/748750. Epub 2014 Sep 25. Scientifica (Cairo). 2014. PMID: 25328757 Free PMC article. Review.
-
Socioeconomic status as an effect modifier of alcohol consumption and harm: analysis of linked cohort data.Lancet Public Health. 2017 May 10;2(6):e267-e276. doi: 10.1016/S2468-2667(17)30078-6. eCollection 2017 Jun. Lancet Public Health. 2017. PMID: 28626829 Free PMC article.
-
Potential benefits of minimum unit pricing for alcohol versus a ban on below cost selling in England 2014: modelling study.BMJ. 2014 Sep 30;349:g5452. doi: 10.1136/bmj.g5452. BMJ. 2014. PMID: 25270743 Free PMC article.
-
An N-of-1 study of daily alcohol consumption following minimum unit pricing implementation in Scotland.Addiction. 2021 Jul;116(7):1725-1733. doi: 10.1111/add.15382. Epub 2021 Jan 12. Addiction. 2021. PMID: 33372333 Free PMC article.
References
-
- Department of Health Steering group report on a national substance misuse strategy. 2012. http://www.drugs.ie/resourcesfiles/reports/Steering_Group_Report_NSMS.pdf (accessed April 14, 2013).
-
- Australian National Preventive Health Agency Exploring the public interest case for a minimum (floor) price for alcohol: draft report. 2012. http://www.anpha.gov.au/internet/anpha/publishing.nsf/Content/minimum-pr... (accessed July 2, 2013).
-
- Canadian Public Health Association . Too high a cost: a public health approach to alcohol policy in Canada. Canadian Public Health Association; Ottawa: 2013.
-
- Home Office Next steps following the consultation on delivering the Government's alcohol strategy. 2013. https://www.gov.uk/government/uploads/system/uploads/attachment_data/fil... (accessed Oct 4, 2013).
-
- Hansard House of Commons Debate 14 March 2013. Hansard. 2013;560:451–491.
Publication types
MeSH terms
Grants and funding
LinkOut - more resources
Full Text Sources
Other Literature Sources
Medical
