Supporting a role for the GTPase Rab7 in prostate cancer progression
- PMID: 24505328
- PMCID: PMC3914878
- DOI: 10.1371/journal.pone.0087882
Supporting a role for the GTPase Rab7 in prostate cancer progression
Abstract
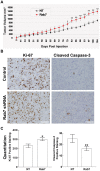
Invasion and subsequent metastasis is the major cause of death from most cancers including prostate cancer. Herein we report on the potential tumor suppressive properties of Rab7, a GTPase that regulates trafficking of lysosomes. The movement of lysosomes to the cell surface in response to environmental cues increases the secretion of proteinases and cell invasion. We determined that Troglitazone and other members of the Thiazolidinedione family inhibit cell-surface directed lysosome trafficking and cathepsin B secretion through a Rab7-dependent mechanism. Moreover, Rab7 shRNA expressing cells were found to be more invasive in vitro and in vivo. Increased invasiveness was accompanied by elevated expression of the c-Met receptor and prolonged downstream signaling, thereby supporting a role for Rab7 as a mediator of signaling down-regulation. Taken together, these results suggested that Rab7 acts as a negative regulator of prostate tumor growth and invasion, providing further evidence for its potential as a tumor suppressor.
Conflict of interest statement
Figures


Similar articles
-
Thiazolidinediones induce Rab7-RILP-MAPK-dependent juxtanuclear lysosome aggregation and reduce tumor cell invasion.Traffic. 2010 Feb;11(2):274-86. doi: 10.1111/j.1600-0854.2009.01012.x. Epub 2009 Dec 5. Traffic. 2010. PMID: 20015112
-
HGF-induced invasion by prostate tumor cells requires anterograde lysosome trafficking and activity of Na+-H+ exchangers.J Cell Sci. 2010 Apr 1;123(Pt 7):1151-9. doi: 10.1242/jcs.063644. Epub 2010 Mar 9. J Cell Sci. 2010. PMID: 20215403 Free PMC article.
-
Endothelial Rab7 GTPase mediates tumor growth and metastasis in lysosomal acid lipase-deficient mice.J Biol Chem. 2017 Nov 24;292(47):19198-19208. doi: 10.1074/jbc.M116.773093. Epub 2017 Sep 18. J Biol Chem. 2017. PMID: 28924047 Free PMC article.
-
Rab7: roles in membrane trafficking and disease.Biosci Rep. 2009 Jun;29(3):193-209. doi: 10.1042/BSR20090032. Biosci Rep. 2009. PMID: 19392663 Review.
-
This Is the End: Regulation of Rab7 Nucleotide Binding in Endolysosomal Trafficking and Autophagy.Front Cell Dev Biol. 2018 Oct 2;6:129. doi: 10.3389/fcell.2018.00129. eCollection 2018. Front Cell Dev Biol. 2018. PMID: 30333976 Free PMC article. Review.
Cited by
-
Altered endosome biogenesis in prostate cancer has biomarker potential.Mol Cancer Res. 2014 Dec;12(12):1851-62. doi: 10.1158/1541-7786.MCR-14-0074. Epub 2014 Jul 30. Mol Cancer Res. 2014. PMID: 25080433 Free PMC article.
-
Mechanisms and functions of lysosome positioning.J Cell Sci. 2016 Dec 1;129(23):4329-4339. doi: 10.1242/jcs.196287. Epub 2016 Oct 31. J Cell Sci. 2016. PMID: 27799357 Free PMC article. Review.
-
The role of the small GTPase Rab31 in cancer.J Cell Mol Med. 2015 Jan;19(1):1-10. doi: 10.1111/jcmm.12403. Epub 2014 Dec 3. J Cell Mol Med. 2015. PMID: 25472813 Free PMC article. Review.
-
TRIM39 deficiency inhibits tumor progression and autophagic flux in colorectal cancer via suppressing the activity of Rab7.Cell Death Dis. 2021 Apr 12;12(4):391. doi: 10.1038/s41419-021-03670-3. Cell Death Dis. 2021. PMID: 33846303 Free PMC article.
-
Lysosomal positioning diseases: beyond substrate storage.Open Biol. 2022 Oct;12(10):220155. doi: 10.1098/rsob.220155. Epub 2022 Oct 26. Open Biol. 2022. PMID: 36285443 Free PMC article. Review.
References
-
- Benvenuti S, Comoglio PM (2007) The MET Receptor Tyrosine Kinase in Invasion and Metastasis. J Cell Physiol 213: 316–325. - PubMed
-
- Yilmaz M, Christofori G (2009) EMT, the cytoskeleton, and cancer cell invasion. Cancer Met Rev 28: 15–33. - PubMed
-
- Gatenby RA, Gillies RJ (2008) A microenvironmental model of carcinogenesis. 8: 56–61. - PubMed
-
- Moellering R, Black K, Krishnamurty C, Baggett BK, Stafford P, et al. (2008) Acid treatment of melanoma cells selects for invasive phenotypes. Clin Exp Metastasis 25: 411–425. - PubMed
-
- Friedl P, Wolf K (2008) Tube Travel: The Role of Proteases in Individual and Collective Cancer Cell Invasion. Cancer Res 68: 7247–7249. - PubMed
Publication types
MeSH terms
Substances
Grants and funding
LinkOut - more resources
Full Text Sources
Other Literature Sources
Medical
Miscellaneous

