. 2014 Jan 30;10(1):e1003915.
doi: 10.1371/journal.ppat.1003915. eCollection 2014 Jan.

Plasmacytoid dendritic cell dynamics tune interferon-alfa production in SIV-infected cynomolgus macaques

Affiliations

Plasmacytoid dendritic cell dynamics tune interferon-alfa production in SIV-infected cynomolgus macaques

Timothée Bruel et al. PLoS Pathog. .

Abstract

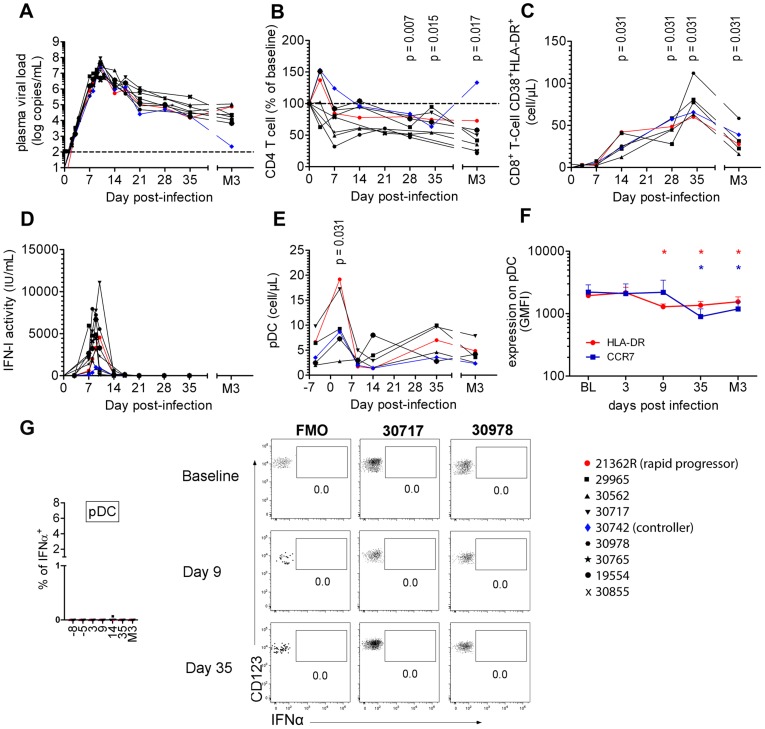
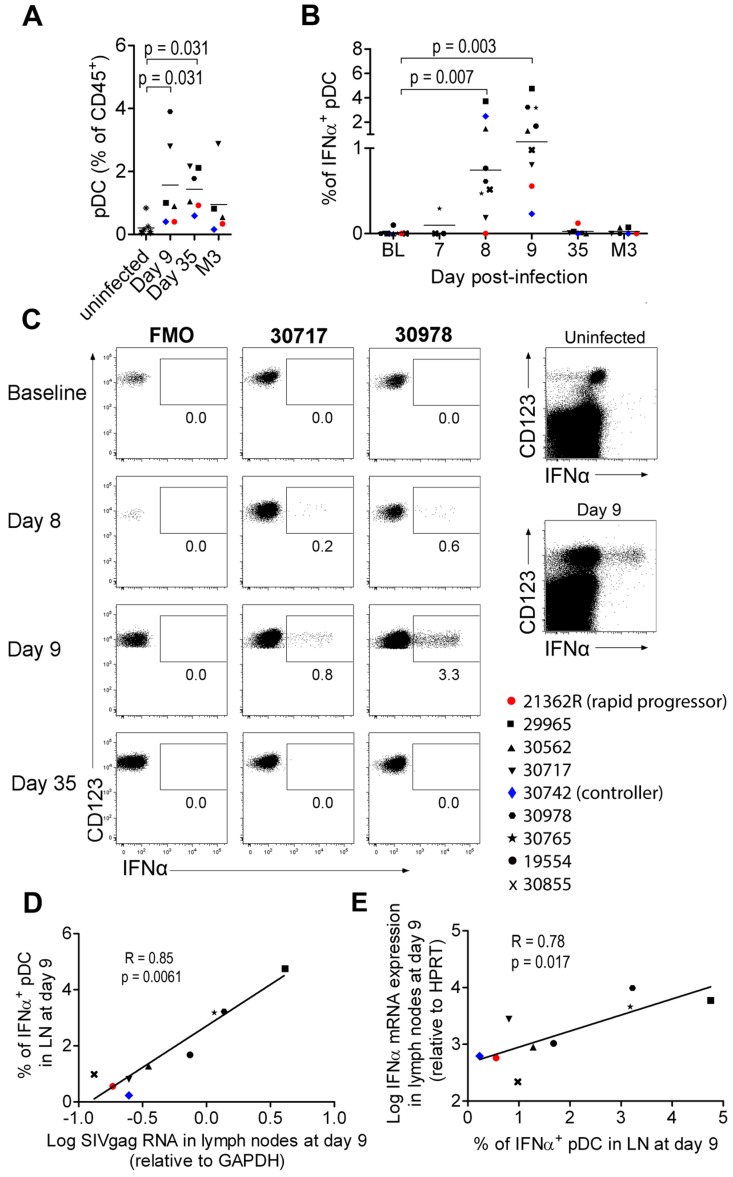
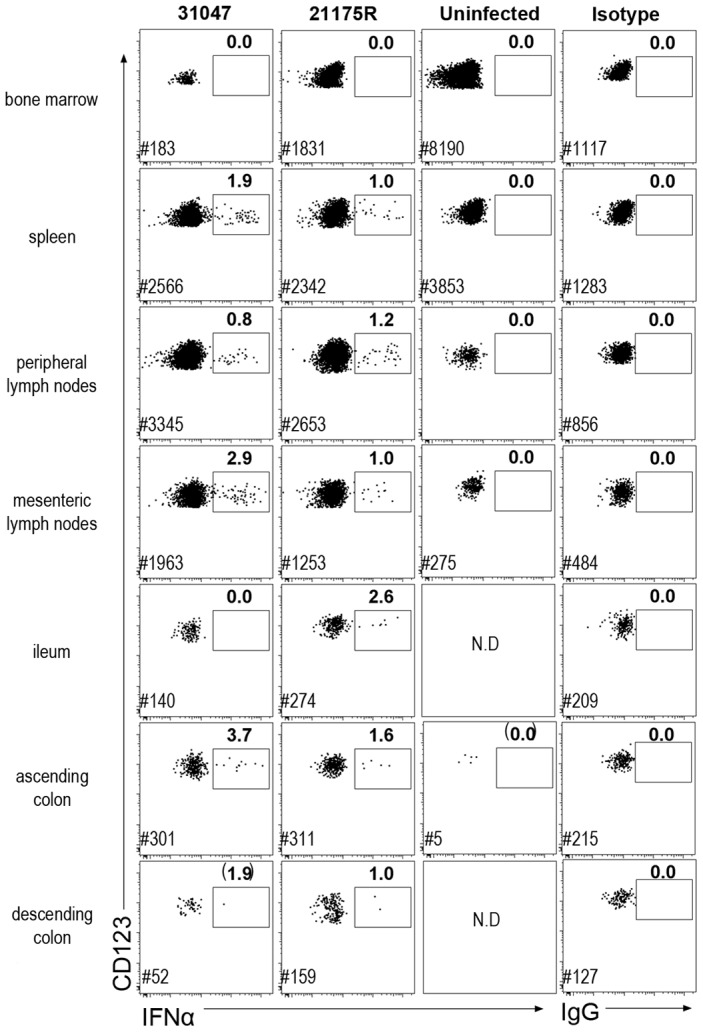
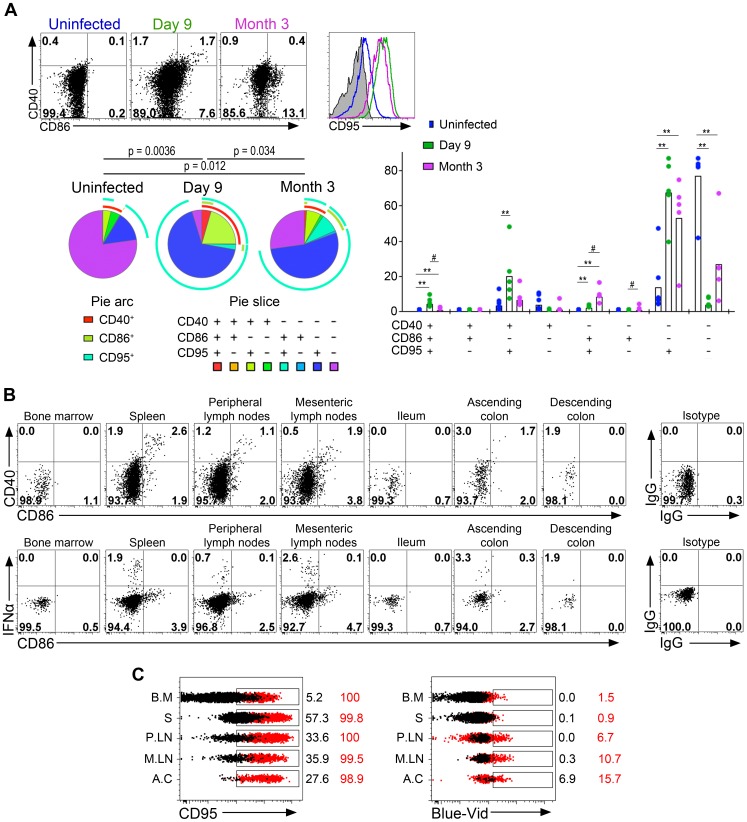
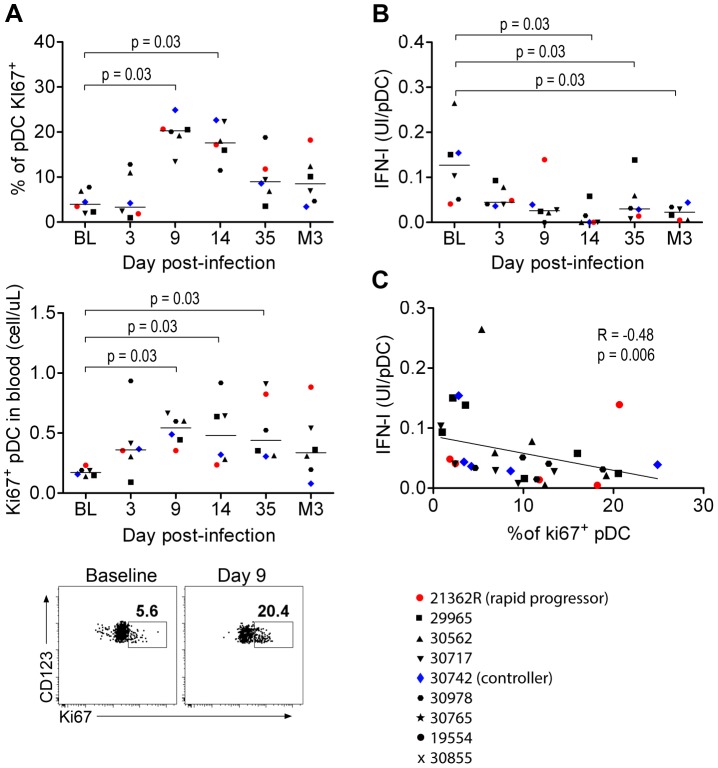
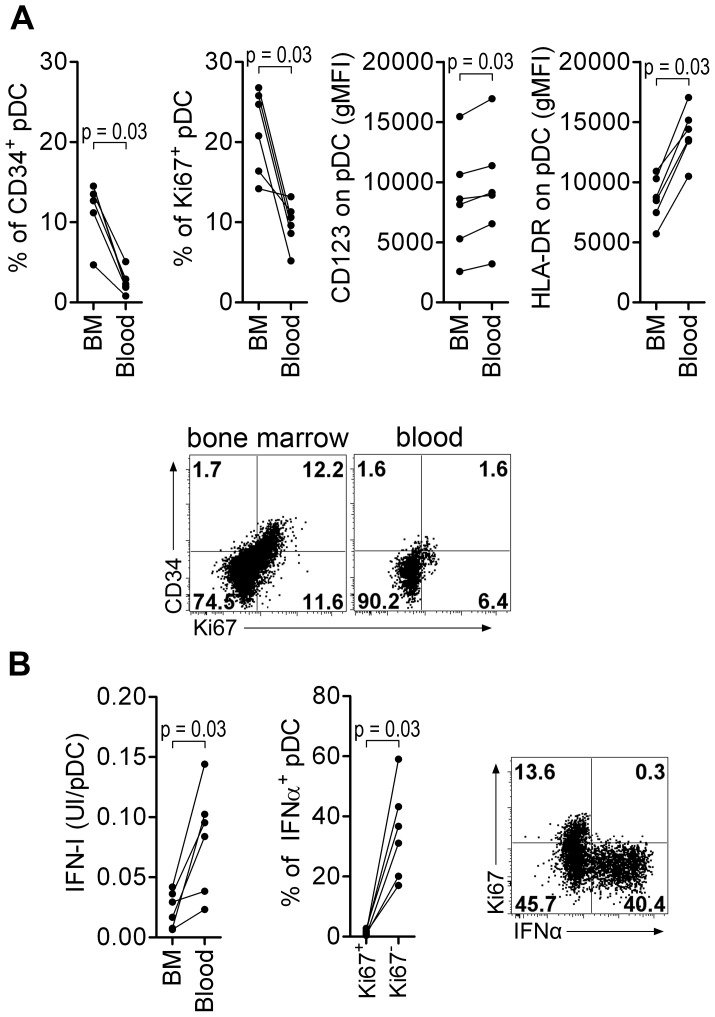
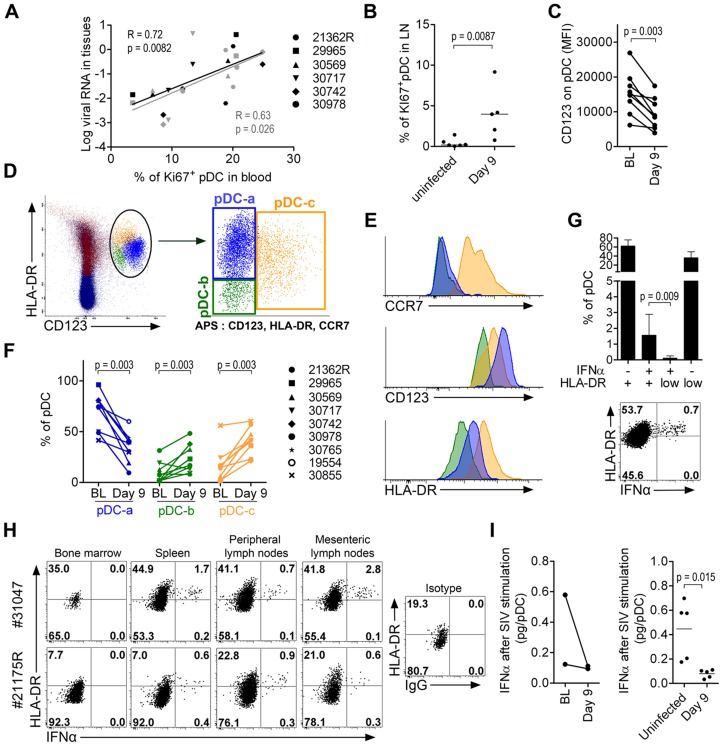
IFN-I production is a characteristic of HIV/SIV primary infections. However, acute IFN-I plasma concentrations rapidly decline thereafter. Plasmacytoid dendritic cells (pDC) are key players in this production but primary infection is associated with decreased responsiveness of pDC to TLR 7 and 9 triggering. IFNα production during primary SIV infection contrasts with increased pDC death, renewal and dysfunction. We investigated the contribution of pDC dynamics to both acute IFNα production and the rapid return of IFNα concentrations to pre-infection levels during acute-to-chronic transition. Nine cynomolgus macaques were infected with SIVmac251 and IFNα-producing cells were quantified and characterized. The plasma IFN-I peak was temporally associated with the presence of IFNα(+) pDC in tissues but IFN-I production was not detectable during the acute-to-chronic transition despite persistent immune activation. No IFNα(+) cells other than pDC were detected by intracellular staining. Blood-pDC and peripheral lymph node-pDC both lost IFNα(-) production ability in parallel. In blood, this phenomenon correlated with an increase in the counts of Ki67(+)-pDC precursors with no IFNα production ability. In tissues, it was associated with increase of both activated pDC and KI67(+)-pDC precursors, none of these being IFNα(+) in vivo. Our findings also indicate that activation/death-driven pDC renewal rapidly blunts acute IFNα production in vivo: pDC sub-populations with no IFNα-production ability rapidly increase and shrinkage of IFNα production thus involves both early pDC exhaustion, and increase of pDC precursors.


Conflict of interest statement

The authors have declared that no competing interests exist.

Figures

Figure 1
Figure 1. Cynomolgus macaques were infected intravenously with 5,000AID50 of SIVmac251 and chronic infection established.
(A) Longitudinal follow-up of viral RNA load in plasma (n = 9). (B) CD4+ T-cell blood counts at various times following infection (n = 9). (C) Immune activation measured as HLA-DR+CD38+ co-expression by CD8+ T-cells (n = 6). (D) Type I Interferon (IFN-I) antiviral activity measured as the inhibition of Vesicular Stomatitis Virus cytotoxicity to Maddin-Darby Bovine Kidney cells (n = 9). (E) pDC counts in blood at various times(n = 6). (F) CCR7 and HLA-DR MFI on blood pDC (n = 6). (G) IFNα expression after various times of SIV infection in 6 macaques in defined blood cell populations, including from left to right, CD14+ monocytes, mDC, B cells, NK cells, CD4+ T cells, CD8+ T cells and pDC.
Figure 2
Figure 2. Plasmacytoid DCs are major contributors of IFNα production in peripheral lymph nodes during primary infection.
(A) Plasmacytoid DC frequencies among CD45+ PLN leukocytes on days 9 and 35 and month 3 post-infection (n = 6) and in uninfected macaques (n = 7). (B) IFNα-producing pDC in peripheral lymph nodes of 9 macaques at various times after infection as assessed by IFNα intracellular staining. Freshly isolated cells were labeled at various times after infection without any additional in vitro stimulation, after 30 min incubation in the presence of 10 mg/mL Brefeldin A. (C) Dotplots for two representative infected macaques (#30717, #30978) with fluorescence minus one (FMO) shown as a negative control (left). Dotplot showing intracellular IFNα expression in the total live CD45+ leukocyte gate for one representative infected macaque at day 9 p.i., and one representative uninfected macaque (right) (D). The percentage of IFNα+ pDC correlates with relative SIVgag mRNA expression in peripheral lymph nodes (day 9 p.i., n = 9). Spearman correlation. (E) Log10 (relative IFNα mRNA expression) plotted against the percentage of IFNα expressing pDC in PLN (day 9 p.i., n = 9). Spearman correlation. Values at different time points were compared with the Wilcoxon rank sum test. When baseline values were not available, data for infected macaques were compared with uninfected macaques using the Mann-Whitney rank test; p values are given if the differences are statistically significant.
Figure 3
Figure 3. Plasmacytoid DC produce IFNα in both lymphoid and mucosal compartments.
Dotplot showing IFNα intra-cellular staining in gated pDC (CD45+HLA-DR+linCD123+) in different tissues. Cells were labeled ex vivo on fresh cells after 30 min incubation in 10 µg/mL brefeldin A in the absence of any stimulation. Data for two macaques sacrificed on day 10 p.i. and one uninfected control are shown. Mononuclear cells from BM, spleen, peripheral LN, mesenteric LN, ileum, and colon were extracted for FACS analysis. Frequencies of IFNα-pDC are indicated in bold and # indicates the number of pDC recorded for each file.
Figure 4
Figure 4. Plasmacytoid DCs in peripheral lymph nodes are strongly activated and are subject to a high death rate.
(A) Analysis of CD40, CD86 and CD95 expression on pDC in lymph nodes of one representative uninfected macaque, and one representative infected macaque on day 9 and month 3 (M3) p.i. (Top left). SPICE analysis of CD40, CD86 and CD95 expressing pDC from 6 uninfected macaques and 6 infected macaques (day 9 and M3 p.i.) showing the distribution of each sub-population in total pDC as pie chart (n = 6) (Bottom left), and as bar chart (n = 6) (right) for each infection status. (B) Flow cytometry analysis of one animal sacrificed on day 10: CD40 and CD86 expression on gated pDC showing activated pDC with dual expression, and IFNα and CD86 expression. IFNα+ pDC are CD86low/neg. (C) Histogram overlays of CD95 and staining of dead cells (Blue-Vid) in various tissues (BM for bone marrow, S for spleen, PLN for peripheral lymph nodes, MLN for mesenteric lymph nodes, AC for ascending colon) from one of two sacrificed macaques (red) and one uninfected control (black).
Figure 5
Figure 5. Circulating PDC show decreased responses to SIV inversely correlated with the increased prevalence of Ki67+ pDC precursors.
(A) Ki67+ pDC precursors counts during primary infection in the blood of 6 macaques, as a percentage of the total pDC population (Top) and as absolute counts (Middle), and dot plot showing increase of Ki67+ pDC in one representative animal from baseline to day 9 p.i. (Bottom). (B) Evolution of IFNα production per pDC in response to stimulation with 200 ng p27 equivalent of inactivated SIV (SIV-AT-2) for 24 h (n = 6). (C) IFN-I production per pDC in response to SIV-AT2 correlates negatively with the Ki67+ pDC counts.
Figure 6
Figure 6. Macaque bone marrow pDC express lower CD123 and HLA-DR, display higher percentages of CD34+ and Ki67+ precursors than blood pDC, and are poor IFN-I producers.
(A) CD34+ and Ki67+ pDC-precursor frequencies are higher in the bone marrow (BM) than in the blood (non-infected macaques, n = 6), and both CD123 and HLA-DR expressions are lower in BM pDC than blood pDC. From left to right: Percentage of CD34+ pDC precursors, percentage of Ki67+ pDC precursors, and CD123 and HLA-DR geometric MFI (gMFI) in BM and blood pDC. Dotplot showing Ki67 and CD34 expression by pDC in BM and blood, from one representative animal. (B) Bone marrow pDC produce less IFN-I in response to TLR-7/8 stimulation (R848) than blood pDC (non-infected macaques, n = 6) (Left). Most IFNα is produced by Ki67 pDC and not by K67+ precursors (Middle). Representative dot plot showing that only Ki67 pDC produce IFNα (Right). Wilcoxon's rank sum test was used for all comparisons of paired data.
Figure 7
Figure 7. Plasmacytoid DC precursors disseminate into tissues during primary infection and are consistently IFNα negative.
(A) Mobilization of Ki67+ pDC precursors to the blood correlates with tissue viral loads (LN in black and rectum in gray). Spearman correlation. (B) Higher Ki67+ expression on LN pDC in infected animals (n = 5, day 9 p.i.) than uninfected animals (n = 6). (C) Lower CD123 expression in LN-pDC on day 9 p.i. than at baseline (n = 9). (D) Principal component analysis (APS = automated population separator using Infinicyt software) of pDC based on HLA-DR, CD123, and CCR7 expression from merge files of both pre- and day 9 post-infection allowed the identification of three sub-populations in LN. (E) Respective HLA-DR, CD123 and CCR7 expression by the three LN pDC sub-populations. (F) Changes of the three LN pDC sub-populations following SIV infection (from BL to day 9 p.i., n = 9). (G) Frequencies of IFNα pDC in LN according to HLA-DR expression showing that IFNα+ cells are clustered in the HLA-DR intermediate population. Histogram representing 9 animals (Top) and dot plot for one representative animal (Bottom). (H) IFNα and HLA-DR expression on pDC in several compartments on day 10 post-infection showing IFNα+ pDC always show HLA-DR intermediate expression level. Dotplots for the two monkeys sacrificed on day 10p.i. are shown (I) IFNα production per pDC upon SIV stimulation in 5 infected macaques and 5 uninfected macaques. Paired data sets were compared by Wilcoxon's rank sum test and unpaired data sets by the Mann-Whitney test.

Similar articles

Cited by

References

    1. Douek DC, Roederer M, Koup RA (2009) Emerging concepts in the immunopathogenesis of AIDS. Annu Rev Med 60: 471–484. - PMC - PubMed
    1. Chahroudi A, Bosinger SE, Vanderford TH, Paiardini M, Silvestri G (2012) Natural SIV hosts: showing AIDS the door. Science 335: 1188–1193. - PMC - PubMed
    1. Bosinger SE, Li Q, Gordon SN, Klatt NR, Duan L, et al. (2009) Global genomic analysis reveals rapid control of a robust innate response in SIV-infected sooty mangabeys. J Clin Invest 119: 3556–3572. - PMC - PubMed
    1. Jacquelin B, Mayau V, Targat B, Liovat AS, Kunkel D, et al. (2009) Nonpathogenic SIV infection of African green monkeys induces a strong but rapidly controlled type I IFN response. J Clin Invest 119: 3544–3555. - PMC - PubMed
    1. Malleret B, Maneglier B, Karlsson I, Lebon P, Nascimbeni M, et al. (2008) Primary infection with simian immunodeficiency virus: plasmacytoid dendritic cell homing to lymph nodes, type I interferon, and immune suppression. Blood 112: 4598–4608. - PubMed

Publication types

MeSH terms

Grants and funding

This work was supported by the French National Agency for AIDS Research and Viral Hepatitis-(ANRS; www.anrs.fr). TB was funded by the PhD program for life sciences of the CEA (Irtélis-INSTN) and SD was supported by a postdoctoral fellowship from the ANRS. The funders had no role in study design, data collection and analysis, decision to publish, or preparation of the manuscript.

LinkOut - more resources