. 2014 Feb 10;211(2):245-62.
doi: 10.1084/jem.20131043. Epub 2014 Feb 3.

Re-entry into quiescence protects hematopoietic stem cells from the killing effect of chronic exposure to type I interferons

Affiliations

Re-entry into quiescence protects hematopoietic stem cells from the killing effect of chronic exposure to type I interferons

Eric M Pietras et al. J Exp Med. .

Abstract

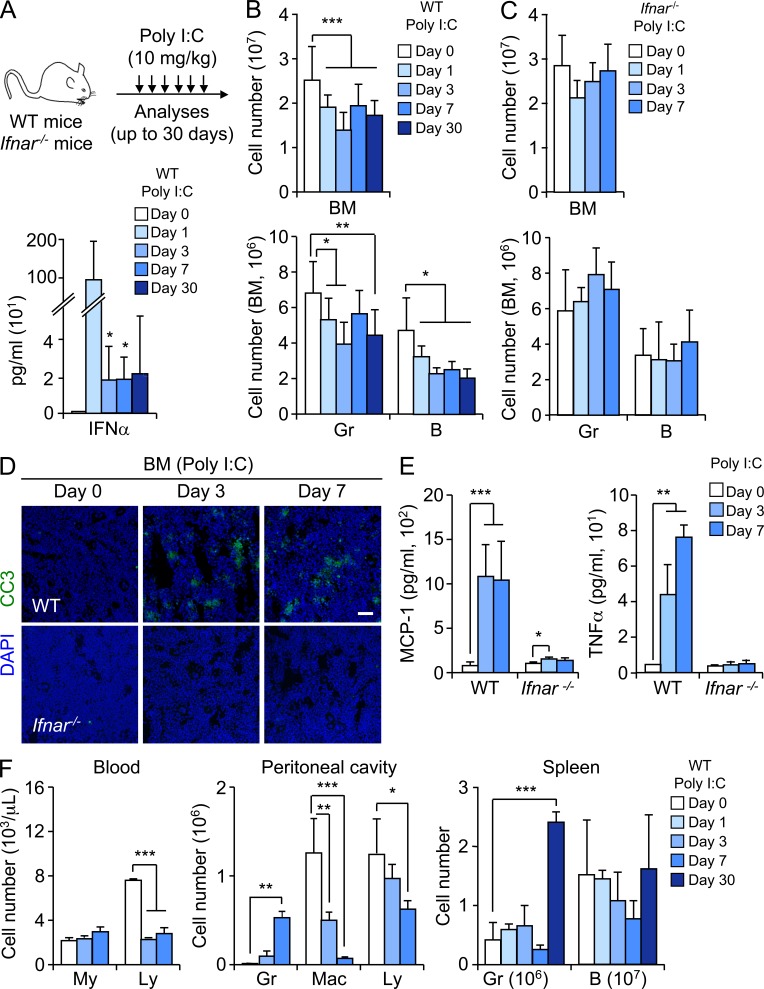
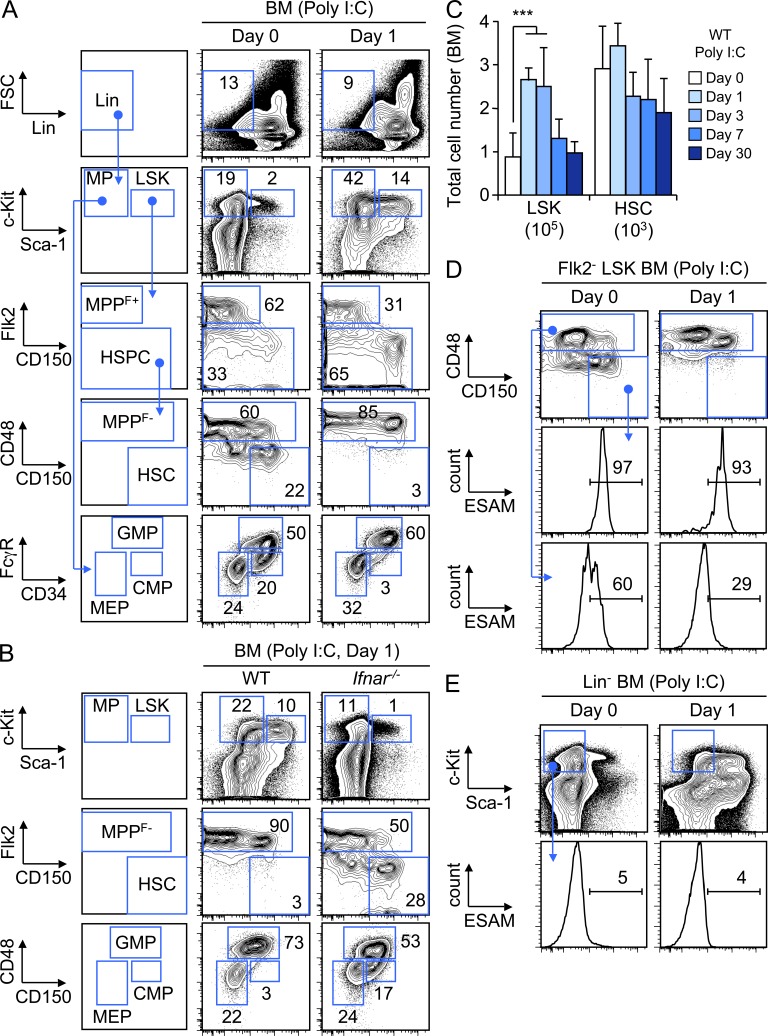
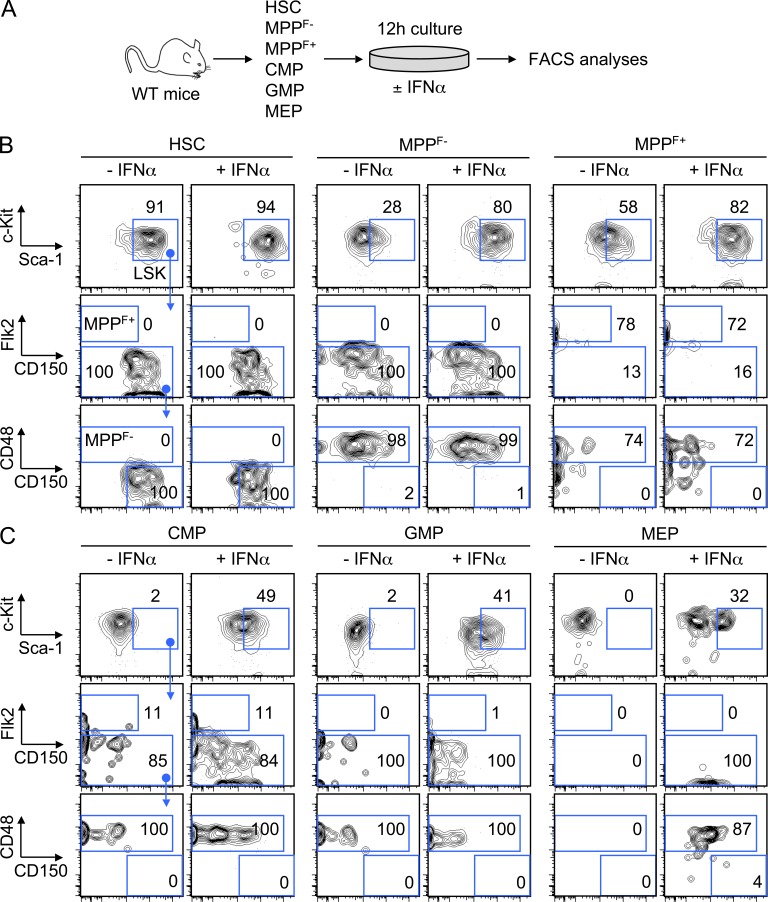
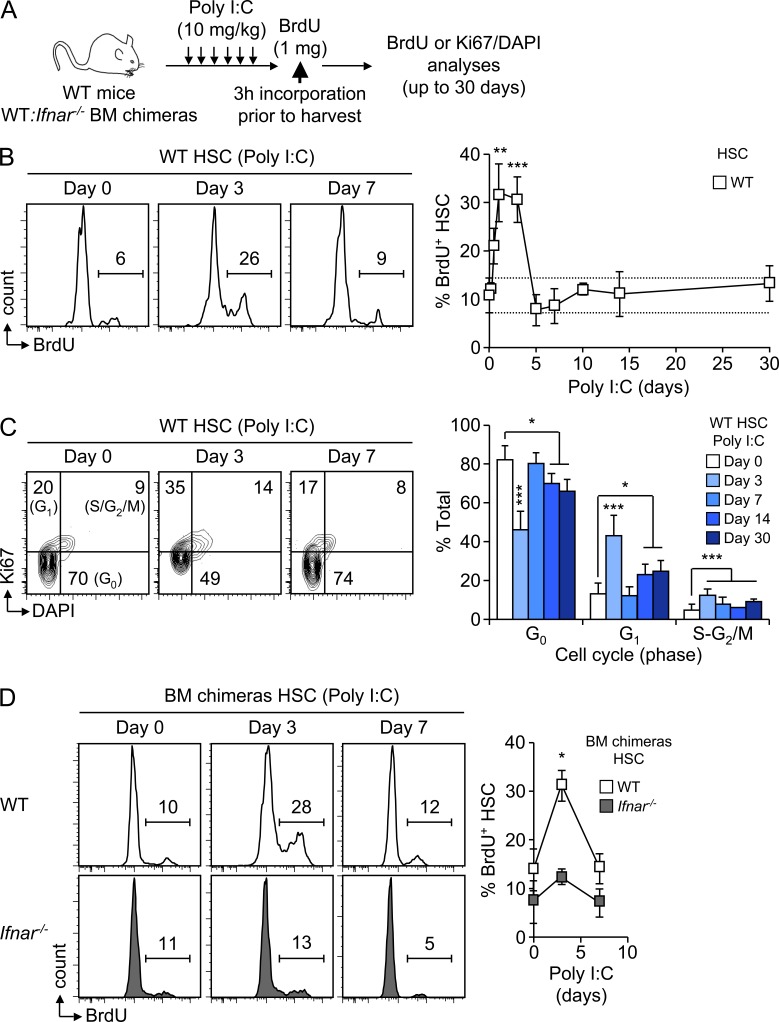
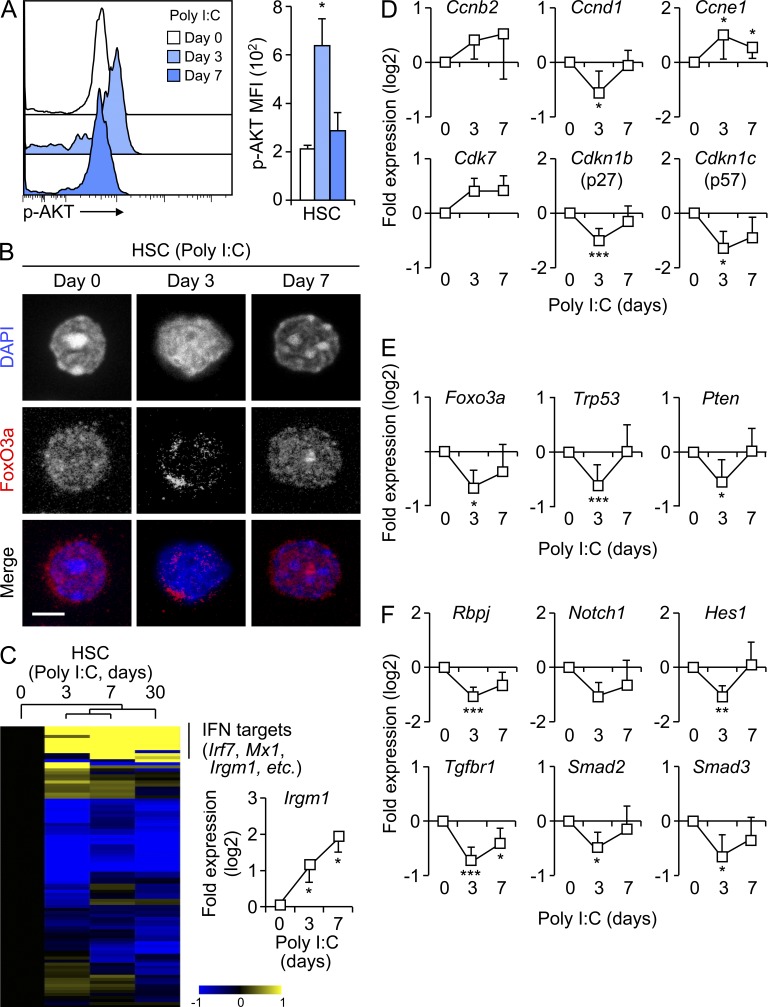
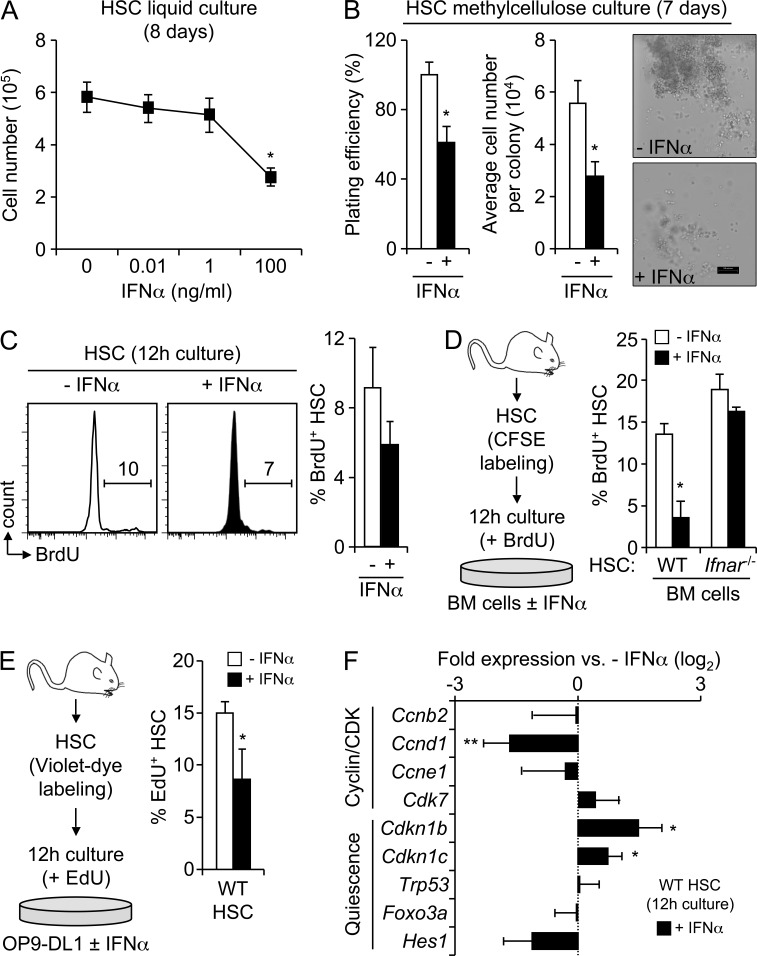
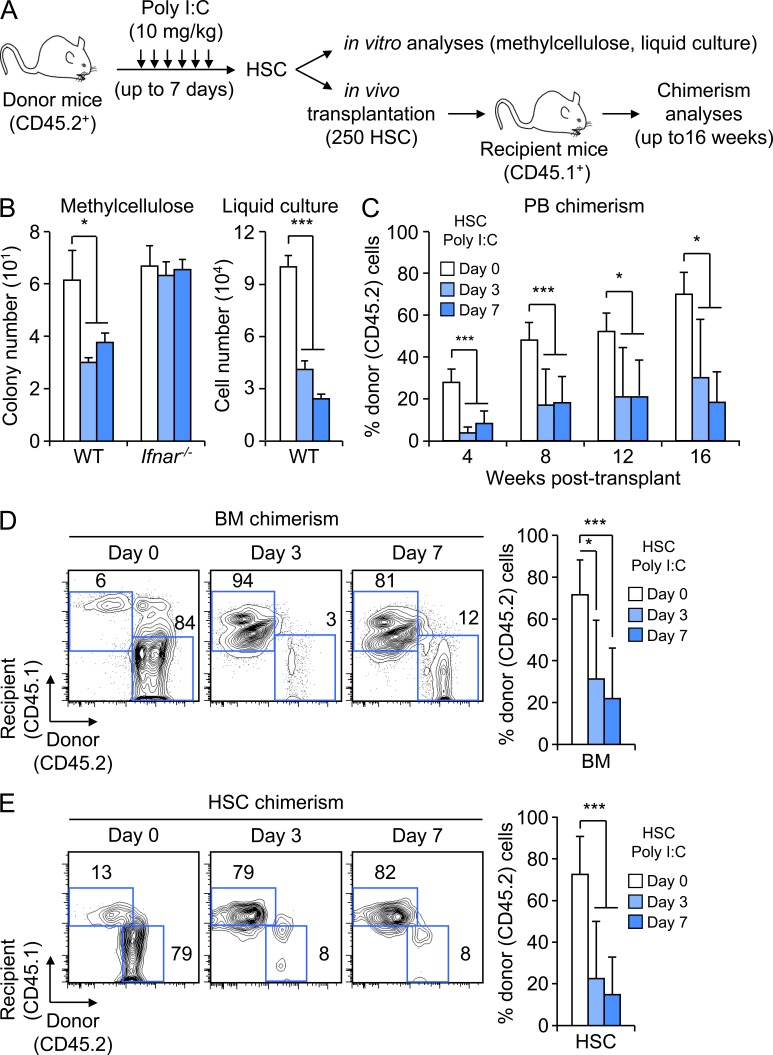
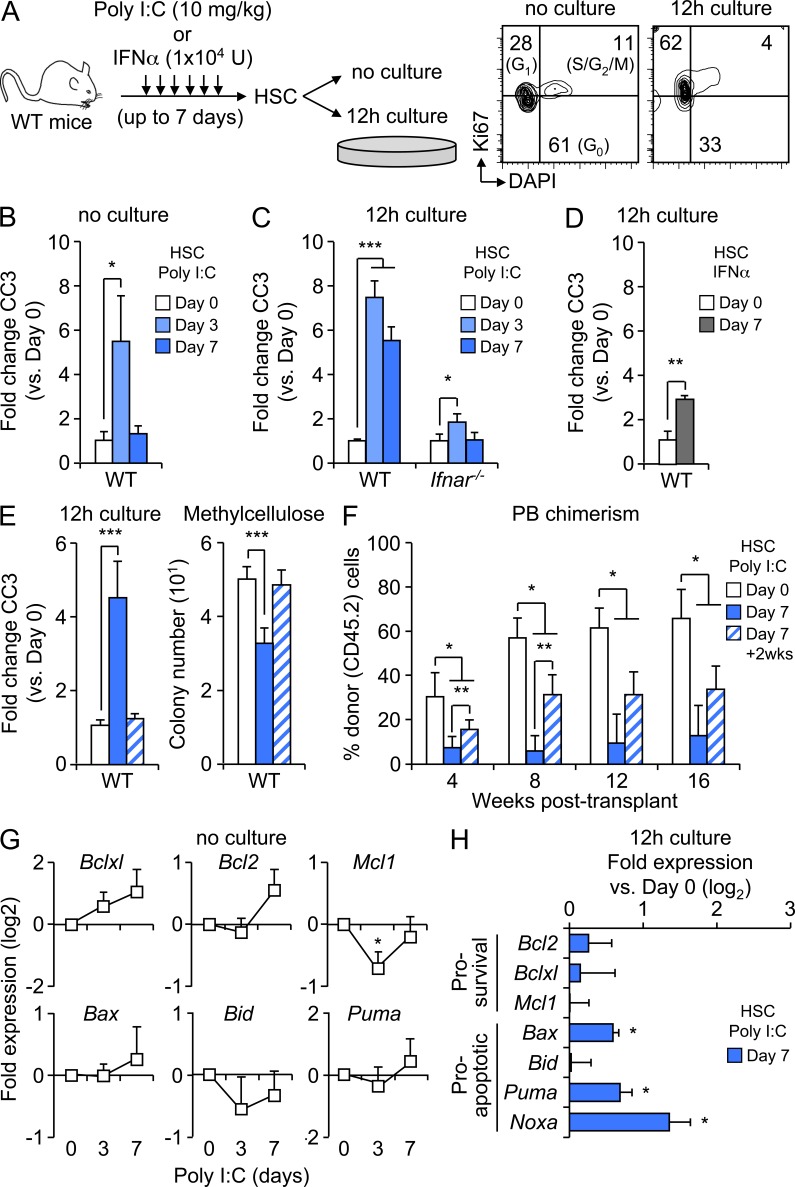
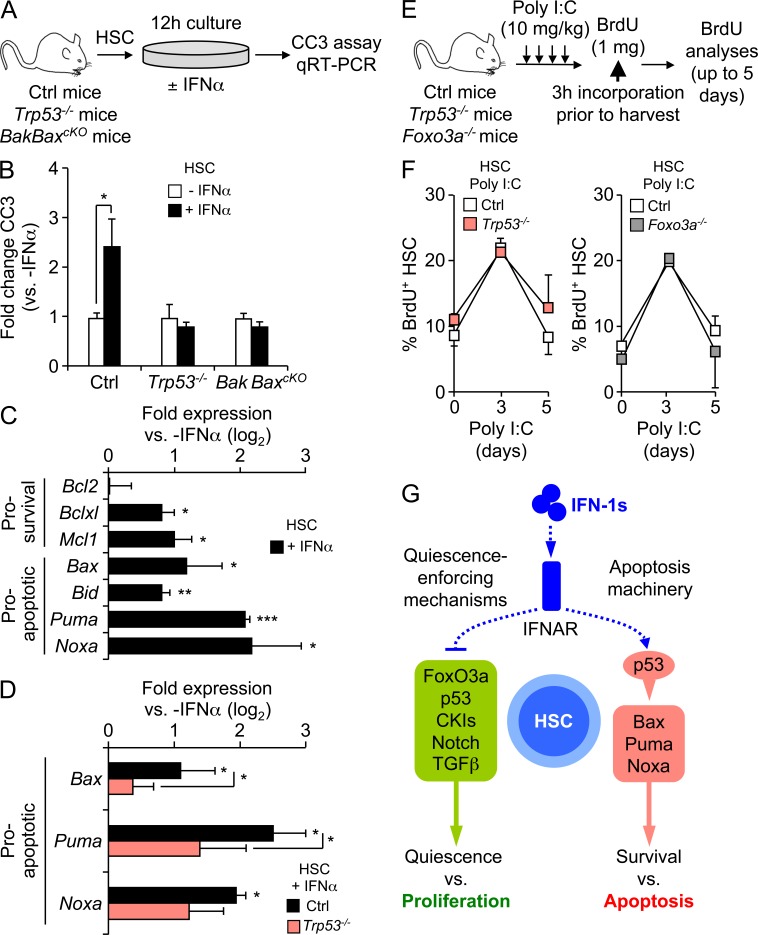
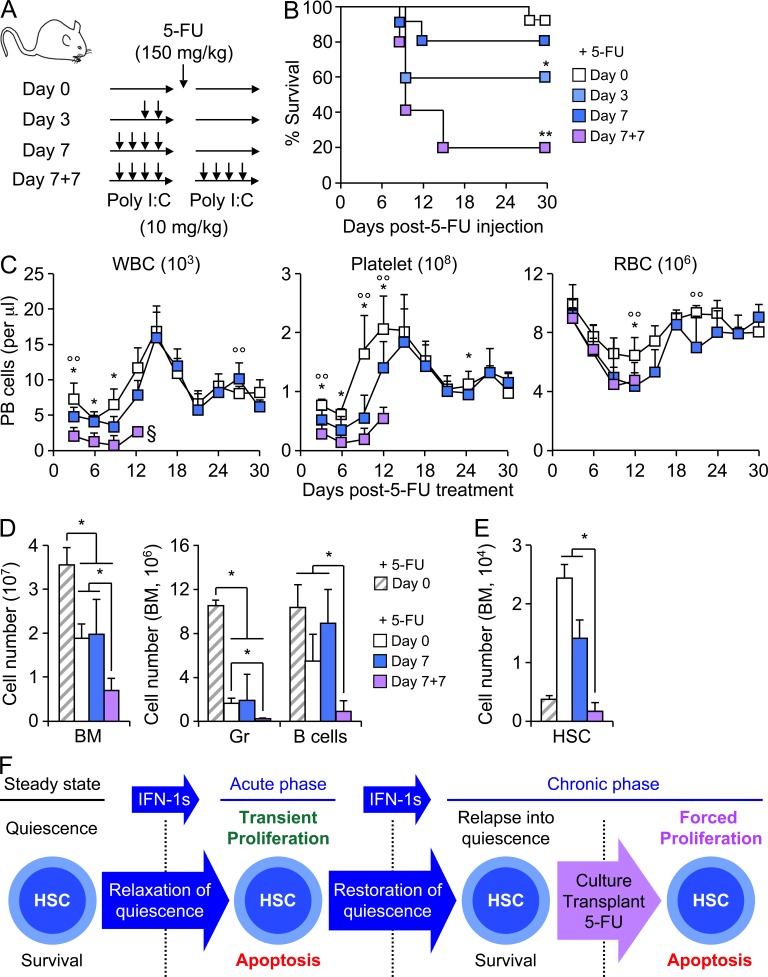
Type I interferons (IFN-1s) are antiviral cytokines that suppress blood production while paradoxically inducing hematopoietic stem cell (HSC) proliferation. Here, we clarify the relationship between the proliferative and suppressive effects of IFN-1s on HSC function during acute and chronic IFN-1 exposure. We show that IFN-1-driven HSC proliferation is a transient event resulting from a brief relaxation of quiescence-enforcing mechanisms in response to acute IFN-1 exposure, which occurs exclusively in vivo. We find that this proliferative burst fails to exhaust the HSC pool, which rapidly returns to quiescence in response to chronic IFN-1 exposure. Moreover, we demonstrate that IFN-1-exposed HSCs with reestablished quiescence are largely protected from the killing effects of IFNs unless forced back into the cell cycle due to culture, transplantation, or myeloablative treatment, at which point they activate a p53-dependent proapoptotic gene program. Collectively, our results demonstrate that quiescence acts as a safeguard mechanism to ensure survival of the HSC pool during chronic IFN-1 exposure. We show that IFN-1s can poise HSCs for apoptosis but induce direct cell killing only upon active proliferation, thereby establishing a mechanism for the suppressive effects of IFN-1s on HSC function.


Figures

Figure 1.
Figure 1.
Chronic IFN-1 exposure induces BM aplasia. (A) Experimental design for acute and chronic poly I:C treatment in mice (top) and serum IFN-α levels in poly I:C–treated WT mice (bottom; 3–9 mice/group). (B) Mean BM cellularity and numbers of granulocytes (Gr) and B cells (B) in one femur and one tibia of poly I:C–treated mice (6–22 mice/group). (C) Mean BM cellularity and numbers of Gr and B cells in one femur and one tibia of poly I:C–treated Ifnar1−/− mice (4–5 mice/group). (D) Immunofluorescence imaging of cleaved caspase-3 (CC3) in femur sections of poly I:C–treated WT and Ifnar−/− mice. Bar, 50 µm. (E) MCP-1 and TNF serum levels in poly I:C–treated WT and Ifnar1−/− mice (3–8 mice/group). (F) Mean myeloid (My) and lymphoid (Ly) cell numbers in peripheral blood (left; 3–5 mice/group); granulocyte (Gr), macrophage (Mac), and lymphocyte (Ly) cell numbers in peritoneal cavity (center; 3–6 mice/group); Gr and B cell numbers in spleens (right; 3–12 mice/group) of poly I:C–treated mice. All data are mean ± SD; statistical significance was determined by Student’s t-test (*, P ≤ 0.05; **, P ≤ 0.01; ***, P ≤ 0.005).
Figure 2.
Figure 2.
Chronic IFN-1 exposure does not alter the size of the HSC compartment. (A) Representative FACS plots for immature stem and progenitor cell populations in the BM of control and 1-d poly I:C–treated mice. (B) Representative FACS plots of stem and progenitor cells in the BM of 1-d poly I:C–treated WT and Ifnar1−/− mice. (C) Mean numbers of LSK and HSCs in one femur and tibia of poly I:C–treated mice (6–22 mice/group). (D and E) Representative FACS plots for ESAM expression in the Flk2 LSK (D) and myeloid progenitor (E) compartments of control and 1-d poly I:C–treated mice. ***, P ≤ 0.005.
Figure 3.
Figure 3.
IFN-1 exposure reactivates Sca-1 expression in myeloid progenitors. (A) Experimental design for FACS analysis of naive hematopoietic populations cultured for 12 h ± 100 ng/ml IFN-α. (B and C) Representative FACS plots and frequency of HSC surface markers on Sca-1–expressing LSK populations (B) and Sca-1 myeloid progenitors (C) cultured for 12 h ± 100 ng/ml IFN-α.
Figure 4.
Figure 4.
Chronic IFN-1 exposure transiently increases HSC proliferation. (A) Experimental design for HSC cell cycle analyses in poly I:C–treated WT and WT:Ifnar1−/− chimeric mice. (B) Representative FACS plots (left) and mean levels (right) of HSC BrdU incorporation (3–13 mice/group). (C) Representative FACS plots (left) and mean HSC distribution (right) in cell cycle phases (3–13 mice/group). (D) Representative FACS plots (left) and mean levels (right) of BrdU incorporation in WT (CD45.1+) and Ifnar1−/− (CD45.2+) HSCs from WT:Ifnar1−/− BM chimeric mice (3–4 mice/group). All data are mean ± SD; statistical significance was determined by Student’s t-test (*, P ≤ 0.05; **, P ≤ 0.01; ***, P ≤ 0.005).
Figure 5.
Figure 5.
IFN-1s transiently antagonize expression of HSC quiescence-enforcing mechanisms in vivo. (A) Representative histograms (left) and average mean fluorescence intensity (MFI, right) for phospho-AKT (p-AKT) levels in CD48 LSK HSCs from poly I:C–treated mice (3 mice/group). (B) Representative immunofluorescence staining of FoxO3a localization in HSCs from poly I:C–treated mice. Bar, 5 µm. (C–F) SABiosciences PCR array analyses of HSCs from poly I:C–treated mice (n = 4, pools of 5 mice/group). (C) Hierarchical clustering of gene expression data (left) and Irgm1 expression (right). (D) Expression of cell cycle and (E and F) quiescence-enforcing machinery genes. Results are expressed as log2 fold relative to day 0 controls. All data are mean ± SD; statistical significance was determined by Student’s t test (*, P ≤ 0.05; ***, P ≤ 0.005).
Figure 6.
Figure 6.
Direct IFN-1 signaling does not induce HSC proliferation in vitro. (A) Mean expansion rate of HSCs grown in the presence of the indicated concentrations of IFN-α in one representative experiment performed in triplicate. (B) Mean number (left), size (center), and pictograms (right; bar, 100 µm) of HSC-derived colonies grown in methylcellulose ± 100 ng/ml IFN-α in one representative experiment performed in triplicate. (C) Representative FACS plots (left) and mean levels (right) of BrdU incorporation in HSCs cultured for 12 h ± 100 ng/ml IFN-α (n = 3). (D) Experimental design (left) and mean levels (right) of BrdU incorporation in CFSE-labeled WT or Ifnar1−/− HSCs after 12 h co-culture with WT BM cells ± 100 ng/ml IFN-α (n = 3). (E) Experimental design (left) and mean levels (right) of EdU incorporation in Violet-labeled HSCs after 12-h co-culture with OP9-DL1 cells ± 100 ng/ml IFN-α (n = 3). (F) Quantitative RT-PCR analysis for expression of cell cycle and quiescence-enforcing genes in HSCs cultured for 12 h ± 100 ng/ml IFN-α (n = 3–4). Results are expressed as log2 fold relative to IFN-α controls. All data are mean ± SD; statistical significance was determined by Student’s t test (*, P ≤ 0.05; **, P ≤ 0.01).
Figure 7.
Figure 7.
Reacquisition of quiescence fails to provide functional protection to IFN-exposed HSCs. (A) Experimental design for HSC functional testing. (B) Mean number of colonies in 7-d methylcellulose culture (left) and cells in 8-d liquid culture (right) obtained with HSCs isolated from poly I:C–treated WT and Ifnar1−/− mice in one representative experiment performed in triplicate. (C–E) Lethally irradiated recipient mice (CD45.1+, 6 mice/group) were transplanted with 250 HSCs isolated from poly I:C–treated WT donor mice (CD45.2+; pools of 3 mice/group). (C) PB chimerism over 16 wk after transplantation. (D) Representative FACS plots (left) and mean percentage (right) of donor-derived CD45.2+ BM cells in 16 wk post-transplantation mice. (E) Representative FACS plots (left) and mean percentage (right) of donor-derived CD45.2+ BM HSCs in 16 wk post-transplantation mice. All data are mean ± SD; statistical significance was determined by Student’s t test (*, P ≤ 0.05; ***, P ≤ 0.005).
Figure 8.
Figure 8.
IFN-1s directly induce apoptosis in cycling HSCs. (A) Experimental design for apoptosis and gene expression analyses (left) and representative FACS plots for cell cycle distribution (right) in freshly isolated and 12-h cultured WT untreated HSCs. (B–D) CC3 levels in HSCs isolated from (B) poly I:C–treated WT mice without culture, (C) poly I:C–treated WT and Ifnar−/− mice after 12-h culture, and (D) IFN-α–treated WT mice after 12-h culture. Results are expressed as fold change relative to day 0 control HSCs in one representative experiment performed in triplicate. (E and F) Analyses of HSCs isolated from mice treated with poly I:C either for 0 and 7 d, or for 7 d followed by 2 wk recovery without poly I:C injections (7 + 2 wk) before harvest. (E) CC3 levels after 12-h culture (left) and mean numbers of colonies in 7-d methylcellulose culture (right). Results are expressed as fold change versus day 0 control HSCs in one representative experiment performed in triplicate. (F) PB chimerism over 16 wk after transplantation of 250 HSCs (isolated from pools of 3 mice/group) into lethally irradiated recipients (4–5 mice/group). (G) SABiosciences PCR array analyses for expression of Bcl2 family genes in HSCs isolated from poly I:C–treated mice (n = 4, pools of 5 mice/group). Results are expressed as log2 fold expression relative to day 0 controls. (H) Quantitative RT-PCR analyses for Bcl2 family gene expression in HSCs isolated from poly I:C–treated mice and cultured for 12 h (n = 3–4). Results are expressed as log2 fold expression relative to day 0 controls. All data are mean ± SD; statistical significance was determined by Student’s t test (*, P ≤ 0.05; **, P ≤ 0.01; ***, P ≤ 0.005).
Figure 9.
Figure 9.
Role of p53 and intrinsic apoptosis pathway in IFN-1–exposed HSCs. (A) Experimental design for HSC apoptosis and gene expression assays. (B) CC3 levels in WT, Trp53−/−, and BakBaxcKO HSCs treated for 12 h ± 100 ng/ml IFN-α (n = 3–4). Results are expressed as fold change relative to IFN-α control HSCs. (C and D) Quantitative RT-PCR analyses for Bcl2 family gene expression in (C) WT and (D) Ctrl and Trp53−/− HSCs treated for 12 h ± 100 ng/ml IFN-α (n = 3–4). Results are expressed as log2 fold expression relative to IFN-α controls. (E) Experimental design for in vivo BrdU incorporation analyses in HSCs from poly I:C–treated Ctrl, Trp53−/−, Foxo3a−/− mice. (F) Mean levels of BrdU incorporation in Trp53−/− (left) and Foxo3a−/− (right) mice compared with their respective Ctrl mice (3 mice/group). (G) Model for the role of p53 in IFN-1–exposed HSCs. All data are mean ± SD; statistical significance was determined by Student’s t test (*, P ≤ 0.05; **, P ≤ 0.01; ***, P ≤ 0.005).
Figure 10.
Figure 10.
Enforced proliferation in the presence of IFN-1s depletes HSCs. (A) Experimental design. 5-FU injections were performed after 0, 3, or 7 d of poly I:C treatment, or in the middle of a 7 + 7 d cycle of poly I:C treatment. (B) Kaplan-Meyer survival curve for 5-FU–injected poly I:C–treated mice (5–10 mice/group). Statistical significance was determined by the Mantel-Cox test (*, P ≤ 0.05). (C) Hematopoietic recovery in 5-FU–injected poly I:C–treated mice. Kinetics of white blood cell (WBC; left), platelet (Plt; middle), and RBC (right) recovery (5–10 mice/group). Data are mean ± SD; statistical significance was determined by Student’s t-test (*, P ≤ 0.05, day 0 vs. day 7 + 7; °°, P ≤ 0.05, day 0 vs. day 7; §, insufficient number of mice remaining for statistical analysis). (D and E) BM analysis of poly I:C–treated mice 10 d after 5-FU injection (4–5 mice/group). (D) BM cellularity (left) and Gr and B cells numbers (right). (E) HSC numbers. Data are mean ± SD; statistical significance was determined by Student’s t test (*, P ≤ 0.05; **, P ≤ 0.01). (F) Model for how quiescence reentry protects HSCs from IFN-1–induced apoptosis. HSCs are normally maintained in a quiescent state buffered from proapoptotic stimuli. IFN-1s rapidly force HSCs into the cell cycle (acute IFN-1s) due to transient relaxation of quiescence-enforcing mechanisms, where they are vulnerable to apoptosis. During chronic IFN-1 exposure (chronic IFN-1s) HSCs return to a quiescent state where they remain largely protected from IFN-1–induced apoptosis unless forced back into the cell cycle, where they activate a p53-dependent proapoptotic gene program.

Similar articles

Cited by

References

    1. Bakker S.T., Passegué E. 2013. Resilient and resourceful: genome maintenance strategies in hematopoietic stem cells. Exp. Hematol. 41:915–923 (Epub ahead of print) 10.1016/j.exphem.2013.09.007 - DOI - PMC - PubMed
    1. Baldridge M.T., King K.Y., Boles N.C., Weksberg D.C., Goodell M.A. 2010. Quiescent haematopoietic stem cells are activated by IFN-gamma in response to chronic infection. Nature. 465:793–797 10.1038/nature09135 - DOI - PMC - PubMed
    1. Brenet F., Kermani P., Spektor R., Rafii S., Scandura J.M. 2013. TGFβ restores hematopoietic homeostasis after myelosuppressive chemotherapy. J. Exp. Med. 210:623–639 10.1084/jem.20121610 - DOI - PMC - PubMed
    1. Castrillon D.H., Miao L., Kollipara R., Horner J.W., DePinho R.A. 2003. Suppression of ovarian follicle activation in mice by the transcription factor Foxo3a. Science. 301:215–218 10.1126/science.1086336 - DOI - PubMed
    1. Chen C., Liu Y., Liu Y., Zheng P. 2009. mTOR regulation and therapeutic rejuvenation of aging hematopoietic stem cells. Sci. Signal. 2:ra75. - PMC - PubMed

MeSH terms

Substances