. 2014 Jun;21(6):864-75.
doi: 10.1038/cdd.2014.4. Epub 2014 Jan 31.

High sphingomyelin levels induce lysosomal damage and autophagy dysfunction in Niemann Pick disease type A

Affiliations

High sphingomyelin levels induce lysosomal damage and autophagy dysfunction in Niemann Pick disease type A

E Gabandé-Rodríguez et al. Cell Death Differ. 2014 Jun.

Abstract

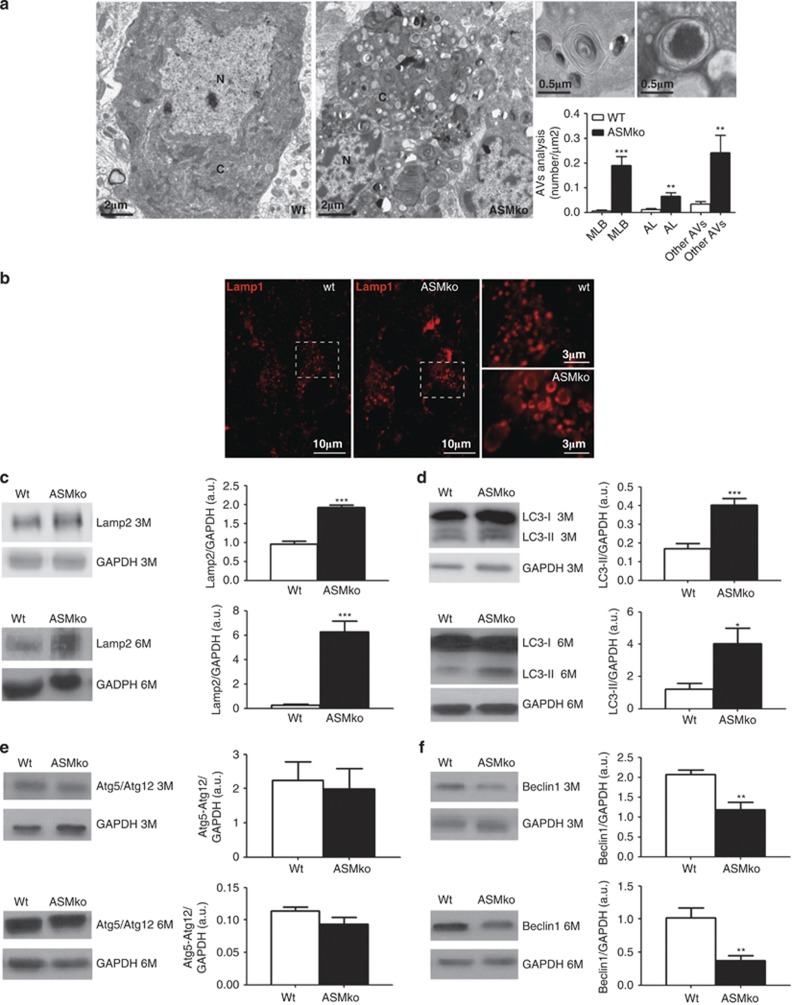
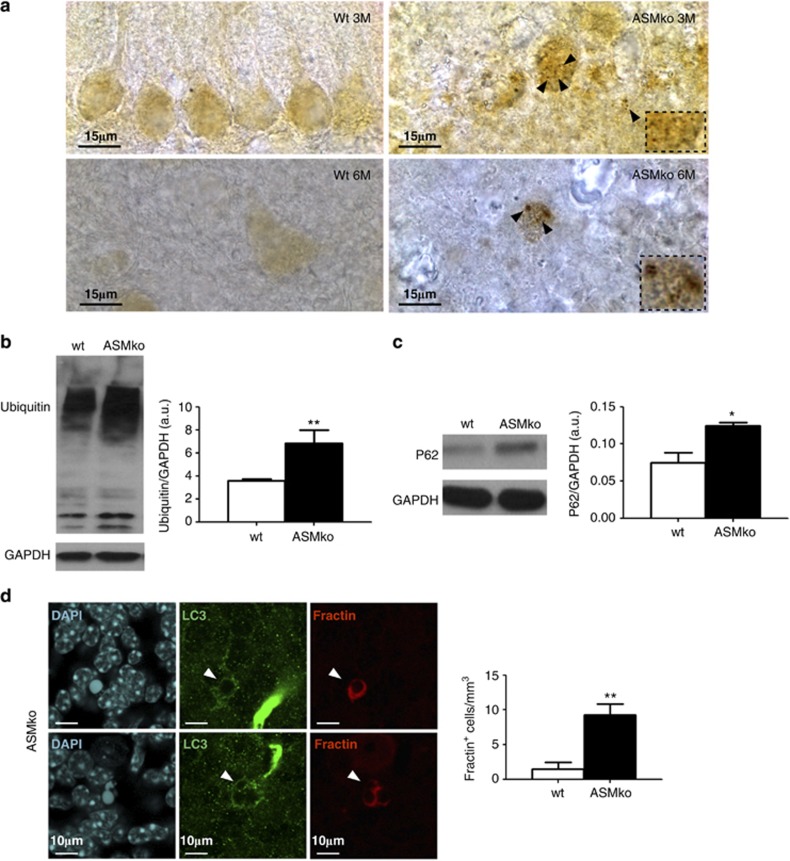
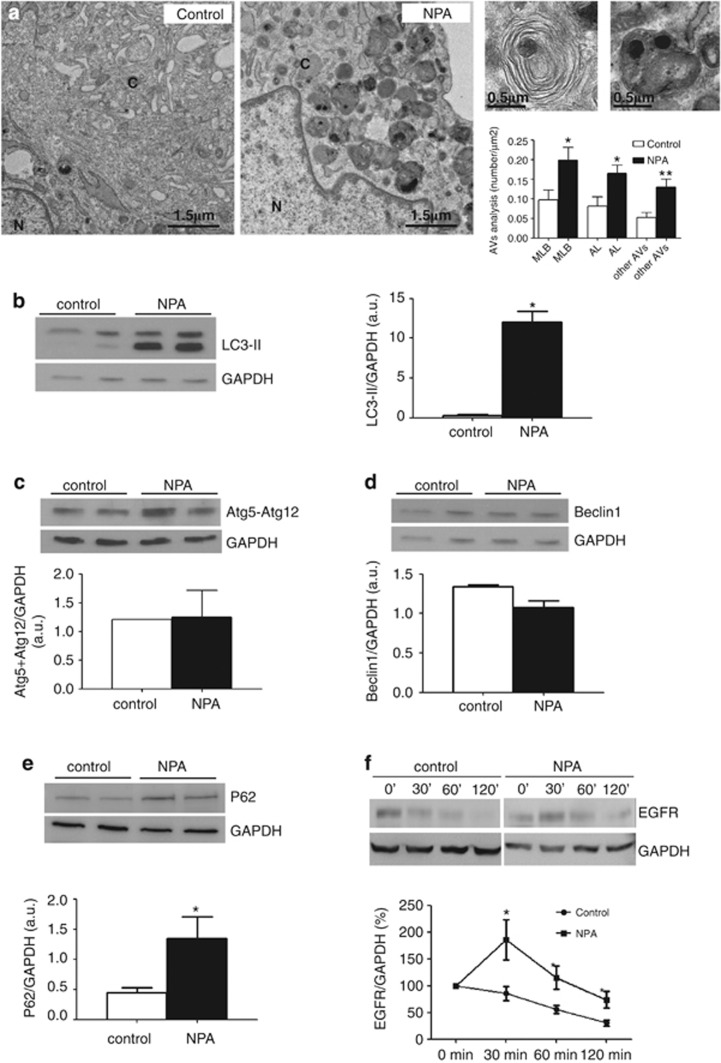
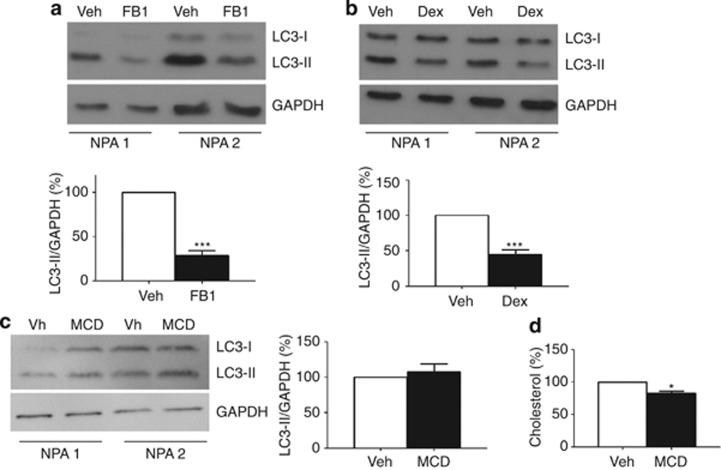
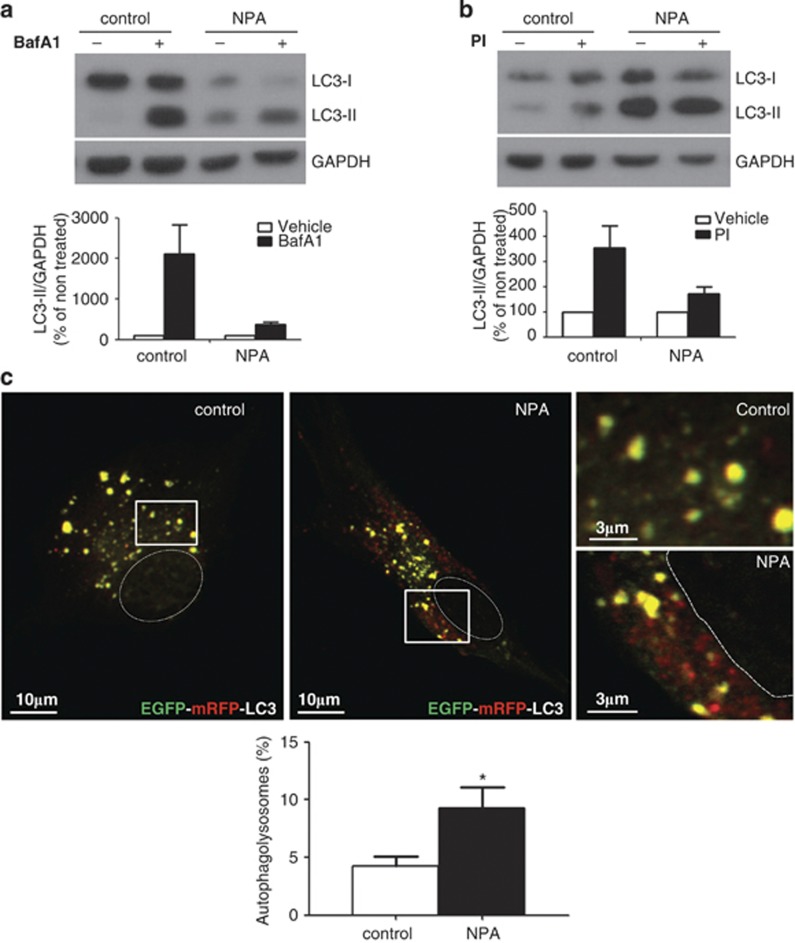
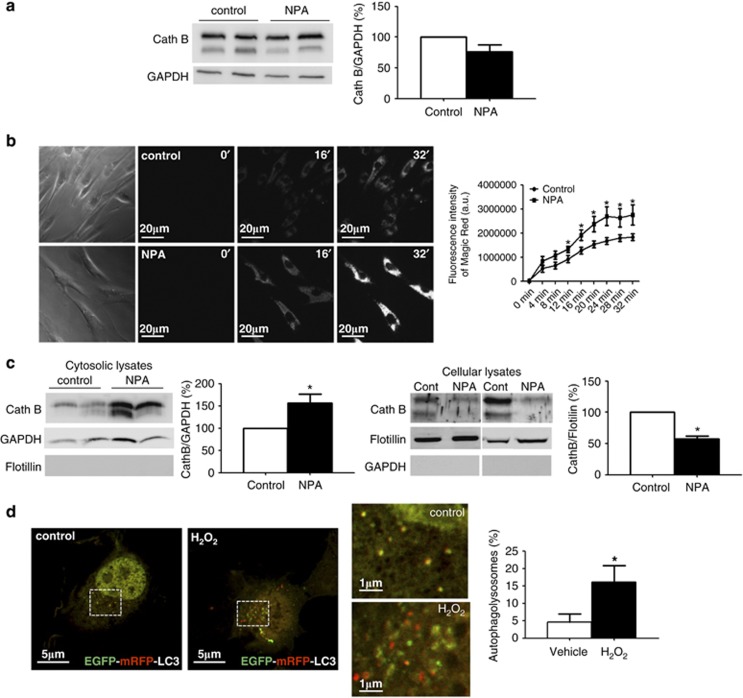
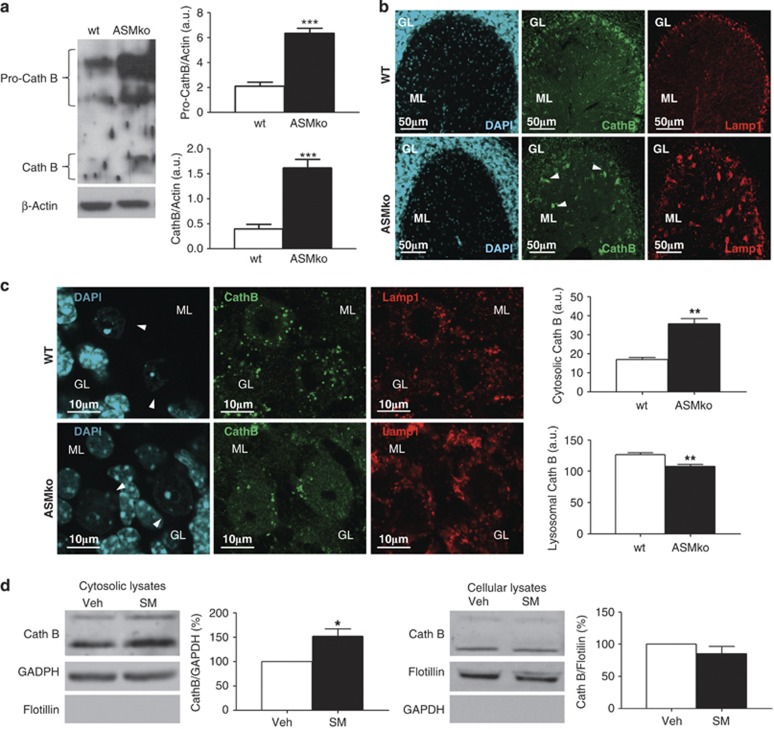
Niemann Pick disease type A (NPA), which is caused by loss of function mutations in the acid sphingomyelinase (ASM) gene, is a lysosomal storage disorder leading to neurodegeneration. Yet, lysosomal dysfunction and its consequences in the disease are poorly characterized. Here we show that undegraded molecules build up in neurons of acid sphingomyelinase knockout mice and in fibroblasts from NPA patients in which autophagolysosomes accumulate. The latter is not due to alterations in autophagy initiation or autophagosome-lysosome fusion but because of inefficient autophago-lysosomal clearance. This, in turn, can be explained by lysosomal membrane permeabilization leading to cytosolic release of Cathepsin B. High sphingomyelin (SM) levels account for these effects as they can be induced in control cells on addition of the lipid and reverted on SM-lowering strategies in ASM-deficient cells. These results unveil a relevant role for SM in autophagy modulation and characterize autophagy anomalies in NPA, opening new perspectives for therapeutic interventions.


Figures

Figure 1
Figure 1
Autophagy alterations in ASMko mice cerebellum. (a) Electron micrographs from 3-month-old wt and ASMko mice cerebellum. Insets show multilamellar bodies (MLBs) and membrane-bound autophagosomal-like (AL) structures with cytoplasmic contents in ASMko cerebellum. Graph shows quantification of MLBs, AL structures and other autophagic vacuoles (AVs) as mean±S.D. of the number of each type of structure per area unit (n=15 Purkinje cells from each of two mice per genotype, PMLB=0.0009; PAL=0.01; PAV=0.0013). (b) Lamp1 immunostaining of cerebellar tissue from 3-month-old wt and ASMko mice. Insets show higher magnification images of lysosomes. (cf) Western blots of cerebellar extracts from 3- and 6-month-old wt and ASMko littermates using antibodies against Lamp2 (c), LC3 (recognizing LC3-I and II) (d), Atg5-Atg12 complex (e) and Beclin 1 (f). Graphs show means±S.D. normalized to GAPDH (n=7, PLamp2 <0.0001(3 M) and PLamp2 <0.0001 (6 M); PLC3-II=0.0004 (3 M) and PLC3-II=0.0153 (6 M); PBeclin1=0.0015 (3 M) and PBeclin1=0.0014 (6 M))
Figure 2
Figure 2
Deficient protein degradation and increased cell death in ASMko mice cerebellum. (a) Ubiquitin immunostaining in wt and ASMko mice cerebellum at 3 and 6 months of age. Black arrows and magnified insets show ubiquitinated protein aggregates. (b and c) Levels of ubiquitin (b) and p62 (c) in cerebellar extracts from 6-month-old wt and ASMko littermates. Graphs show mean±S.D. normalized to GAPDH (n=7, Pubiquitin=0.0217, Pp62=0.0199). (d) Two examples of immunostaining for LC3 and Fractin in 3-month-old ASMko mice cerebellum. Nuclei were labeled with DAPI. Intense green staining corresponds to cross-reactivity of the LC3 antibody with blood vessels. Graph shows means±S.D. of Fractin-positive cells in ASMko compared with wt cerebellum (n=6, P=0.029)
Figure 3
Figure 3
SM addition induces autophagy alterations in cultured neurons. (a) Lysenin staining of 12 days in vitro-cultured hippocampal neurons from wt mice treated (SM) or not (vehicle) with SM. Graph shows mean±S.D. of lysenin-associated fluorescence per area unit in neurites as % with respect to nontreated neurons (n=3, P=0.046). (b and c) LC3 and ubiquitinated protein levels in extracts from control and SM-treated hippocampal neurons. Graphs show mean±S.D. normalized to GAPDH (n=3, PLC3-II=0.019, Pubiquitin=0.043)
Figure 4
Figure 4
Autophagy alterations in fibroblasts derived from NPA patients. (a) Electron micrographs from control and NPA fibroblasts. Insets show multilamellar bodies (MLBs) and membrane-bound structures with cytoplasmic contents found in NPA fibroblasts. Graph shows quantification of MLBs, autophagosome-like (AL) structures and other autophagic vacuoles (AVs) as mean±S.D. of the number of each type of structure per area unit (n=20 cells, PMLB=0.0161, PAL=0.0131, PAV=0.009). (be) Western blots of control and NPA fibroblast extracts using antibodies against LC3 (b), Atg5-Atg12 complex (c), Beclin 1 (d) and p62 (e). Graphs show means±S.D. normalized to GAPDH (n=3, PLC3-II=0.0137, Pp62=0.011). (f) EGFR levels in extracts from control and NPA fibroblasts treated with EGF for the indicated times. Graph shows mean±S.D. of the % of EGFR levels normalized to GAPDH considering 100% the values obtained at time 0 (n=3, P30m=0.016, P60m=0.036, P120m=0.041)
Figure 5
Figure 5
Reduction of SM levels prevents autophagy alterations. (ac) LC3 levels in extracts from two lines of NPA fibroblasts treated or not with FB1 (a), dexamethasone (b) or methyl-β-cyclodextrin (c). Graphs show mean±S.D normalized to GAPDH (n=3, PFB1=0.0001, PDex<0.0001). (d) Graph shows mean±S.D. of cholesterol levels in NPA fibroblasts treated with methyl-β-cyclodextrin compared with those nontreated considered 100% (n=3, P=0.021)
Figure 6
Figure 6
Blockage of the autophagy flux without alterations in autophagosome–lysosome fusion in NPA fibroblasts. (a and b) LC3 levels in extracts from control and NPA fibroblasts treated or not with BaFA1 (a) or protease inhibitors (b). Graphs show mean±S.D. of the percentage of LC3-II levels normalized to GAPDH referred to nontreated conditions that were considered 100%. (c) Control and NPA fibroblasts expressing mRFP-EGFP-LC3. Ellipses indicate cell nuclei. Graph shows mean value±S.D. of the percentage of only red structures corresponding to autophagolysosomes per cell (n=20 cells in each of three different cultures; P=0.031)
Figure 7
Figure 7
Cathepsin B cytosolic release and LMP in NPA fibroblasts. (a) Cathepsin B levels in extracts from two control and two NPA fibroblast lines. Graph shows mean±S.D. of Cathepsin B levels (the two corresponding bands were quantified) normalized to GAPDH (n=3). (b) Phase contrast and fluorescence images from control and NPA fibroblasts at different times after treatment with Magic Red peptide. Graph shows mean±S.D. of the fluorescence associated to the peptide upon cleavage with Cathepsin B (n=5 cells in each of nine cultures, P4m=0.191, P8m=0.069, P12m=0.05, P16m=0.022, P20m=0.027, P24m=0.024, P28m=0.049, P32m=0.049). (c) Cathepsin B levels in cytosolic and cellular lysates of digitonin-extracted control and NPA fibroblast lines. GADPH and Flotillin, as cytosolic and membrane markers, respectively, were used to monitor the success in the isolation of the cytosol. Graphs show mean±S.D. normalized to GADPH or Flotillin (n=3, Pcyt=0.038, Pcell=0.0129). (d) HeLa cells expressing mRFP-EGFP-LC3 treated or not with H2O2. Graph shows mean value±S.D of the percentage of only red structures corresponding to autophagolysosomes per cell (n=20 cells in each of three different cultures; P=0.039)
Figure 8
Figure 8
Cathepsin B levels and distribution in the cerebellum of ASMko mice. (a) Levels of Cathepsin B (in its immature (pro-cathepsin B bands) and mature/active forms) and of β-actin in cerebellar extracts from 6-month-old wt and ASMko littermates. Graphs show mean±S.D. normalized to β-actin (n=8, Ppro-CathB<0.0001, PCathB<0.0001). (b) Double staining with antibodies against Cathepsin B and Lamp1 of Purkinje cells in the granular layer (GL) and of glial cells in the molecular layer (ML) of ASMko and wt mice cerebellum. Nuclei were labeled with DAPI. Arrows indicate examples of glial cells in the ASMko cerebellum with high Cathepsin B expression levels colocalizing with Lamp1. (c) Double staining with antibodies against Cathepsin B and Lamp1 in Purkinje cells (shown by white arrows) of ASMko and wt mouse. Nuclei were labeled with DAPI. Graphs show mean±S.D. of Cathepsin B staining in cytosol or in lysosomes (colocalizing with Lamp1) per area unit (Pcyt=0.0013, Plys=0.0034). (d) Cathepsin B levels in cytosolic and cellular lysates of digitonin-extracted primary neurons from wt mice treated or not with SM. Graphs show mean±S.D. normalized to GADPH or to Flotillin (n=4, Pcyt=0.0358)

Similar articles

Cited by

References

    1. Platt FM, Boland B, van der Spoel AC. The cell biology of disease: lysosomal storage disorders: the cellular impact of lysosomal dysfunction. J Cell Biol. 2012;199:723–734. - PMC - PubMed
    1. Lieberman AP, Puertollano R, Raben N, Slaugenhaupt S, Walkley SU, Ballabio A. Autophagy in lysosomal storage disorders. Autophagy. 2012;8:719–730. - PMC - PubMed
    1. Mizushima N, Levine B, Cuervo AM, Klionsky DJ. Autophagy fights disease through cellular self-digestion. Nature. 2008;451:1069–1075. - PMC - PubMed
    1. Boya P, Reggiori F, Codogno P. Emerging regulation and functions of autophagy. Nat Cell Biol. 2013;15:713–720. - PMC - PubMed
    1. Brady RO, Kanfer JN, Mock MB, Fredrickson DS. The metabolism of sphingomyelin. II. Evidence of an enzymatic deficiency in Niemann-Pick diseae. Proc Natl Acad Sci USA. 1966;55:366–369. - PMC - PubMed

Publication types