Quantifying size and number of adipocytes in adipose tissue
- PMID: 24480343
- PMCID: PMC4069255
- DOI: 10.1016/B978-0-12-411619-1.00006-9
Quantifying size and number of adipocytes in adipose tissue
Abstract
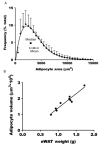
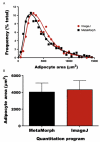
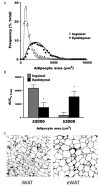
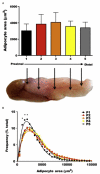
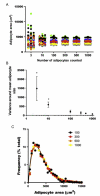
White adipose tissue (WAT) is a dynamic and modifiable tissue that develops late during gestation in humans and through early postnatal development in rodents. WAT is unique in that it can account for as little as 3% of total body weight in elite athletes or as much as 70% in the morbidly obese. With the development of obesity, WAT undergoes a process of tissue remodeling in which adipocytes increase in both number (hyperplasia) and size (hypertrophy). Metabolic derangements associated with obesity, including type 2 diabetes, occur when WAT growth through hyperplasia and hypertrophy cannot keep pace with the energy storage needs associated with chronic energy excess. Accordingly, hypertrophic adipocytes become overburdened with lipids, resulting in changes in the secreted hormonal milieu. Lipids that cannot be stored in the engorged adipocytes become ectopically deposited in organs such as the liver, muscle, and pancreas. WAT remodeling therefore coincides with obesity and secondary metabolic diseases. Obesity, however, is not unique in causing WAT remodeling: changes in adiposity also occur with aging, calorie restriction, cancers, and diseases such as HIV infection. In this chapter, we describe a semiautomated method of quantitatively analyzing the histomorphometry of WAT using common laboratory equipment. With this technique, the frequency distribution of adipocyte sizes across the tissue depot and the number of total adipocytes per depot can be estimated by counting as few as 100 adipocytes per animal. In doing so, the method described herein is a useful tool for accurately quantifying WAT development, growth, and remodeling.
Keywords: Adipocytes; Cell number; Cell size; ImageJ; Metamorph; Quantitative histomorphometry.
© 2014 Elsevier Inc. All rights reserved.
Figures


Similar articles
-
A PDGFRα-Mediated Switch toward CD9high Adipocyte Progenitors Controls Obesity-Induced Adipose Tissue Fibrosis.Cell Metab. 2017 Mar 7;25(3):673-685. doi: 10.1016/j.cmet.2017.01.010. Epub 2017 Feb 16. Cell Metab. 2017. PMID: 28215843
-
Prostaglandin E2 Exerts Multiple Regulatory Actions on Human Obese Adipose Tissue Remodeling, Inflammation, Adaptive Thermogenesis and Lipolysis.PLoS One. 2016 Apr 28;11(4):e0153751. doi: 10.1371/journal.pone.0153751. eCollection 2016. PLoS One. 2016. PMID: 27124181 Free PMC article.
-
Increased infiltration of macrophages in omental adipose tissue is associated with marked hepatic lesions in morbid human obesity.Diabetes. 2006 Jun;55(6):1554-61. doi: 10.2337/db06-0133. Diabetes. 2006. PMID: 16731817
-
Contribution of adipogenesis to healthy adipose tissue expansion in obesity.J Clin Invest. 2019 Oct 1;129(10):4022-4031. doi: 10.1172/JCI129191. J Clin Invest. 2019. PMID: 31573549 Free PMC article. Review.
-
Weighing in on adipocyte precursors.Cell Metab. 2014 Jan 7;19(1):8-20. doi: 10.1016/j.cmet.2013.10.003. Epub 2013 Nov 14. Cell Metab. 2014. PMID: 24239569 Free PMC article. Review.
Cited by
-
Secreted Protein Acidic and Rich in Cysteine (Sparc) KO Leads to an Accelerated Ageing Phenotype Which Is Improved by Exercise Whereas SPARC Overexpression Mimics Exercise Effects in Mice.Metabolites. 2022 Jan 28;12(2):125. doi: 10.3390/metabo12020125. Metabolites. 2022. PMID: 35208200 Free PMC article.
-
BATF3 Protects Against Metabolic Syndrome and Maintains Intestinal Epithelial Homeostasis.Front Immunol. 2022 Jun 22;13:841065. doi: 10.3389/fimmu.2022.841065. eCollection 2022. Front Immunol. 2022. PMID: 35812447 Free PMC article.
-
Lipedema stage affects adipocyte hypertrophy, subcutaneous adipose tissue inflammation and interstitial fibrosis.Front Immunol. 2023 Jul 28;14:1223264. doi: 10.3389/fimmu.2023.1223264. eCollection 2023. Front Immunol. 2023. PMID: 37575263 Free PMC article.
-
Ferritin regulates organismal energy balance and thermogenesis.Mol Metab. 2019 Jun;24:64-79. doi: 10.1016/j.molmet.2019.03.008. Epub 2019 Mar 21. Mol Metab. 2019. PMID: 30954544 Free PMC article.
-
Effects of Different Concentrations of Ganpu Tea on Fecal Microbiota and Short Chain Fatty Acids in Mice.Nutrients. 2021 Oct 22;13(11):3715. doi: 10.3390/nu13113715. Nutrients. 2021. PMID: 34835972 Free PMC article.
References
-
- Ailhaud G, Grimaldi P, Negrel R. Cellular and molecular aspects of adipose tissue development. Annual Review of Nutrition. 1992;12:207–233. http://dx.doi.org/10.1146/annurev.nu.12.070192.001231. - DOI - PubMed
-
- Bjorndal B, Burri L, Staalesen V, Skorve J, Berge RK. Different adipose depots: Their role in the development of metabolic syndrome and mitochondrial response to hypolipidemic agents. Journal of Obesity. 2011;2011:490650. http://dx.doi.org/10.1155/2011/490650. - DOI - PMC - PubMed
-
- Bjornheden T, Jakubowicz B, Levin M, Oden B, Eden S, Sjostrom L, et al. Computerized determination of adipocyte size. Obesity Research. 2004;12(1):95–105. http://dx.doi.org/10.1038/oby.2004.13. - DOI - PubMed
-
- Bradshaw AD, Graves DC, Motamed K, Sage EH. SPARC-null mice exhibit increased adiposity without significant differences in overall body weight. Proceedings of the National Academy of Sciences of the United States of America. 2003;100(10):6045–6050. http://dx.doi.org/10.1073/pnas.1030790100, PII: 1030790100. - DOI - PMC - PubMed
-
- Brochu M, Tchernof A, Dionne IJ, Sites CK, Eltabbakh GH, Sims EA, et al. What are the physical characteristics associated with a normal metabolic profile despite a high level of obesity in postmenopausal women? The Journal of Clinical Endocrinology and Metabolism. 2001;86(3):1020–1025. - PubMed
Publication types
MeSH terms
Substances
Grants and funding
LinkOut - more resources
Full Text Sources
Other Literature Sources

