. 2014 Feb 6;506(7486):52-7.
doi: 10.1038/nature12988. Epub 2014 Jan 29.

In vivo discovery of immunotherapy targets in the tumour microenvironment

Affiliations

In vivo discovery of immunotherapy targets in the tumour microenvironment

Penghui Zhou et al. Nature. .

Abstract

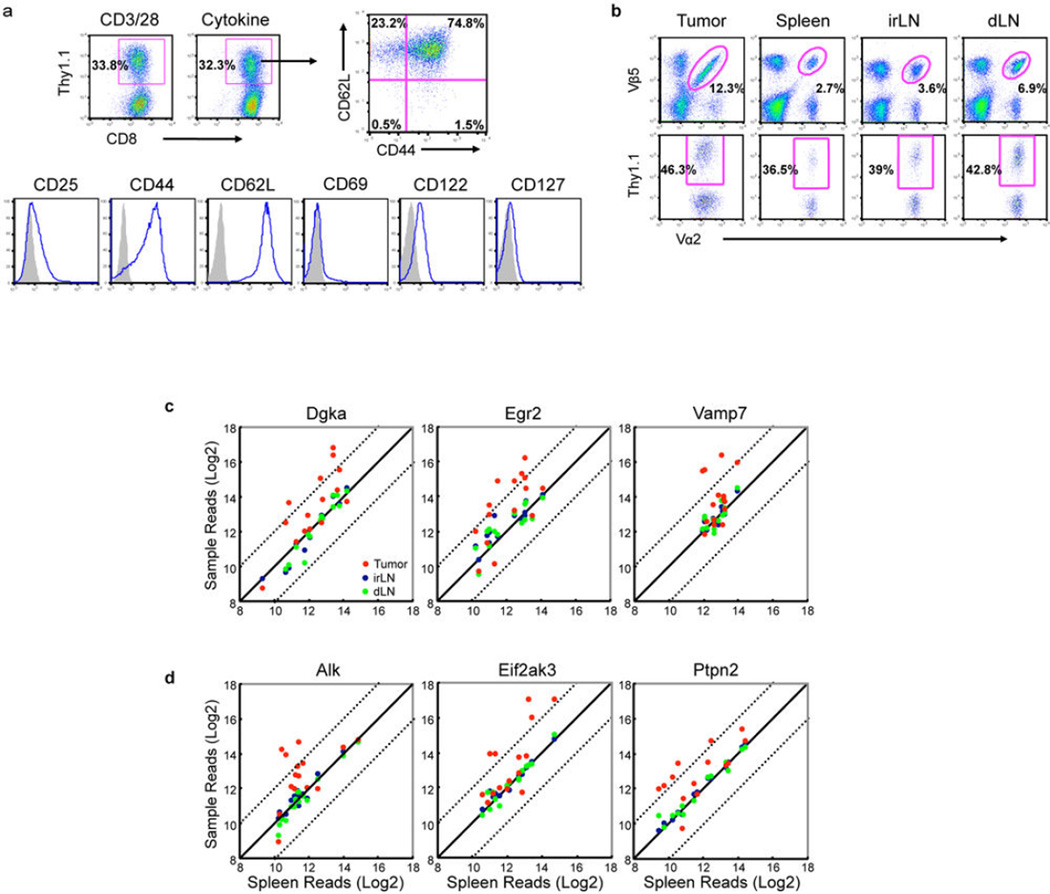
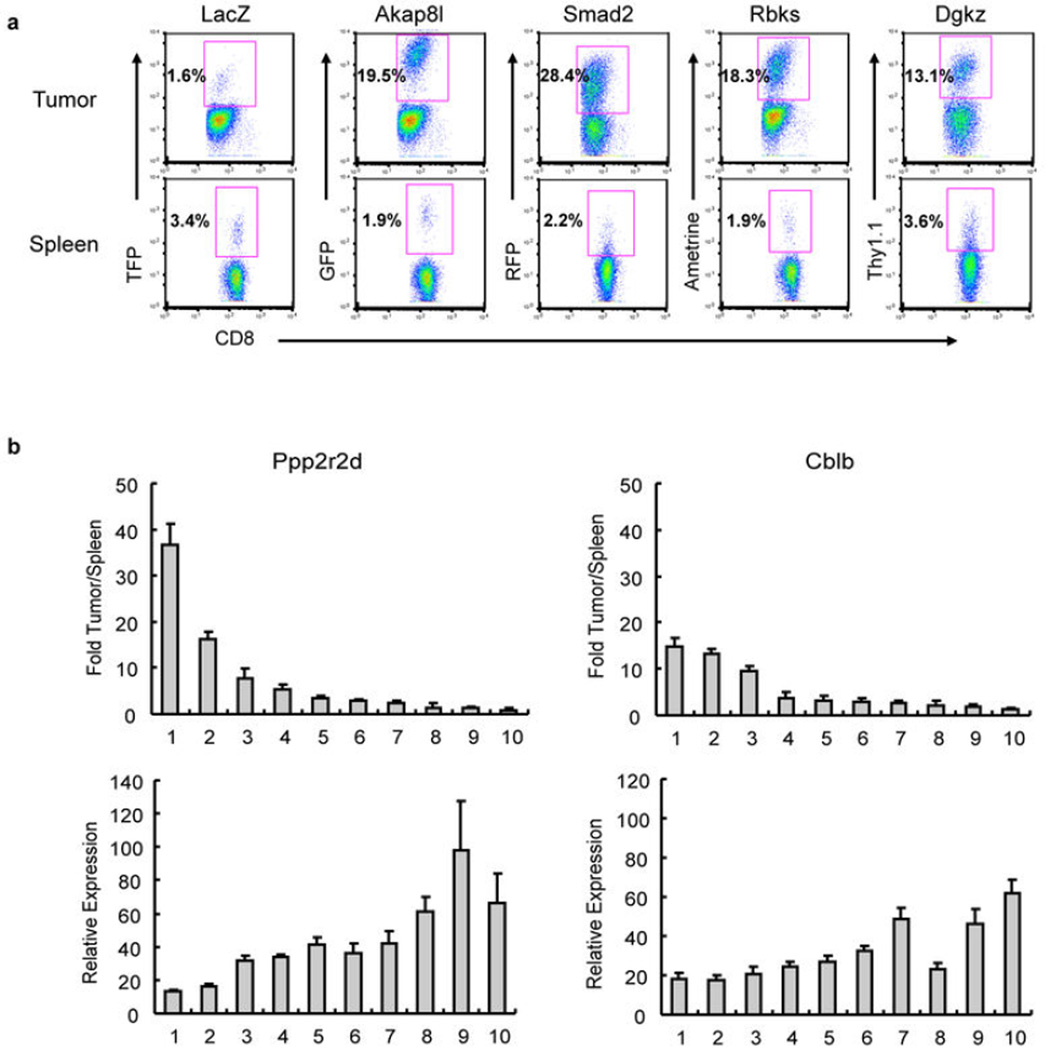
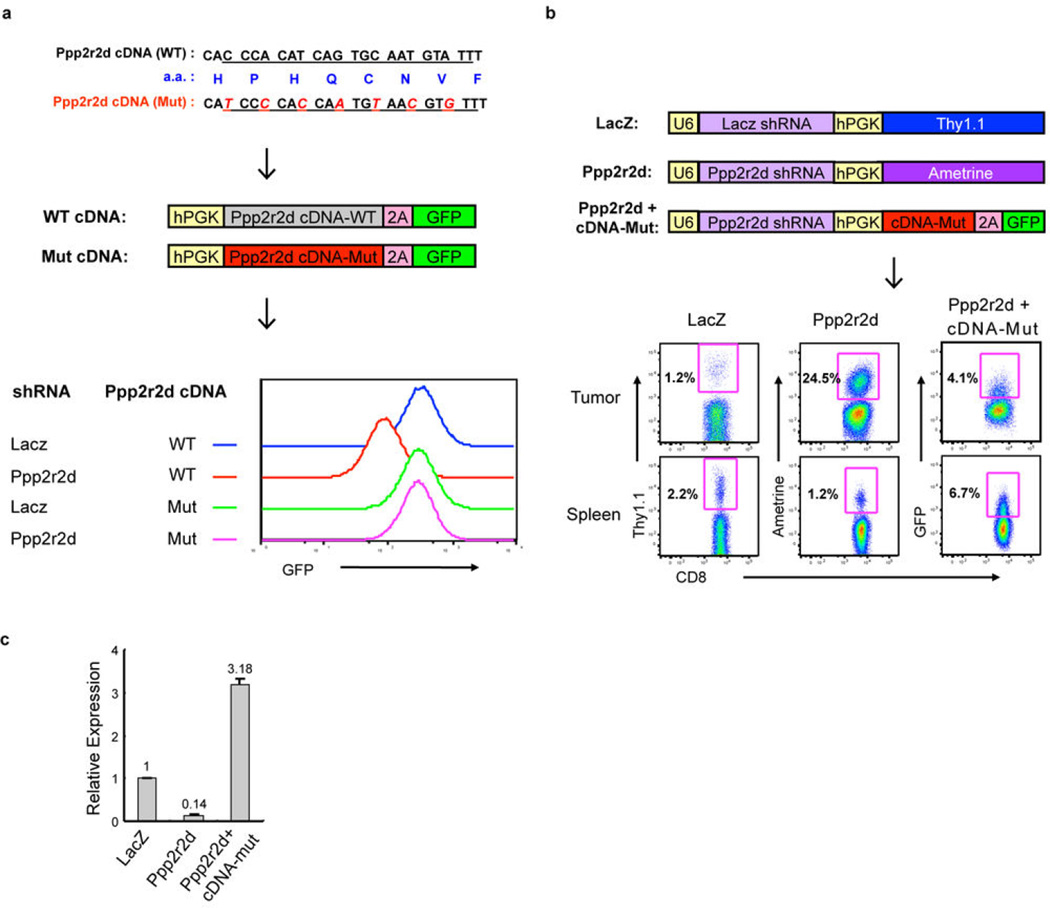
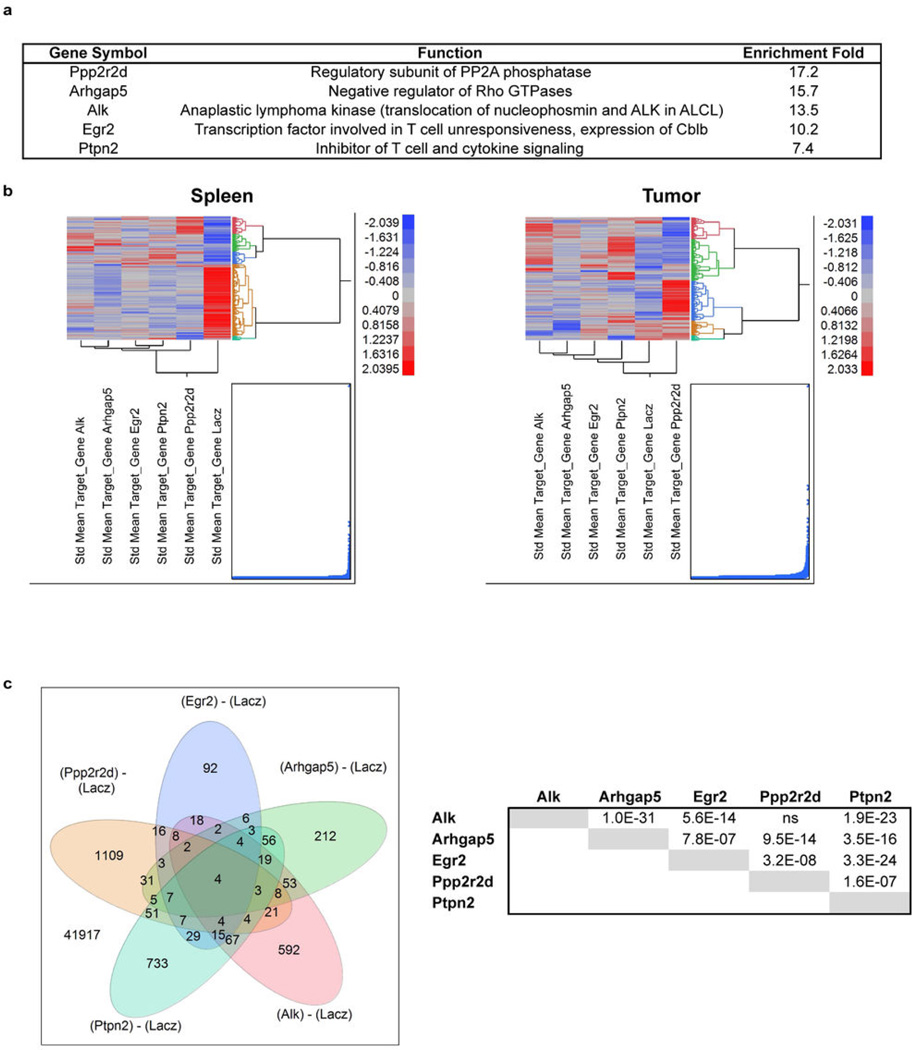
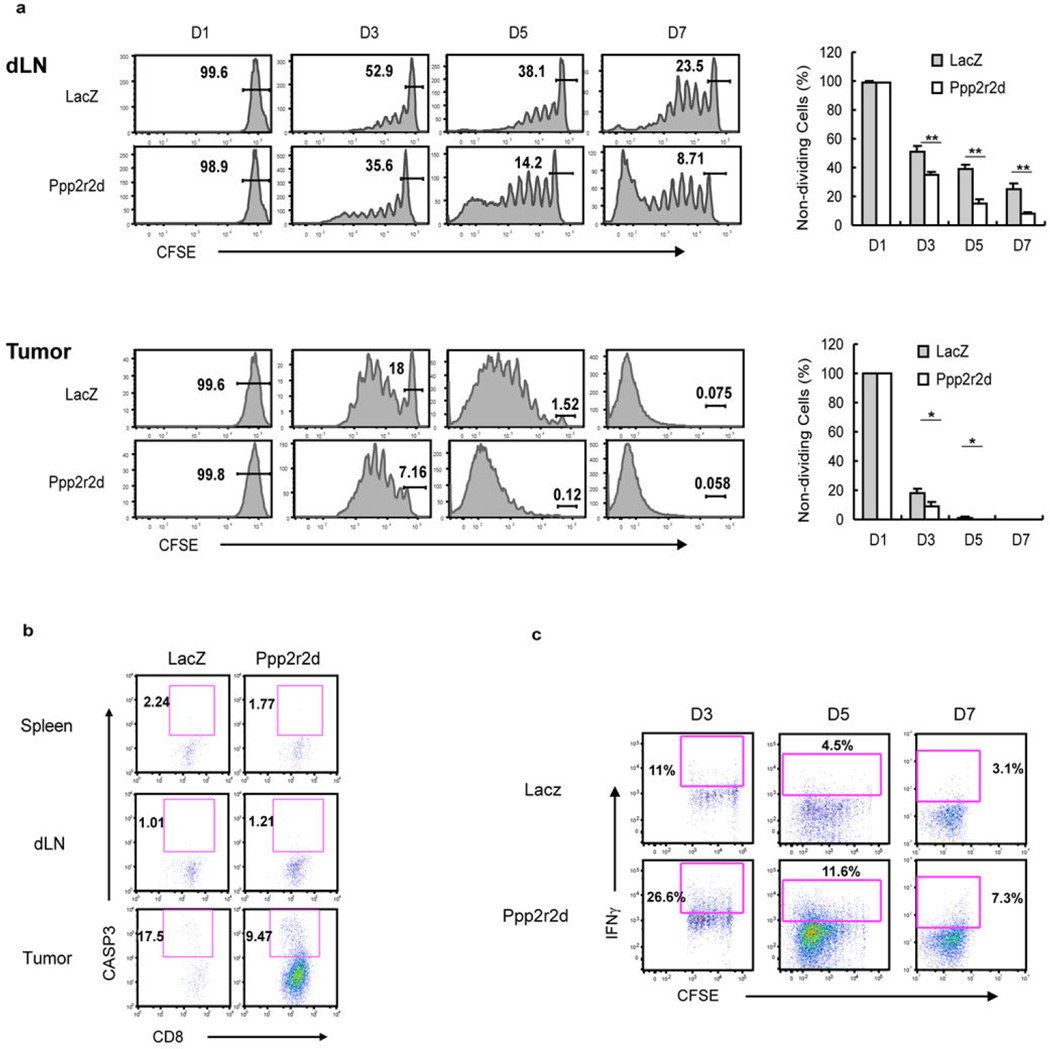
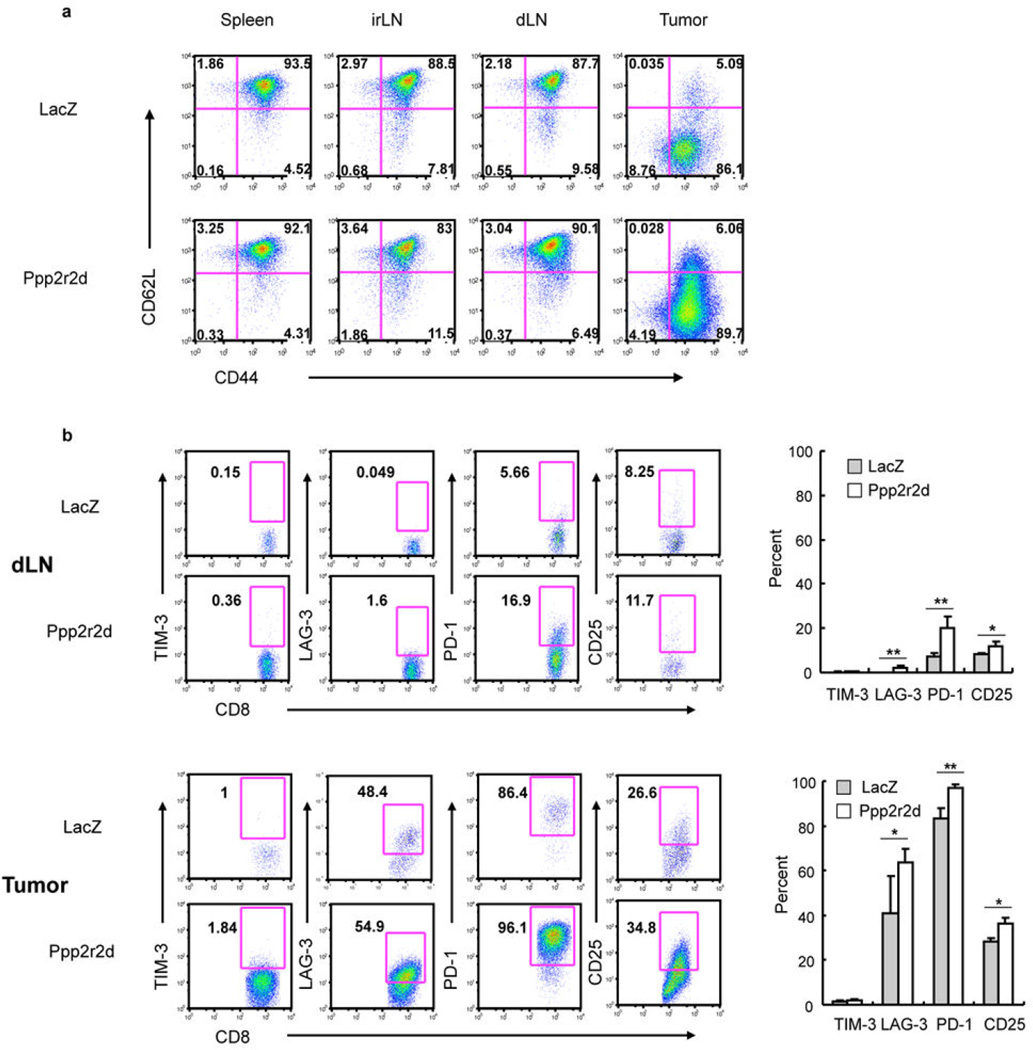
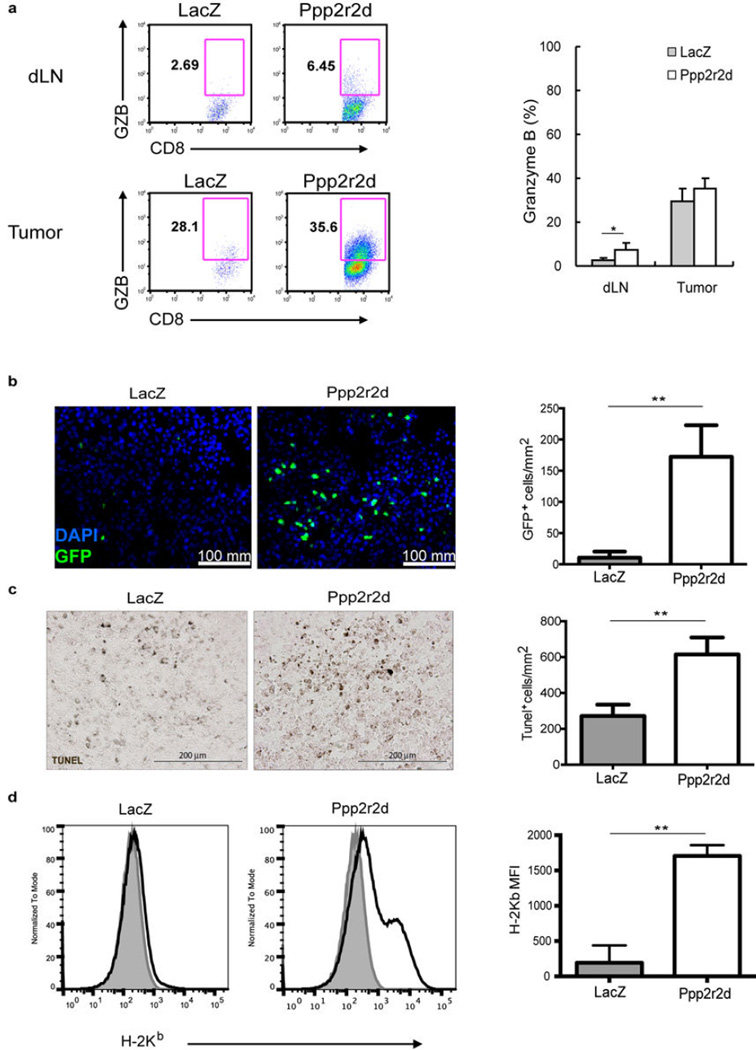
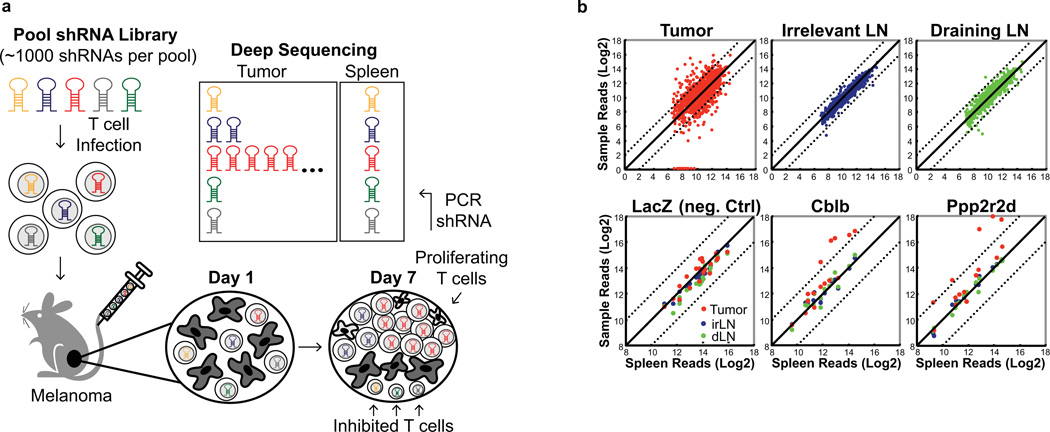
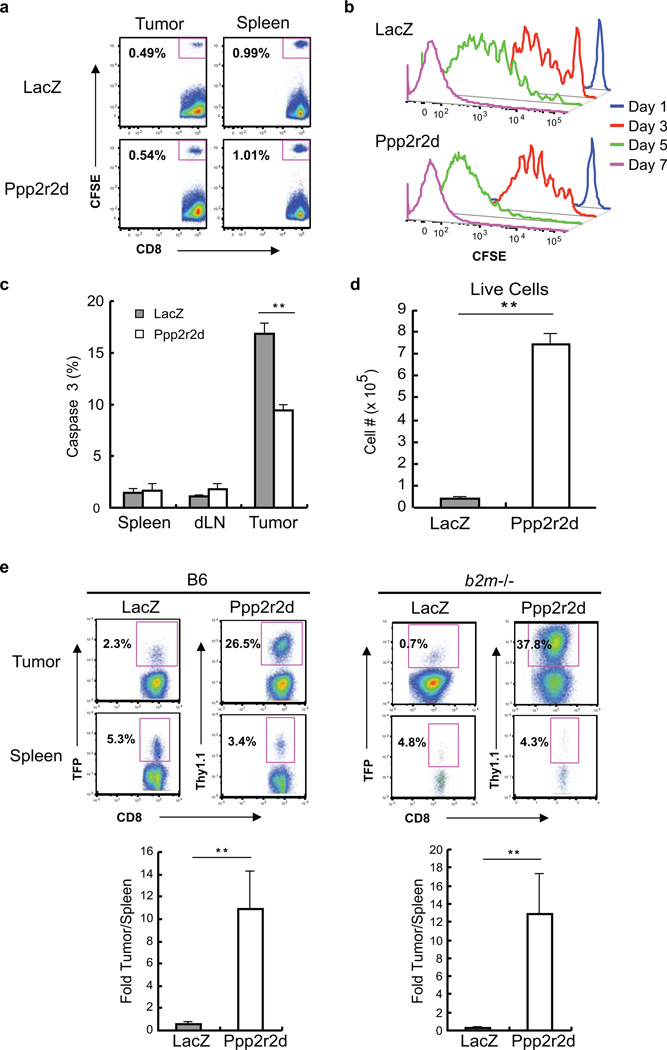
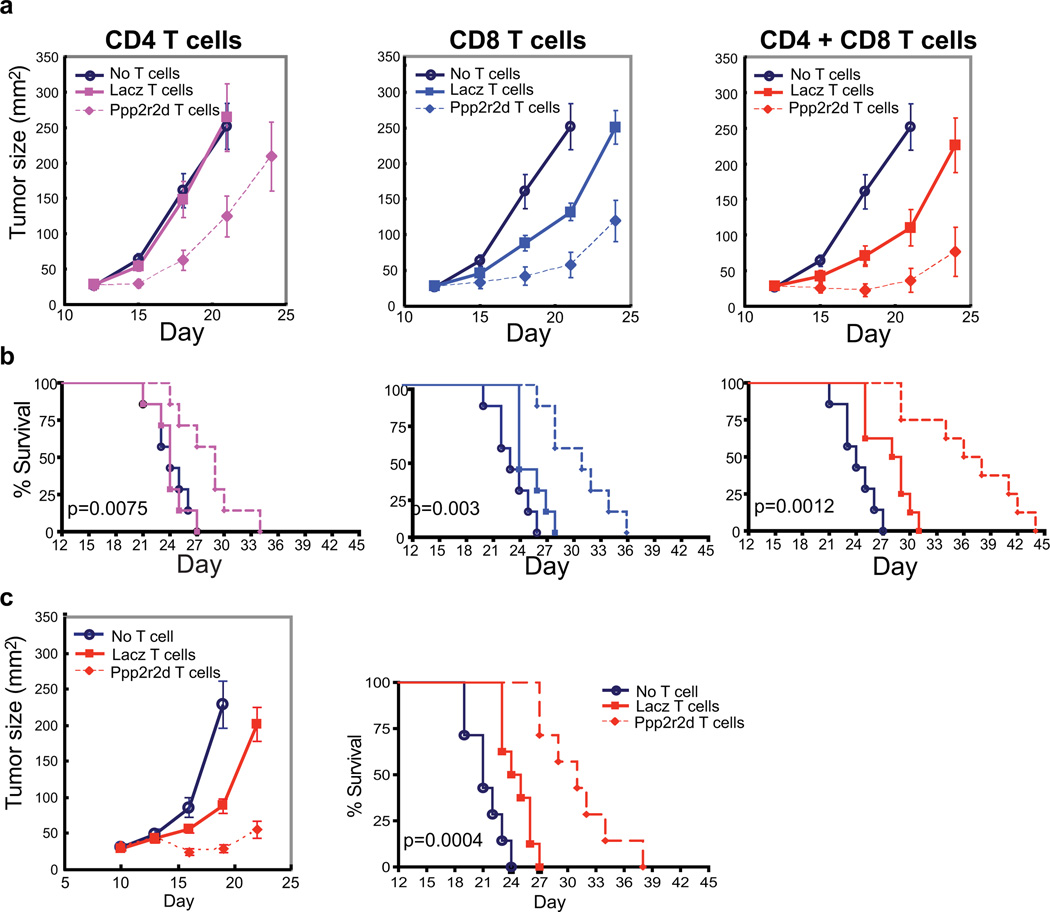
Recent clinical trials showed that targeting of inhibitory receptors on T cells induces durable responses in a subset of cancer patients, despite advanced disease. However, the regulatory switches controlling T-cell function in immunosuppressive tumours are not well understood. Here we show that such inhibitory mechanisms can be systematically discovered in the tumour microenvironment. We devised an in vivo pooled short hairpin RNA (shRNA) screen in which shRNAs targeting negative regulators became highly enriched in murine tumours by releasing a block on T-cell proliferation upon tumour antigen recognition. Such shRNAs were identified by deep sequencing of the shRNA cassette from T cells infiltrating tumour or control tissues. One of the target genes was Ppp2r2d, a regulatory subunit of the PP2A phosphatase family. In tumours, Ppp2r2d knockdown inhibited T-cell apoptosis and enhanced T-cell proliferation as well as cytokine production. Key regulators of immune function can therefore be discovered in relevant tissue microenvironments.


Figures

Extended Data Figure 1
Extended Data Figure 1. In vivo RNAi screening procedure
a, Infection of CD8+ T cells from Rag1−/−/OT-I TCR transgenic mice with shRNA pools. T cells were either activated with anti-CD3/CD28 beads or exposed to recombinant murine IL-7/IL-15 for 48 hours. T cells were then infected with a LacZ control shRNA lentiviral vector and cultured for an additional three days. Transduction efficiency was determined based on expression of the Thy1.1 reporter encoded by the lentiviral vector. Cytokine-cultured T cells expressing the LacZ control shRNA were then stained with a panel of activation markers (blue lines; isotype control, shaded). The majority of infected T cells exhibited a central memory phenotype (CD62L+CD44+). b, Representative flow cytometry plots of OT-I T cells sorted from tumors and secondary lymphoid organs for deep sequencing analysis (dLN, tumor-draining lymph node; irLN, irrelevant lymph node). CD8+Vα2+Vβ5+Thy1.1+ cells were sorted and genomic DNA was extracted for PCR amplification of the shRNA cassette. c, Deep sequencing results from T cell dysfunction screen. shRNA sequencing reads for genes positive in secondary screen are plotted in comparison to spleen for tumors (red), irrelevant lymph nodes (irLN, blue) and tumor-draining lymph nodes (dLN, green), with dashed lines indicating a deviation of log2 from the diagonal. Data show enrichment of particular shRNAs representing these genes in tumors compared to spleens or lymph nodes. d, Deep sequencing results from kinase and phosphatase screen, as described in (c).
Extended Data Figure 2
Extended Data Figure 2. Validation of shRNAs from in vivo RNAi screen
a, FACS-based analysis of T cell enrichment in tumors. Positive shRNAs from deep sequencing analysis were cloned into vectors driving expression of one of four distinct fluorescent proteins (TFP, GFP, RFP, Ametrine) or Thy1.1. OT-I T cells were transduced with shRNA vectors and the five populations of T cells (normalized for transduction efficiency) were co-injected into B16-Ova tumor-bearing mice. T cells were isolated from tumors and spleens on day 7, and the percentage of reporter-positive CD8+Vα2+Vβ5+ T cells was determined by flow cytometry. b, FACS analysis of T cell enrichment in tumors compared to spleen (as described above) for cells expressing a panel of Ppp2r2d or Cblb shRNAs (upper panels). Also, Ppp2r2d and Cblb mRNA levels were measured by qPCR prior to T cell transfer (lower panels). The strongest T cell enrichment in tumors was observed for shRNAs with >80% knock-down efficiency at the mRNA level (shRNAs #1 and 2 for both Ppp2r2d and Cblb). Data represent biological replicates (n=3), each value represents mean +/− s.d.
Extended Data Figure 3
Extended Data Figure 3. Specificity of Ppp2r2d shRNA
a, Generation of mutant Ppp2r2d cDNA with wild-type protein sequence but disrupted shRNA binding site. Both mutant and wild-type Ppp2r2d cDNAs were cloned into a modified pLKO.3G vector with a 2A peptide ribosomal skip sequence and GFP. This approach resulted in stoichiometric expression of Ppp2r2d protein and GFP in EL4 thymoma cells. GFP-expressing EL4 cells were sorted to purity and transduced with LacZ or Ppp2r2d shRNA vectors expressing a Thy1.1 reporter. shRNA-transduced (Thy1.1+) cells were analyzed by flow cytometry for GFP expression. The Ppp2r2d shRNA reduced GFP levels when wild-type Ppp2r2d cDNA, but not when mutant Ppp2r2d cDNA was co-expressed. b, Expression of Ppp2r2d mutant cDNA prevents phenotype induced by Ppp2r2d shRNA. OT-I T cells were transduced with a vector encoding LacZ shRNA, Ppp2r2d shRNA or Ppp2r2d shRNA plus mutant Ppp2r2d cDNA. The different cell populations were normalized for transduction efficiency and co-injected into B16-Ova tumor-bearing mice. The percentage of each T cell population in tumors and spleens was quantified by gating on CD8+Vα2+Vβ5+ T cells; transduced cells were detected based on expression of Thy1.1 or Ametrine/GFP fluorescent reporters (representative data from 2 independent experiments, n=3 mice per experiment). c, qPCR analysis for Ppp2r2d expression in OT-I T cells transduced with LacZ shRNA, Ppp2r2d shRNA, and Ppp2r2d shRNA plus Ppp2r2d mutant cDNA. Data represent biological replicates (n=3), each value represents mean +/− s.d.
Extended Data Figure 4
Extended Data Figure 4. Expression profiles of gene-silenced CD8 T cells in tumors
OT-I T cells were transduced with lentiviral vectors driving expression of one of five experimental shRNAs or LacZ control shRNA. T cells were injected into day 14 B16-Ova tumor-bearing mice and isolated from tumors and spleens 7 days later. Cells were sorted to high purity and total RNA was obtained for Affymetrix gene expression profiling. For each shRNA, arrays were performed in triplicate (6 mice per group). a, Two genes (Egr2 and Ptpn2) have known functions in T cells. Enrichment in tumor versus spleen was calculated based on deep sequencing results from the secondary screen. b, Clustering of mean expression levels for mRNAs found to be significantly regulated by T cells in spleens or tumors expressing the LacZ control shRNA or one of five experimental shRNAs. Significant expression differences were defined as an Anova P value ≤0.01 between T cells expressing LacZ control shRNA or one of five experimental shRNAs (Alk, Arhgap5, Egr2, Ptpn2 or Ppp2r2d) (JMP-Genomics 6.0, SAS Institute Inc.). mRNAs significantly regulated in one or more treatment groups are shown after clustering (Fast Ward). c, Venn diagram showing overlaps between expression signatures by tumor-infiltrating T cells transduced with one of the five experimental shRNAs (signatures defined as an Anova p≤0.01 as described above). Indicated are the numbers of overlapping probe IDs for any combination of the 5 signatures, as indicated by the overlapping ovals. The significance of the overlaps versus those expected by random chance (Fishers Exact Test) is shown in the accompanying table.
Extended Data Figure 5
Extended Data Figure 5. Ppp2r2d shRNA enhances T cell proliferation and reduces apoptosis
a, Proliferation of Ppp2r2d shRNA-expressing T cells in tumors and tumor-draining lymph nodes. OT-I T cells expressing Ppp2r2d or LacZ shRNAs were labeled with CFSE and injected into B16-Ova tumor-bearing mice. T cells were isolated from the indicated organs on days 1, 3, 5 and 7 to examine the extent of T cell proliferation based on CFSE dilution. T cells that had not diluted CFSE (nondividing cells) were quantified (right). b, Viability of tumor-infiltrating T cells. OT-I T cells expressing Pp2r2d or LacZ shRNAs were injected into B16-Ova tumor-bearing mice. T cells were isolated on day 7 and apoptosis was assessed by intracellular staining with an antibody specific for activated caspase-3 (some T cell death may have been caused by the isolation procedure from tumors). c, Intracellular cytokine staining for IFNγ by LacZ and Ppp2r2d shRNA-expressing T cells harvested from B16-Ova tumors (primary flow cytometry analysis for data summarized in Figure 4d); T cells were labeled with CFSE prior to injection. Data for all experiments are representative of two independent trials. Statistical analysis was performed on biological replicates (n=3); * P≤0.05, ** P≤0.01, two-sided Student’s t-test. Each value represents mean +/− s.d.
Extended Data Figure 6
Extended Data Figure 6. Phenotypic characterization using memory, activation and exhaustion markers
a, The majority of adoptively transferred OT-I cells have a memory phenotype in lymph nodes but an effector phenotype in tumors. Cytokine pre-treated cells expressing Ppp2r2d or LacZ shRNAs were injected into mice bearing day 14 B16-Ova tumors. On day 7 following transfer, T cells were harvested from the indicated organs and stained with CD62L and CD44 antibodies. FACS analysis of shRNA-expressing OT-I cells was performed by gating on CD8/Thy1.1 double-positive cells. b, Analysis of exhaustion markers. OT-I cells were harvested from draining lymph nodes and tumors of mice and stained with antibodies specific for TIM-3, LAG-3, PD-1 and CD25. For all experiments (n=3 biological replicates; * P≤0.05, ** P≤0.01, Two-sided Student’s t-test); each value represents mean +/− s.d.
Extended Data Figure 7
Extended Data Figure 7. Mechanisms of anti-tumor activity of Ppp2r2d-silenced T cells
a, Intracellular staining for granzyme B by OT-I T cells in tumor-draining lymph nodes and tumors. b, Infiltration of shRNA-expressing T cells into tumors. OT-I T cells were transduced with LacZ or Ppp2r2d shRNA vectors encoding a GFP reporter and injected into B16-Ova tumor-bearing mice. After 7 days, tumors were excised and frozen sections stained with anti-GFP and DAPI to enumerate shRNAexpressing OT-I T cells in tumors. c, Tumor cell apoptosis. TUNEL immunohistochemistry was performed on tissue sections and apoptotic cells were quantified. d, MHC class I expression by tumor cells. Tumors were digested with collagenase and stained with CD45.2 and H-2Kb antibodies. FACS analysis for H-2Kb expression was performed by gating on CD45.2-negative melanoma cells. Data represent biological replicates (n=3), each value represents mean +/− s.d.
Figure 1
Figure 1. In vivo RNAi discovery of immunotherapy targets
a In vivo discovery approach for negative regulators of T cell function in tumors. T cells infected with shRNA libraries were injected into tumor-bearing mice; shRNAs that enabled T cell accumulation in tumors were identified by deep sequencing of the shRNA cassette from purified T cells. b, Deep sequencing data: shRNA sequence reads from tumors, irrelevant (irLN) and draining lymph nodes (dLN) versus spleen. Upper row: sequence reads for all genes in a pool, lower row: individual genes (LacZ, negative control). Dashed lines indicate a deviation by log2 from diagonal.
Figure 2
Figure 2. shRNA-driven accumulation of T cells in B16 melanoma
a, CD8 (OT-I) T cell enrichment in tumors relative to spleen (n=3). b, Enrichment of Ppp2r2d-silenced CD8 (OT-I) or CD4 (TRP1) T cells (Thy1.1+ cells) in tumor versus spleen. c, Reversal of shRNA-induced phenotype by Ppp2r2d cDNA with mutated shRNA binding site. d, qPCR for Ppp2r2d mRNA in tumor-infiltrating OT-I T cells (day 7). e, Ppp2r2d protein quantification by mass spectrometry with labeled synthetic peptides (AQUA, ratio of endogenous to AQUA peptides). Representative data from two independent experiments (a–d); Two-sided student’s t-test, * P<0.05, ** P<0.01; mean +/− s.d.
Figure 3
Figure 3. Changes in T cell function induced by Ppp2r2d shRNA
a, Tumor infiltration at 24 hours by CFSE-labeled OT-I T cells. b, Enhanced proliferation by Ppp2r2d-silenced T cells (CFSE dilution). c,d Reduced apoptosis by Ppp2r2d-silenced OT-I T cell in tumors (c, activated caspase-3) or during three day co-culture with B16-Ova tumor cells (d, annexin V), e, Ppp2r2d-silencing induced T cell expansion even when MHC class I expression was restricted to tumor cells; T cell transfer into C57BL/6 or b2m−/− mice with B16-Ova tumors. Data representative of two independent trials (n=3; ** P<0.01, two-sided student’s t-test); mean +/− s.d.
Figure 4
Figure 4. Cytokine secretion by gene-silenced tumor-infiltrating T cells
a–c, Ex vivo analysis of cytokine production by tumor-infiltrating OT-I T cells at a single-cell level using a nanowell device (84,672 wells of picoliter volume). a, Representative single cells in nanowells and corresponding patterns of cytokine secretion. b, Percentage of T cells secreting indicated cytokines. c, Cytokine secretion rates calculated from standard curves (mean +/− s.d., Mann Whitney test * P<0.05). d, Intracellular IFN-γ staining for tumor-infiltrating Ppp2r2d-silenced T cells, representative of two independent experiments (n=3, ** P<0.01, two-sided student’s t-test); mean +/− s.d.
Figure 5
Figure 5. Ppp2r2d silencing enhances anti-tumor activity of CD4 and CD8 T cells
T cells were activated with CD3/CD28 beads and infected with shRNA vectors. a,b CD4+ TRP-1 and/or CD8+ OT-I T cells (2 × 10⁶) were transferred (day 12 and 17) into mice bearing day 12 B16-Ova tumors. Tumor burden (a) and survival (b) were assessed. c, CD4+ TRP-1 and CD8+ pmel-1 T cells (3×10⁶ each) were transferred (day 10 and 15) into mice with day 10 B16 tumors. Representative of two independent experiments (n=7–9 mice/group), survival analyzed using log-rank (Mantel-Cox) test; mean +/− SEM.

Comment in

Similar articles

Cited by

References

    1. Galon J, et al. Type, density, and location of immune cells within human colorectal tumors predict clinical outcome. Science. 2006;313:1960–1964. - PubMed
    1. Hamanishi J, et al. Programmed cell death 1 ligand 1 and tumor-infiltrating CD8+ T lymphocytes are prognostic factors of human ovarian cancer. Proceedings of the National Academy of Sciences of the United States of America. 2007;104:3360–3365. - PMC - PubMed
    1. Mahmoud SM, et al. Tumor-Infiltrating CD8+ Lymphocytes Predict Clinical Outcome in Breast Cancer. J Clin Oncol. 2011;29:1949–1955. - PubMed
    1. Bindea G, et al. Spatiotemporal dynamics of intratumoral immune cells reveal the immune landscape in human cancer. Immunity. 2013;39:782–795. - PubMed
    1. Matsushita H, et al. Cancer exome analysis reveals a T-cell-dependent mechanism of cancer immunoediting. Nature. 2012;482:400–404. - PMC - PubMed

Publication types

MeSH terms

Associated data