

Egr3 induces a Th17 response by promoting the development of γδ T cells
- PMID: 24475259
- PMCID: PMC3901773
- DOI: 10.1371/journal.pone.0087265
Egr3 induces a Th17 response by promoting the development of γδ T cells
Abstract
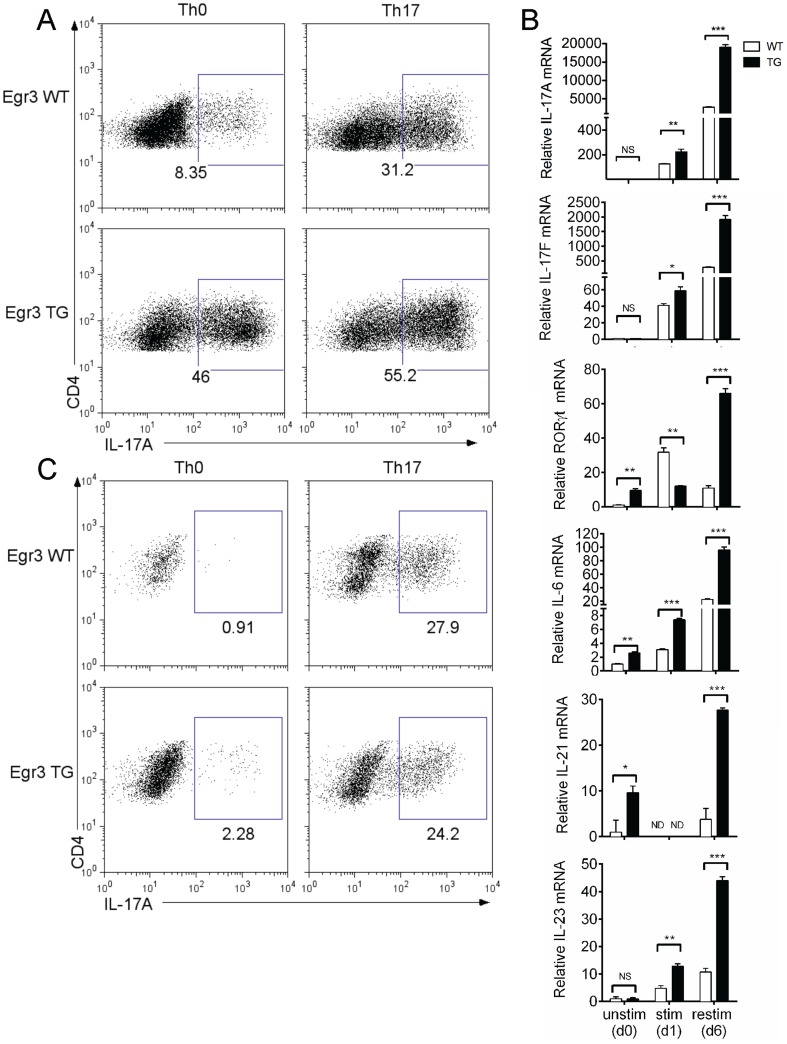
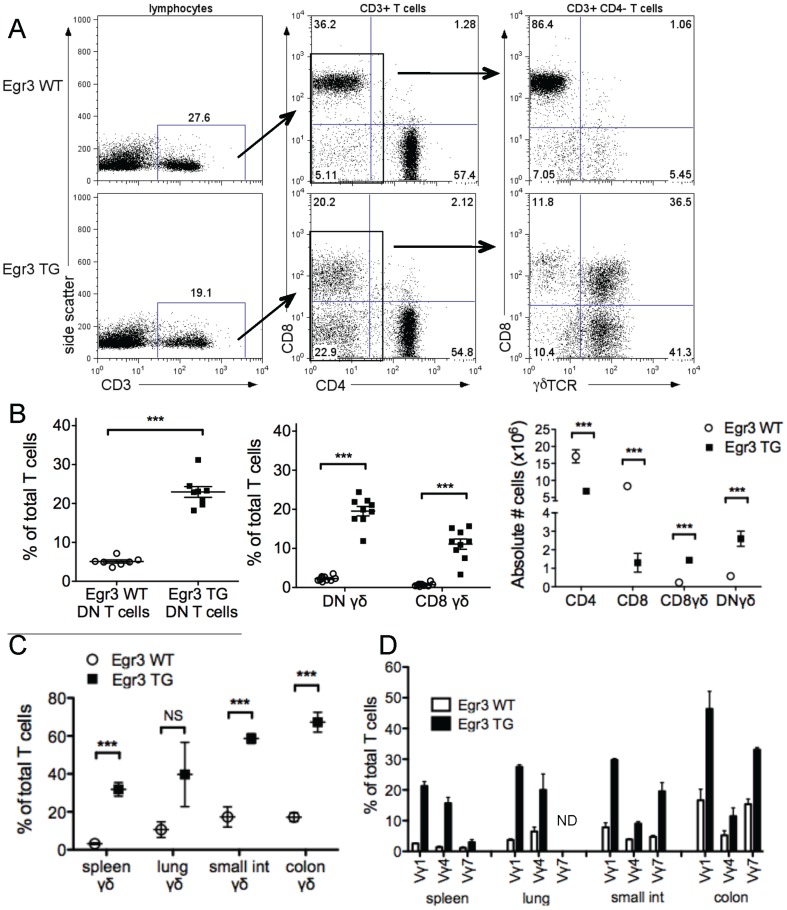
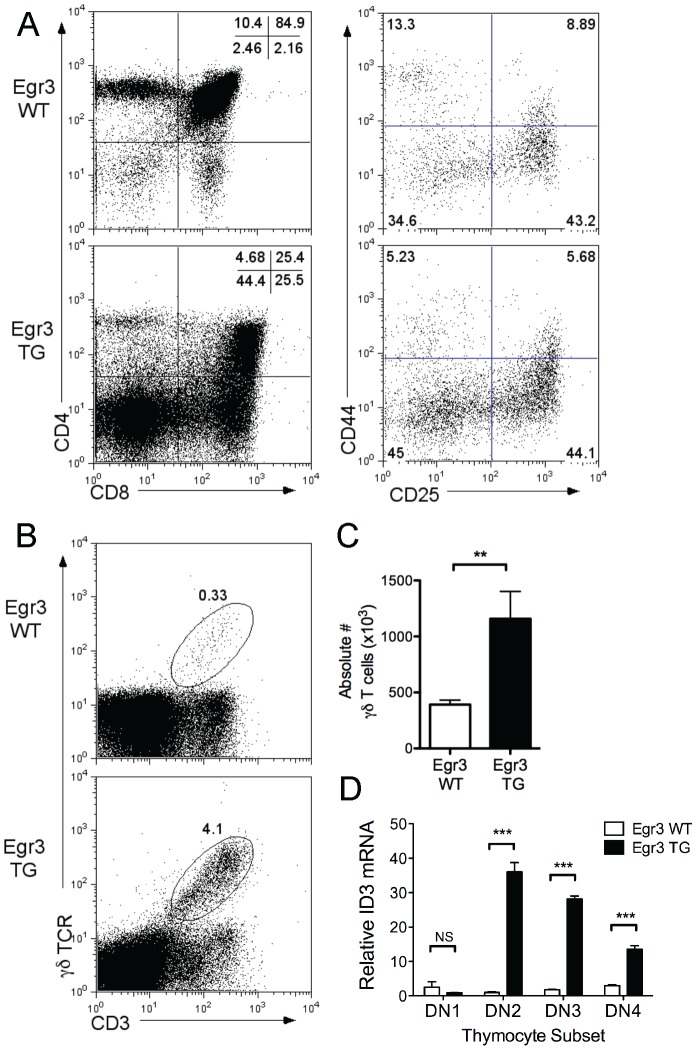
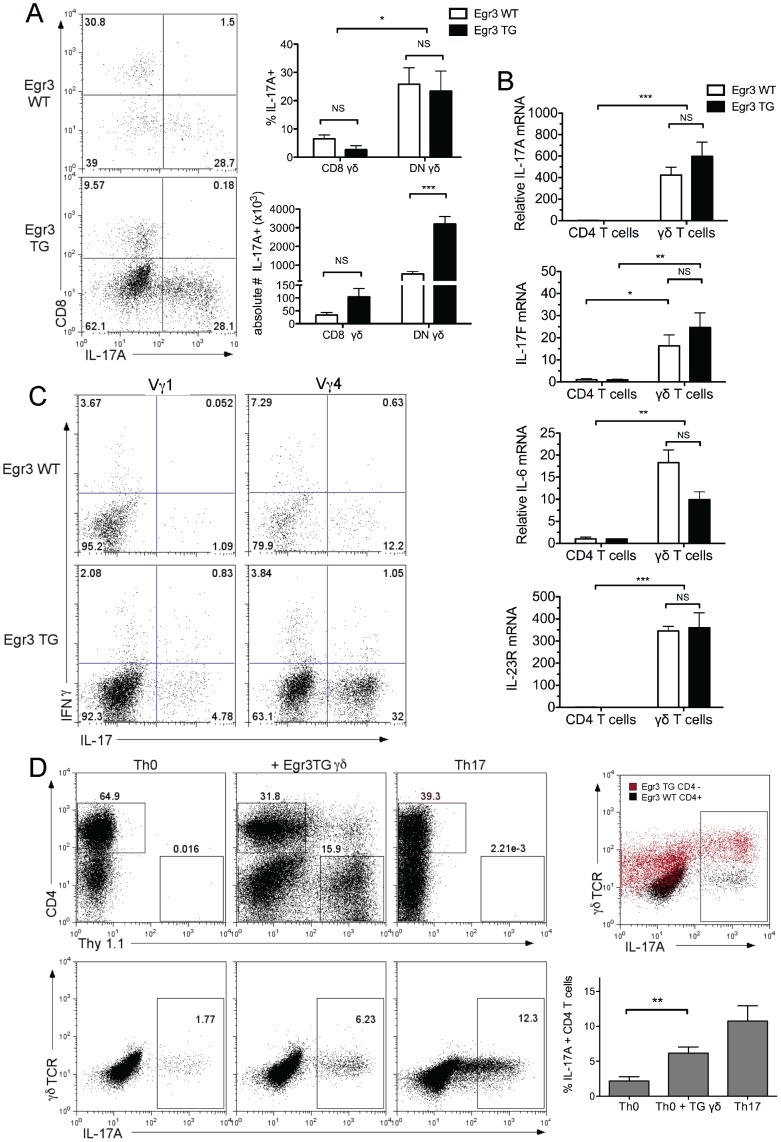
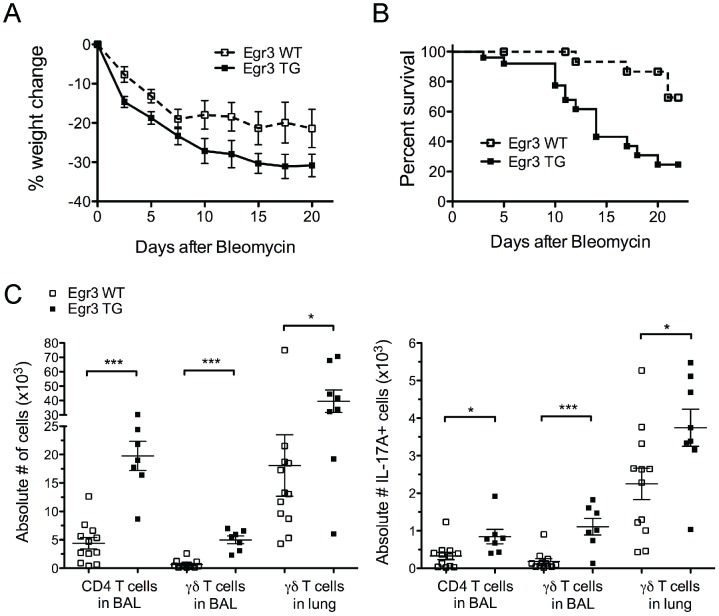
The transcription factor Early Growth Response 3 (Egr3) has been shown to play an important role in negatively regulating T cell activation and promoting T cell anergy in Th1 cells. However, its role in regulating other T helper subsets has yet to be described. We sought to determine the role of Egr3 in a Th17 response using transgenic mice that overexpress Egr3 in T cells (Egr3 TG). Splenocytes from Egr3 TG mice demonstrated more robust generation of Th17 cells even under non-Th17 skewing conditions. We found that while Egr3 TG T cells were not intrinsically more likely to become Th17 cells, the environment encountered by these cells was more conducive to Th17 development. Further analysis revealed a considerable increase in the number of γδ T cells in both the peripheral lymphoid organs and mucosal tissues of Egr3 TG mice, a cell type which normally accounts for only a small fraction of peripheral lymphocytes. Consistent with this marked increase in peripheral γδ T cells, thymocytes from Egr3 TG mice also appear biased toward γδ T cell development. Coculture of these Egr3-induced γδ T cells with wildtype CD4+ T cells increases Th17 differentiation, and Egr3 TG mice are more susceptible to bleomycin-induced lung inflammation. Overall our findings strengthen the role for Egr3 in promoting γδ T cell development and show that Egr3-induced γδ T cells are both functional and capable of altering the adaptive immune response in a Th17-biased manner. Our data also demonstrates that the role played by Egr3 in T cell activation and differentiation is more complex than previously thought.
Conflict of interest statement
Figures
Similar articles
-
Elevated frequencies of CD4(+) IL-21(+) T, CD4(+) IL-21R(+) T and IL-21(+) Th17 cells, and increased levels of IL-21 in bleomycin-induced mice may be associated with dermal and pulmonary inflammation and fibrosis.Int J Rheum Dis. 2016 Apr;19(4):392-404. doi: 10.1111/1756-185X.12522. Epub 2014 Dec 25. Int J Rheum Dis. 2016. PMID: 25545680
-
Egr2 and Egr3 in regulatory T cells cooperatively control systemic autoimmunity through Ltbp3-mediated TGF-β3 production.Proc Natl Acad Sci U S A. 2016 Dec 13;113(50):E8131-E8140. doi: 10.1073/pnas.1611286114. Epub 2016 Nov 30. Proc Natl Acad Sci U S A. 2016. PMID: 27911796 Free PMC article.
-
IL-17 producing gammadelta T cells are required for a controlled inflammatory response after bleomycin-induced lung injury.Inflammation. 2008 Jun;31(3):167-79. doi: 10.1007/s10753-008-9062-6. Epub 2008 Mar 13. Inflammation. 2008. PMID: 18338242
-
The natural and the inducible: interleukin (IL)-17-producing γδ T cells.Trends Immunol. 2013 Apr;34(4):151-4. doi: 10.1016/j.it.2012.11.004. Epub 2012 Dec 22. Trends Immunol. 2013. PMID: 23266231 Free PMC article. Review.
-
Phenotypic and functional plasticity of gamma-delta (γδ) T cells in inflammation and tolerance.Int Rev Immunol. 2014 Nov-Dec;33(6):537-58. doi: 10.3109/08830185.2013.863306. Epub 2013 Dec 19. Int Rev Immunol. 2014. PMID: 24354324 Review.
Cited by
-
Chronic Inflammation and γδ T Cells.Front Immunol. 2016 May 27;7:210. doi: 10.3389/fimmu.2016.00210. eCollection 2016. Front Immunol. 2016. PMID: 27303404 Free PMC article. Review.
-
Construction of Metastasis-Specific Regulation Network in Ovarian Cancer Based on Prognostic Stemness-Related Signatures.Reprod Sci. 2023 Sep;30(9):2634-2654. doi: 10.1007/s43032-022-01134-3. Epub 2023 Mar 20. Reprod Sci. 2023. PMID: 36940084
-
Long noncoding RNA antisense noncoding RNA in the INK4 locus inhibition alleviates airway remodeling in asthma through the regulation of the microRNA-7-5p/early growth response factor 3 axis.Immun Inflamm Dis. 2023 Apr;11(4):e823. doi: 10.1002/iid3.823. Immun Inflamm Dis. 2023. PMID: 37102654 Free PMC article.
-
Type-1 pericytes accumulate after tissue injury and produce collagen in an organ-dependent manner.Stem Cell Res Ther. 2014 Nov 6;5(6):122. doi: 10.1186/scrt512. Stem Cell Res Ther. 2014. PMID: 25376879 Free PMC article.
-
EGR3 and estrone are involved in the tamoxifen resistance and progression of breast cancer.J Cancer Res Clin Oncol. 2023 Dec;149(20):18103-18117. doi: 10.1007/s00432-023-05503-6. Epub 2023 Nov 24. J Cancer Res Clin Oncol. 2023. PMID: 37999751
References
-
- Patwardhan S, Gashler A, Siegel MG, Chang LC, Joseph LJ, et al. (1991) EGR3, a novel member of the Egr family of genes encoding immediate-early transcription factors. Oncogene 6: 917–928. - PubMed
-
- Mages HW, Stamminger T, Rilke O, Bravo R, Kroczek RA (1993) Expression of PILOT, a putative transcription factor, requires two signals and is cyclosporin A sensitive in T cells. International immunology 5: 63–70. - PubMed
Publication types
MeSH terms
Substances
Grants and funding
LinkOut - more resources
Full Text Sources
Other Literature Sources
Medical
Molecular Biology Databases
Research Materials
Miscellaneous
