Distinct roles of the methylcytosine oxidases Tet1 and Tet2 in mouse embryonic stem cells
- PMID: 24474761
- PMCID: PMC3910590
- DOI: 10.1073/pnas.1322921111
Distinct roles of the methylcytosine oxidases Tet1 and Tet2 in mouse embryonic stem cells
Abstract
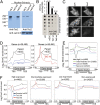
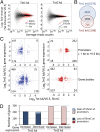
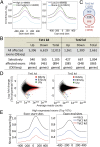
Dioxygenases of the Ten-Eleven Translocation (TET) family are 5-methylcytosine oxidases that convert 5-methylcytosine (5mC) to 5-hydroxymethylcytosine (5hmC) and further oxidation products in DNA. We show that Tet1 and Tet2 have distinct roles in regulating 5hmC in mouse embryonic stem cells (mESC). Tet1 depletion diminishes 5hmC levels at transcription start sites (TSS), whereas Tet2 depletion is predominantly associated with decreased 5hmC in gene bodies. Enrichment of 5hmC is observed at the boundaries of exons that are highly expressed, and Tet2 depletion results in substantial loss of 5hmC at these boundaries. In contrast, at promoter/TSS regions, Tet2 depletion results in increased 5hmC, potentially because of the redundant activity of Tet1. Together, the data point to a complex interplay between Tet1 and Tet2 in mESC, and to distinct roles for these two proteins in regulating promoter, exon, and polyadenylation site usage in cells.
Keywords: DNA demethylation; DNA hydroxymethylation; DNA methylation; epigenetics.
Conflict of interest statement
The authors declare no conflict of interest.
Figures


Similar articles
-
Distinct and overlapping control of 5-methylcytosine and 5-hydroxymethylcytosine by the TET proteins in human cancer cells.Genome Biol. 2014 Jun 23;15(6):R81. doi: 10.1186/gb-2014-15-6-r81. Genome Biol. 2014. PMID: 24958354 Free PMC article.
-
MYC deregulates TET1 and TET2 expression to control global DNA (hydroxy)methylation and gene expression to maintain a neoplastic phenotype in T-ALL.Epigenetics Chromatin. 2019 Jul 2;12(1):41. doi: 10.1186/s13072-019-0278-5. Epigenetics Chromatin. 2019. PMID: 31266538 Free PMC article.
-
Cooperative Action between SALL4A and TET Proteins in Stepwise Oxidation of 5-Methylcytosine.Mol Cell. 2016 Dec 1;64(5):913-925. doi: 10.1016/j.molcel.2016.10.013. Epub 2016 Nov 10. Mol Cell. 2016. PMID: 27840027
-
Role of ten-eleven translocation proteins and 5-hydroxymethylcytosine in hepatocellular carcinoma.Cell Prolif. 2019 Jul;52(4):e12626. doi: 10.1111/cpr.12626. Epub 2019 Apr 29. Cell Prolif. 2019. PMID: 31033072 Free PMC article. Review.
-
Loss of 5-hydroxymethylcytosine in cancer: cause or consequence?Genomics. 2014 Nov;104(5):352-7. doi: 10.1016/j.ygeno.2014.08.017. Epub 2014 Aug 30. Genomics. 2014. PMID: 25179374 Free PMC article. Review.
Cited by
-
Ten-eleven translocation protein 1 modulates medulloblastoma progression.Genome Biol. 2021 Apr 29;22(1):125. doi: 10.1186/s13059-021-02352-9. Genome Biol. 2021. PMID: 33926529 Free PMC article.
-
Myeloid-derived suppressor cell: A crucial player in autoimmune diseases.Front Immunol. 2022 Dec 9;13:1021612. doi: 10.3389/fimmu.2022.1021612. eCollection 2022. Front Immunol. 2022. PMID: 36569895 Free PMC article. Review.
-
MSTN Mutant Promotes Myogenic Differentiation by Increasing Demethylase TET1 Expression via the SMAD2/SMAD3 Pathway.Int J Biol Sci. 2020 Feb 21;16(8):1324-1334. doi: 10.7150/ijbs.40551. eCollection 2020. Int J Biol Sci. 2020. PMID: 32210722 Free PMC article.
-
A probabilistic generative model for quantification of DNA modifications enables analysis of demethylation pathways.Genome Biol. 2016 Mar 14;17:49. doi: 10.1186/s13059-016-0911-6. Genome Biol. 2016. PMID: 26975309 Free PMC article.
-
The Modification of Tet1 in Male Germline Stem Cells and Interact with PCNA, HDAC1 to promote their Self-renewal and Proliferation.Sci Rep. 2016 Nov 18;6:37414. doi: 10.1038/srep37414. Sci Rep. 2016. PMID: 27857213 Free PMC article.
References
Publication types
MeSH terms
Substances
Associated data
- Actions
- Actions
Grants and funding
LinkOut - more resources
Full Text Sources
Other Literature Sources
Molecular Biology Databases

