

Widespread genetic heterogeneity in multiple myeloma: implications for targeted therapy
- PMID: 24434212
- PMCID: PMC4241387
- DOI: 10.1016/j.ccr.2013.12.015
Widespread genetic heterogeneity in multiple myeloma: implications for targeted therapy
Abstract
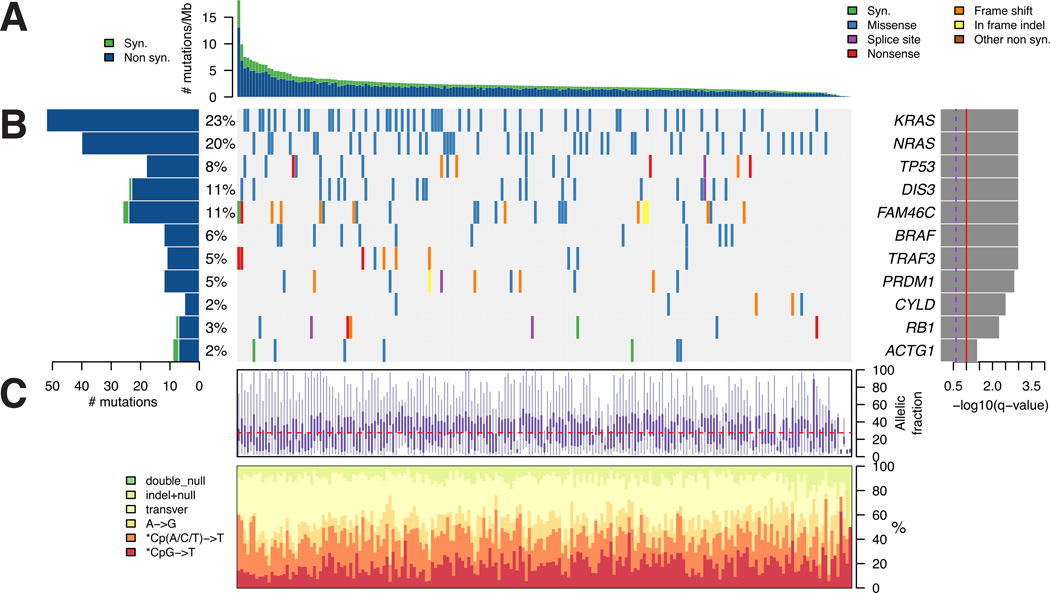
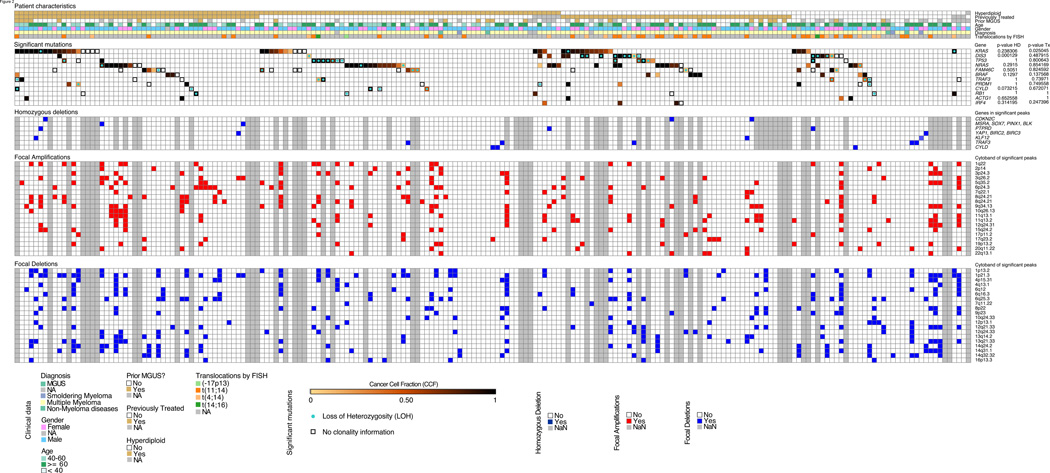
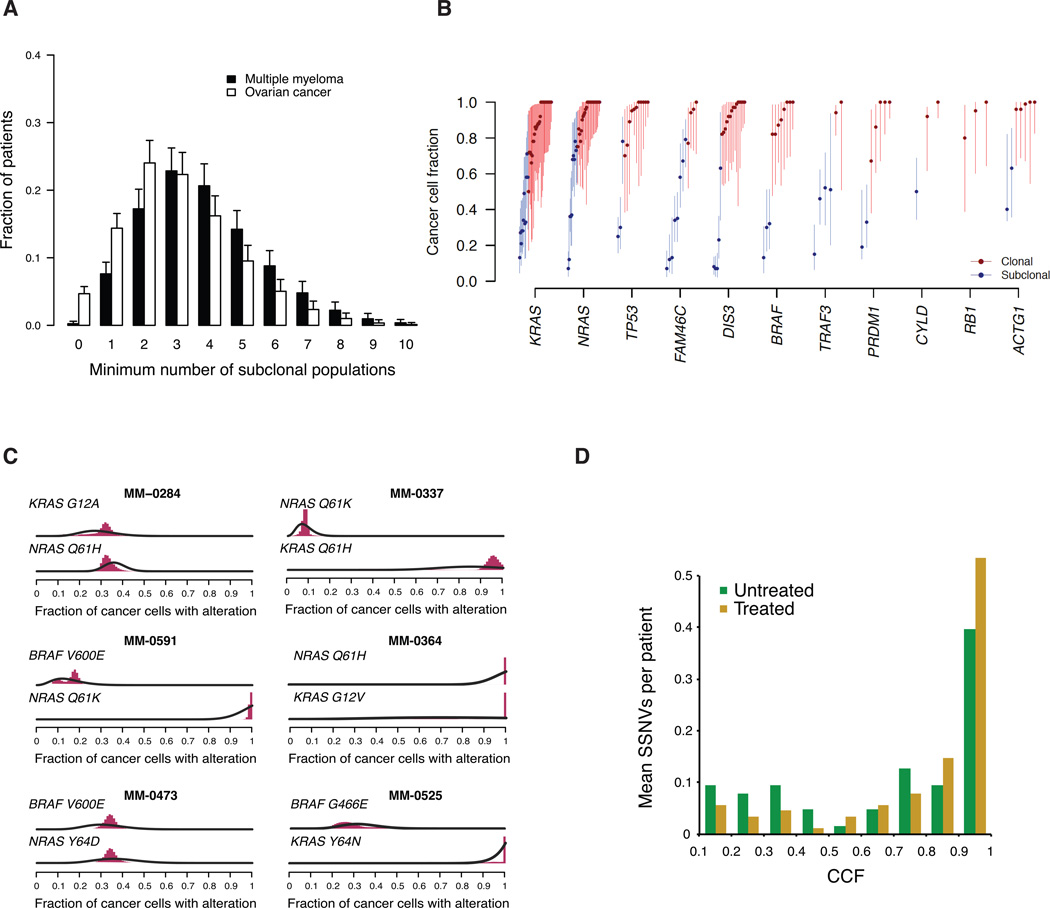
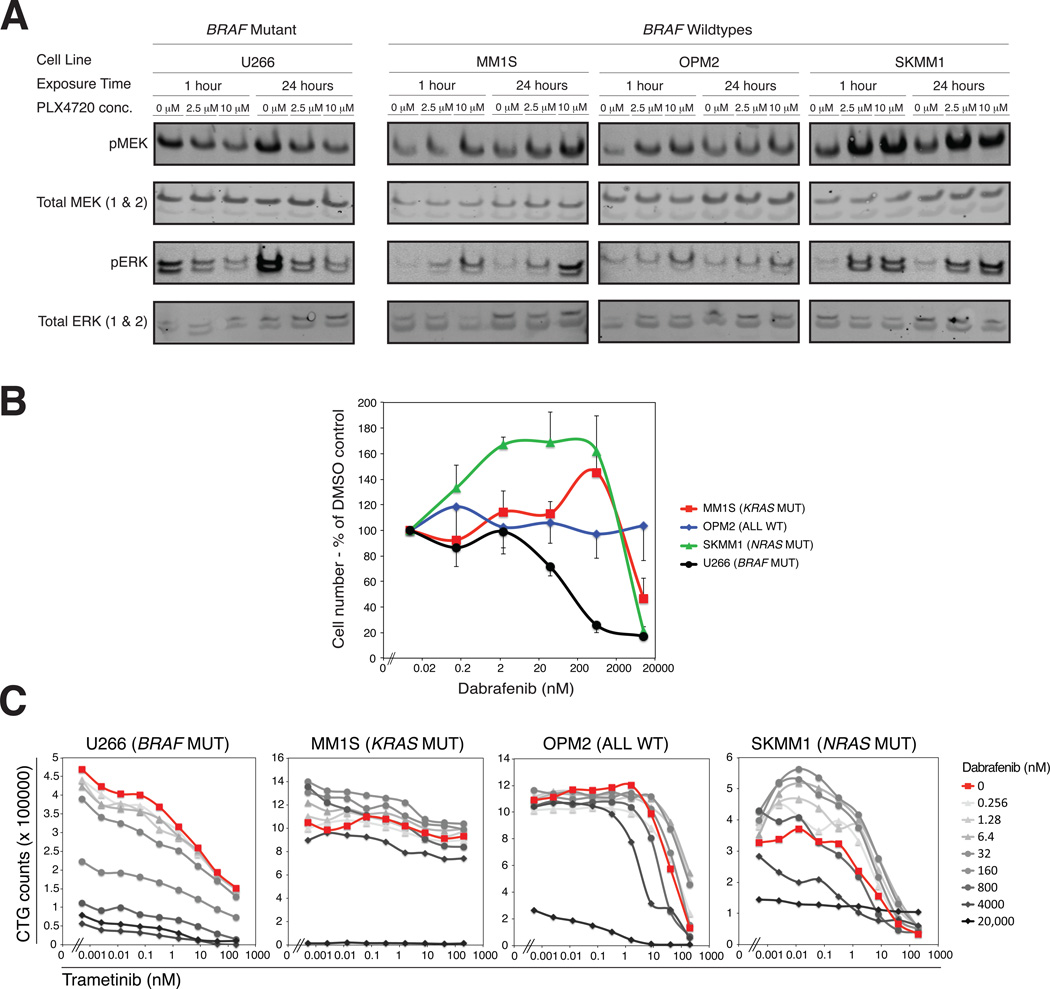
We performed massively parallel sequencing of paired tumor/normal samples from 203 multiple myeloma (MM) patients and identified significantly mutated genes and copy number alterations and discovered putative tumor suppressor genes by determining homozygous deletions and loss of heterozygosity. We observed frequent mutations in KRAS (particularly in previously treated patients), NRAS, BRAF, FAM46C, TP53, and DIS3 (particularly in nonhyperdiploid MM). Mutations were often present in subclonal populations, and multiple mutations within the same pathway (e.g., KRAS, NRAS, and BRAF) were observed in the same patient. In vitro modeling predicts only partial treatment efficacy of targeting subclonal mutations, and even growth promotion of nonmutated subclones in some cases. These results emphasize the importance of heterogeneity analysis for treatment decisions.
Copyright © 2014 Elsevier Inc. All rights reserved.
Figures
Similar articles
-
Intraclonal heterogeneity and distinct molecular mechanisms characterize the development of t(4;14) and t(11;14) myeloma.Blood. 2012 Aug 2;120(5):1077-86. doi: 10.1182/blood-2012-03-412981. Epub 2012 May 9. Blood. 2012. PMID: 22573403
-
Longitudinal analysis of 25 sequential sample-pairs using a custom multiple myeloma mutation sequencing panel (M(3)P).Ann Hematol. 2015 Jul;94(7):1205-11. doi: 10.1007/s00277-015-2344-9. Epub 2015 Mar 7. Ann Hematol. 2015. PMID: 25743686 Free PMC article.
-
Mutational Spectrum, Copy Number Changes, and Outcome: Results of a Sequencing Study of Patients With Newly Diagnosed Myeloma.J Clin Oncol. 2015 Nov 20;33(33):3911-20. doi: 10.1200/JCO.2014.59.1503. Epub 2015 Aug 17. J Clin Oncol. 2015. PMID: 26282654 Free PMC article. Clinical Trial.
-
Advances in the pathogenesis and diagnosis of multiple myeloma.Int J Lab Hematol. 2015 May;37 Suppl 1:108-14. doi: 10.1111/ijlh.12360. Int J Lab Hematol. 2015. PMID: 25976968 Review.
-
Progress in the identification of gene mutations involved in multiple myeloma.Onco Targets Ther. 2019 May 24;12:4075-4080. doi: 10.2147/OTT.S205922. eCollection 2019. Onco Targets Ther. 2019. PMID: 31213829 Free PMC article. Review.
Cited by
-
Designing Evolutionary-based Interception Strategies to Block the Transition from Precursor Phases to Multiple Myeloma.Clin Cancer Res. 2021 Jan 1;27(1):15-23. doi: 10.1158/1078-0432.CCR-20-1395. Epub 2020 Aug 5. Clin Cancer Res. 2021. PMID: 32759358 Free PMC article. Review.
-
The 3' to 5' Exoribonuclease DIS3: From Structure and Mechanisms to Biological Functions and Role in Human Disease.Biomolecules. 2015 Jul 17;5(3):1515-39. doi: 10.3390/biom5031515. Biomolecules. 2015. PMID: 26193331 Free PMC article. Review.
-
Collaborative Control of Cell Cycle Progression by the RNA Exonuclease Dis3 and Ras Is Conserved Across Species.Genetics. 2016 Jun;203(2):749-62. doi: 10.1534/genetics.116.187930. Epub 2016 Mar 30. Genetics. 2016. PMID: 27029730 Free PMC article.
-
A model of breast cancer heterogeneity reveals vascular mimicry as a driver of metastasis.Nature. 2015 Apr 16;520(7547):358-62. doi: 10.1038/nature14403. Epub 2015 Apr 8. Nature. 2015. PMID: 25855289 Free PMC article.
-
Kinase inhibitors as potential agents in the treatment of multiple myeloma.Oncotarget. 2016 Dec 6;7(49):81926-81968. doi: 10.18632/oncotarget.10745. Oncotarget. 2016. PMID: 27655636 Free PMC article. Review.
References
-
- Ahmann GJ, Chng WJ, Henderson KJ, Price-Troska TL, DeGoey RW, Timm MM, Dispenzieri A, Greipp PR, Sable-Hunt A, Bergsagel L, Fonseca R. Effect of tissue shipping on plasma cell isolation, viability, and RNA integrity in the context of a centralized good laboratory practice-certified tissue banking facility. Cancer Epidemiol Biomarkers Prev. 2008;17:666–673. - PubMed
-
- Andrulis M, Lehners N, Capper D, Penzel R, Heining C, Huellein J, Zenz T, von Deimling A, Schirmacher P, Ho AD, et al. Targeting the BRAF V600E Mutation in Multiple Myeloma. Cancer Discov. 2013;3:862–869. - PubMed
Publication types
MeSH terms
Associated data
Grants and funding
LinkOut - more resources
Full Text Sources
Other Literature Sources
Medical
Research Materials
Miscellaneous
