. 2014 Mar 14;289(11):7747-62.
doi: 10.1074/jbc.M113.519686. Epub 2014 Jan 10.

Novel regulation of CD80/CD86-induced phosphatidylinositol 3-kinase signaling by NOTCH1 protein in interleukin-6 and indoleamine 2,3-dioxygenase production by dendritic cells

Affiliations

Novel regulation of CD80/CD86-induced phosphatidylinositol 3-kinase signaling by NOTCH1 protein in interleukin-6 and indoleamine 2,3-dioxygenase production by dendritic cells

Chandana Koorella et al. J Biol Chem. .

Abstract

Dendritic cells (DC) play a critical role in modulating antigen-specific immune responses elicited by T cells via engagement of the prototypic T cell costimulatory receptor CD28 by the cognate ligands CD80/CD86, expressed on DC. Although CD28 signaling in T cell activation has been well characterized, it has only recently been shown that CD80/CD86, which have no demonstrated binding domains for signaling proteins in their cytoplasmic tails, nonetheless also transduce signals to the DC. Functionally, CD80/CD86 engagement results in DC production of the pro-inflammatory cytokine IL-6, which is necessary for full T cell activation. However, ligation of CD80/CD86 by CTLA4 also induces DC production of the immunosuppressive enzyme indoleamine 2,3-dioxygenase (IDO), which depletes local pools of the essential amino acid tryptophan, resulting in blockade of T cell activation. Despite the significant role of CD80/CD86 in immunological processes and the seemingly opposing roles they play by producing IL-6 and IDO upon their activation, how CD80/CD86 signal remains poorly understood. We have now found that cross-linking CD80/CD86 in human DC activates the PI3K/AKT pathway. This results in phosphorylation/inactivation of its downstream target, FOXO3A, and alleviates FOXO3A-mediated suppression of IL-6 expression. A second event downstream of AKT phosphorylation is activation of the canonical NF-κB pathway, which induces IL-6 expression. In addition to these downstream pathways, we unexpectedly found that CD80/CD86-induced PI3K signaling is regulated by previously unrecognized cross-talk with NOTCH1 signaling. This cross-talk is facilitated by NOTCH-mediated up-regulation of the expression of prolyl isomerase PIN1, which in turn increases enzyme activity of casein kinase II. Subsequently, phosphatase and tensin homolog (which suppresses PI3K activity) is inactivated via phosphorylation by casein kinase II. This results in full activation of PI3K signaling upon cross-linking CD80/CD86. Similar to IL-6, we have found that CD80/CD86-induced IDO production by DC at late time points is also dependent upon the PI3K → AKT → NF-κB pathway and requires cross-talk with NOTCH signaling. These data further suggest that the same signaling pathways downstream of DC CD80/CD86 cross-linking induce early IL-6 production to enhance T cell activation, followed by later IDO production to self-limit this activation. In addition to characterizing the pathways downstream of CD80/CD86 in IL-6 and IDO production, identification of a novel cross-talk between NOTCH1 and PI3K signaling may provide new insights in other biological processes where PI3K signaling plays a major role.

Keywords: Dendritic Cells; Indoleamine 2,3-Dioxygenase; Interleukin; NOTCH Pathway; PI 3-Kinase (PI3K); Signal Transduction.


Figures
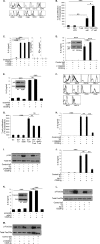
FIGURE 1.
FIGURE 1.
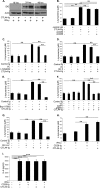
A, flow cytometric analysis of Mo-DC cultured in medium for expression of CD1a, CD11b, CD11c, CD14, CD40, CD80, CD83, CD86, MHC I, and MHC II. B, T cell proliferation assay was performed by determining the amount of thymidine incorporated by proliferating T cells when cultured with DC +/− LPS. C, ELISA for IL-6 of cell culture supernatants of Mo-DC +/− control IgG, CD28-Ig, anti-CD80 antibody, or anti-CD86 antibody. ELISA for IL-23 and IFN-γ of cell culture supernatants of Mo-DC cultured +/− CD28-Ig. D, Western blots were performed to detect phosphorylated p85 and total p85 using cell lysates from Mo-DC cultured in medium or with CD28-Ig (inset). ELISA for IL-6 of cell culture supernatants from Mo-DC cultured with vehicle control (VC, DMSO), control IgG, or the PI3K inhibitor LY294002 +/− CD28-Ig. E, Western blots were performed to detect p85 and actin using cell lysates from Mo-DC transfected with scramble siRNA or p85 siRNA (inset). ELISA for IL-6 of cell culture supernatants of Mo-DC cultured with scramble siRNA, p85 siRNA +/− CD28-Ig, is shown. F, flow cytometric analysis of Mo-DC cultured with the PI3K inhibitor LY294002 for expression of CD1a, CD1b, CD11c, CD14, CD40, CD80, CD83, CD86, MHC I, and MHCII. G, T-cell proliferation assay was performed by determining the amount of thymidine incorporated by proliferating T cells when cultured with DC cultured in medium +/− the PI3K inhibitor LY294002 or siRNA p85 and further cultured with T cells. H, ELISA for IL-6 of cell culture supernatants from murine BMDC (VC, DMSO), control IgG, or the PI3K inhibitor LY294002 +/− CD28-Ig. I, Western blots were performed to detect phosphorylated and total AKT using lysates from Mo-DC cultured with vehicle control (VC, DMSO), control IgG, or the PI3K inhibitor LY294002 +/− CD28-Ig. J, ELISA for IL-6 of cell culture supernatants of Mo-DC cultured with vehicle control (VC, DMSO), control IgG, or the AKT inhibitor AKT II +/− CD28-Ig. K, Western blots were performed to detect total AKT and actin using lysates from DC transfected with scramble siRNA or AKT1 siRNA (inset). ELISA for IL-6 of cell culture supernatants of Mo-DC cultured with scramble siRNA, AKT1, siRNA +/− CD28-Ig. L, Western blots were performed to detect phosphorylated and total FOXO3a using cell lysates from Mo-DC cultured with vehicle control (VC, DMSO), control IgG or the AKT inhibitor AKT II +/− CD28-Ig. M, Western blots were performed to detect phosphorylated and total FOXO3a using cell lysates from Mo-DC cultured with vehicle control (VC, DMSO), or the PI3K inhibitor. Results shown are representative of three experiments. ns, not significant; *, p < 0.05; **, p < 0.01; ***, p < 0.001.
FIGURE 2.
FIGURE 2.
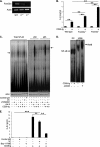
A, cell lysates of BMDC from wild type mice (WT), FOXO3A heterozygotes (F+/−), or knock outs (F−/−) were analyzed for FOXO3A mRNA expression by RT-PCR. B, cell culture supernatants of murine BMDC from wild type, FOXO3A+/−, or FOXO3A+/+ mice cultured +/− CD28-Ig were used to perform ELISA for IL-6. C, whole cell lysates of DC cultured alone, with LY294002, or AKT II +/− CD28-Ig were analyzed by electromobility gel shift assay with primers containing consensus NF-κB-binding sites. The arrow (left panel) indicates NF-κB dimers. Supershift EMSA was performed to detect p50 and p65 subunits as represented by the arrow (right panel). Actin was used as loading control. D, whole cell lysates of Mo-DC cultured +/− CD28-Ig were used to perform EMSA to detect RELB subunit as represented by the arrow. U266 myeloma cells treated with anti-CD28 activating antibody were used as positive control for RELB expression. Actin was used as the loading control. E, cell culture supernatants of Mo-DC cultured +/− vehicle control (VC), control IgG, or the NF-κB inhibitor Bay-11-7082 were assayed for IL-6 by ELISA. Results shown are representative of three experiments. ns, not significant; **, p < 0.01; ***, p < 0.001.
FIGURE 3.
FIGURE 3.
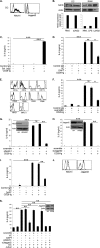
A, flow cytometric analysis of Mo-DC for expression of NOTCH1 and JAGGED2. B, cell lysates from Mo-DC cultured in medium (med) or soluble JAGGED2 (sJAG2) were used to perform Western blots for NICD. As a positive control, RAW cells were cultured in medium, with LPS or soluble JAGGED2. Densitometric analysis was performed using ImageJ software. C, ELISA for IL-6 from cell supernatants of Mo-DC was cultured in control IgG, sJAG2 +/− CD28-Ig. D, ELISA for IL-6 from cell supernatants of Mo-DC cultured alone or with vehicle control (VC), control IgG, DAPT +/− CD28-Ig. E, flow cytometric analysis of Mo-DC treated with DAPT for expression of CD1a, CD14, CD11b, CD11c, CD40, CD80, CD83, CD86, MHC I, and MHC II. F, ELISA for IL-6 from cell supernatants of Mo-DC cultured alone, with control Ig or anti-NRR1 antibody. G, Western blotting was performed using cell lysates from Mo-DC transfected with scramble/NOTCH1 siRNA (inset). ELISA for IL-6 from cell supernatants of Mo-DC cultured alone, with scramble siRNA, or NOTCH1 siRNA. H, Western blotting was performed using cell lysates of Mo-DC transfected with scramble/JAGGED2 siRNA (inset). ELISA for IL-6 from cell supernatants of Mo-DC cultured alone, with scramble siRNA, or JAGGED2 siRNA. I, ELISA for IL-6 of cell culture supernatants from murine BMDC cultured alone or with vehicle control, control IgG, DAPT +/− CD28-Ig. J, flow cytometric analysis of Jurkat for expression of NOTCH1 and JAGGED2. K, Western blots were performed using cell lysates from Jurkat cells transfected with scramble/JAGGED2 siRNA (inset). ELISA for IL-6 from cell supernatants of Mo-DC cultured with vehicle control, DAPT, scramble siRNA, siRNA NOTCH1+/− CD28-Ig, and Jurkat cells that were untransfected or transfected with JAGGED2 siRNA. Results shown are representative of three experiments. ns, not significant; *, p < 0.05; **, p < 0.01; ***, p < 0.001.
FIGURE 4.
FIGURE 4.
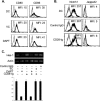
A, flow cytometric analysis of Mo-DC cultured alone, with control Ig, or DAPT for expression of CD80 and CD86. B, flow cytometric analysis of Mo-DC cultured alone, with control Ig, or CD28-Ig for NOTCH1 and JAGGED2 expression. C, RNA from Mo-DC cultured alone, with vehicle control (VC), DAPT, or CD28-Ig was analyzed by RT-PCR for expression of HES-1 and actin. Densitometric analysis was performed using ImageJ software. Results shown are representative of three experiments.
FIGURE 5.
FIGURE 5.
Cell lysates from Mo-DC cultured alone, with vehicle control (VC), control IgG, or DAPT +/− CD28-Ig were used to perform Western blots for phosphorylated and total AKT and FOXO3A (A) and EMSA to detect NF-κB dimers as represented by the arrow (left panel) (B). Supershift EMSA was performed to detect p50 and p65 subunits as represented by the arrow (right panel). Actin was used as a loading control. Results shown are representative of three experiments.
FIGURE 6.
FIGURE 6.
A, Western blots were performed to detect phosphorylated and total PTEN using cell lysates from Mo-DC cultured alone or with vehicle control (VC), control IgG, or DAPT +/− CD28-Ig. B, Western blotting was performed to detect phosphorylated and total PTEN using cell lysates from Mo-DC cultured alone or with vehicle control, control IgG, or the CK II inhibitor-IV +/− CD28-Ig. C, ELISA for IL-6 from cell supernatants of Mo-DC cultured with vehicle control, control IgG, or CK II inhibitor-IV +/− addition of CD28-Ig. D, Mo-DC were cultured alone or with vehicle control, control IgG, or DAPT +/− CD28-Ig. RNA was analyzed by RT-PCR. E, Mo-DC were cultured alone or with vehicle control, control IgG, or DAPT. RNA was analyzed by quantitative-PCR for mRNA expression of CK II with actin as a loading control. F, Mo-DC were cultured alone or with vehicle control, control IgG, or DAPT +/− CD28-Ig, and cell lysates were analyzed by Western blot to detect CK II expression. Densitometric analysis was performed using ImageJ software. G, cell lysates of Mo-DC cultured alone or with vehicle control, control IgG, DAPT, or the CK II inhibitor CK II-IV +/− CD28-Ig were used to assay CK II enzyme activity. Results shown are representative of three experiments. ns, not significant; *, p < 0.05; **, p < 0.01.
FIGURE 7.
FIGURE 7.
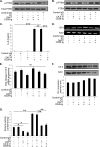
A, Western blots were performed to detect NICD and actin using cell lysates from DC transfected with scramble siRNA or NOTCH1 siRNA. B, RT-PCR was performed to detect PIN1 and actin mRNA using RNA extracted from DC transfected with scramble siRNA or NOTCH1 siRNA. C, Western blots were performed to detect PIN1 and actin using cell lysates from DC transfected with scramble siRNA or NOTCH1 siRNA. D, Western blots were performed to detect PIN1 and actin using cell lysates from DC transfected with scramble siRNA or PIN1 siRNA (inset). ELISA for IL-6 from cell supernatants of Mo-DC cultured alone, with scramble siRNA, or PIN1 siRNA +/− CD28-Ig. E, Mo-DC were cultured alone, with scramble siRNA, or PIN1 siRNA +/− addition of CD28-Ig. Cell lysates were analyzed for enzyme activity assay for CK II. Results shown are representative of three experiments. ns, not significant; **, p < 0.01.
FIGURE 8.
FIGURE 8.
A, Western blots were performed to detect IDO and actin using cell lysates from Mo-DC cultured with IFN-γ +/− CTLA4-Ig for 18, 24, or 48 h. B, Mo-DC were cultured with IFN-γ followed by addition of CTLA4-Ig, anti-CD80, or anti-CD86. Cell culture supernatants were assayed for l-kynurenine levels to estimate IDO activity. Mo-DC cultured with IFN-γ and treated with the PI3K inhibitor LY294002 (C), AKT inhibitor AKT II (D), NF-κB inhibitor Bay-11-7062 (E), NOTCH signaling inhibitor DAPT or anti-NRR1 blocking antibody (F), or CK II inhibitor CK II-IV +/− CTLA4-Ig (G). Cell culture supernatants were assayed for l-kynurenine levels to estimate IDO activity. Mo-DC were cultured with or without IFN-γ followed by addition of CTLA4-Ig or CD28-Ig. Cell culture supernatants were used to assay l-kynurenine levels to estimate IDO activity (H) or perform ELISA for IL-6 (I).
FIGURE 9.
FIGURE 9.
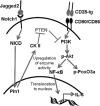
Engagement of NOTCH1 on DC by its ligand JAGGED2 expressed on a neighboring DC initiates NOTCH1 signaling resulting in the transcription of the prolyl isomerase PIN1. Subsequently, casein kinase II activity is up-regulated, which inactivates PTEN by phosphorylation. This allows for full activation of PI3K downstream of CD80/CD86 ligation. Downstream of PI3K, AKT is activated, which in turn phosphorylates/inactivates FOXO3A and inhibits IL-6 suppression. Simultaneous activation of NF-κB downstream of AKT allows for IL-6 production by DC.

Similar articles

Cited by

References

    1. Lanier L. L., O'Fallon S., Somoza C., Phillips J. H., Linsley P. S., Okumura K., Ito D., Azuma M. (1995) CD80 (B7) and CD86 (B70) provide similar costimulatory signals for T cell proliferation, cytokine production, and generation of CTL. J. Immunol. 154, 97–105 - PubMed
    1. Sharpe A. H., Freeman G. J. (2002) The B7-CD28 superfamily. Nat. Rev. Immunol. 2, 116–126 - PubMed
    1. Frauwirth K. A., Riley J. L., Harris M. H., Parry R. V., Rathmell J. C., Plas D. R., Elstrom R. L., June C. H., Thompson C. B. (2002) The CD28 signaling pathway regulates glucose metabolism. Immunity 16, 769–777 - PubMed
    1. Bour-Jordan H., Blueston J. A. (2002) CD28 function: a balance of costimulatory and regulatory signals. J. Clin. Immunol. 22, 1–7 - PubMed
    1. Orabona C., Grohmann U., Belladonna M. L., Fallarino F., Vacca C., Bianchi R., Bozza S., Volpi C., Salomon B. L., Fioretti M. C., Romani L., Puccetti P. (2004) CD28 induces immunostimulatory signals in dendritic cells via CD80 and CD86. Nat. Immunol. 5, 1134–1142 - PubMed

Publication types

MeSH terms