. 2014 Mar;25(5):566-82.
doi: 10.1091/mbc.E13-07-0360. Epub 2014 Jan 8.

CXCR4 drives the metastatic phenotype in breast cancer through induction of CXCR2 and activation of MEK and PI3K pathways

Affiliations

CXCR4 drives the metastatic phenotype in breast cancer through induction of CXCR2 and activation of MEK and PI3K pathways

Tammy Sobolik et al. Mol Biol Cell. 2014 Mar.

Abstract

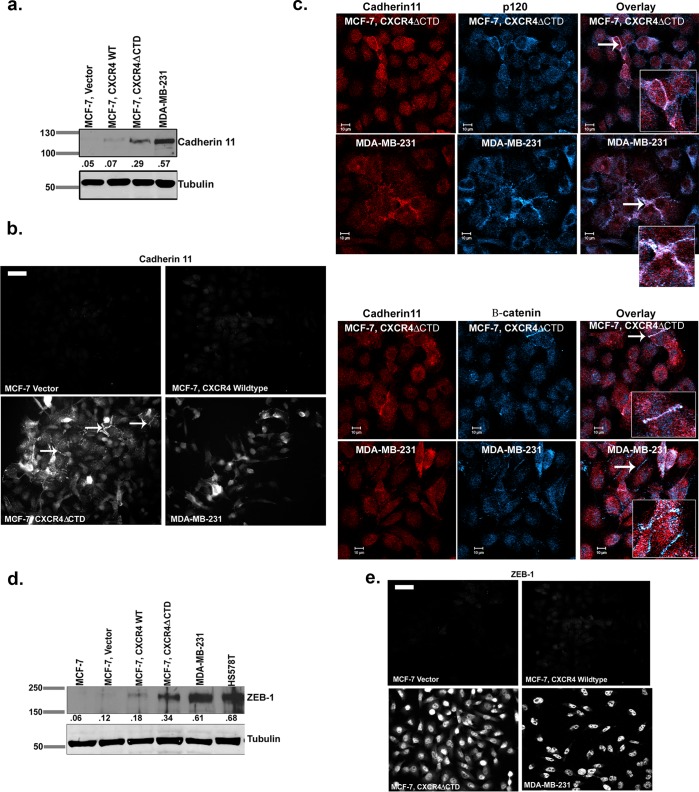
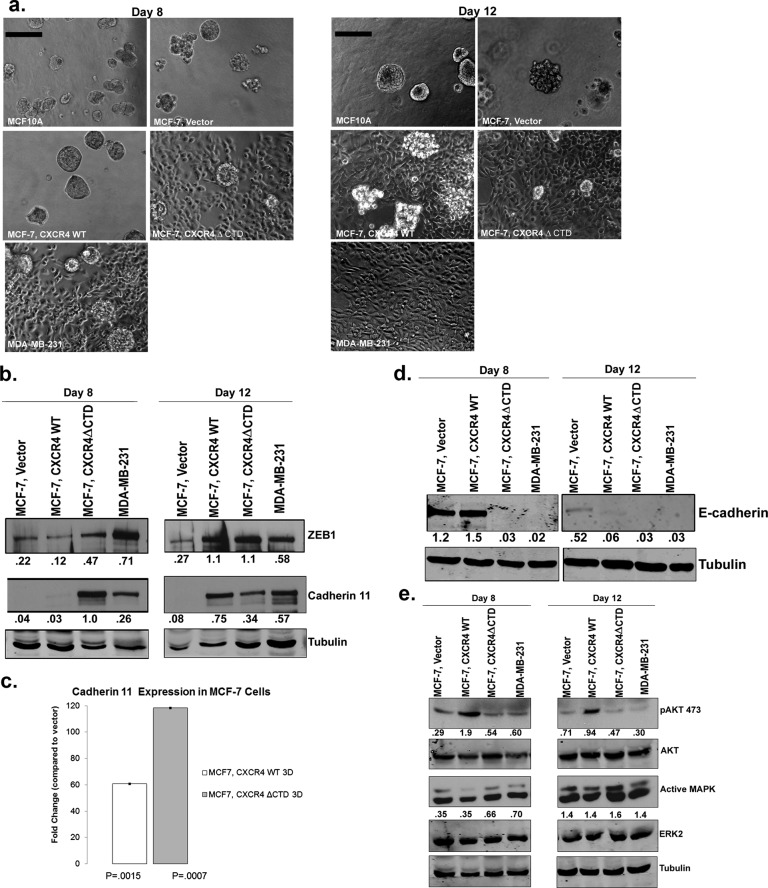
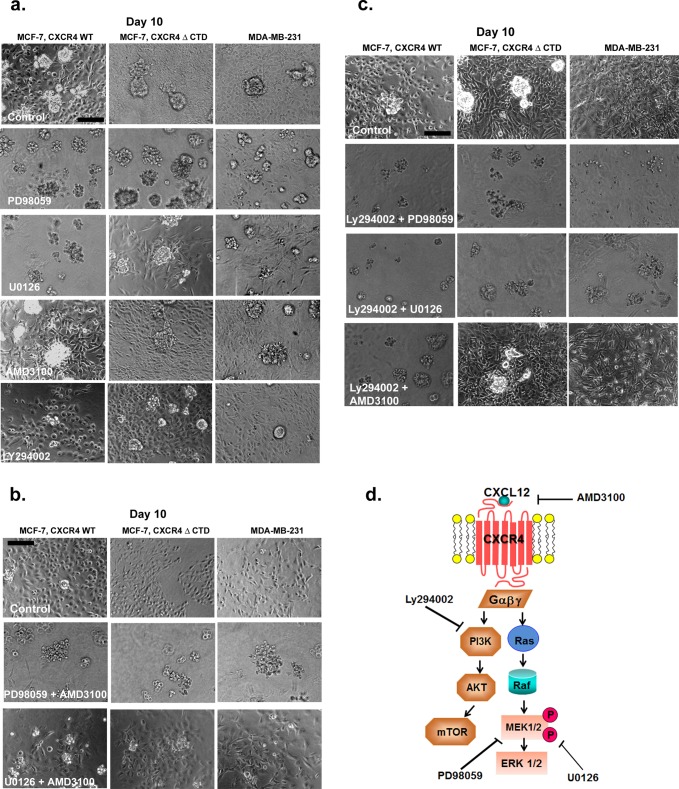
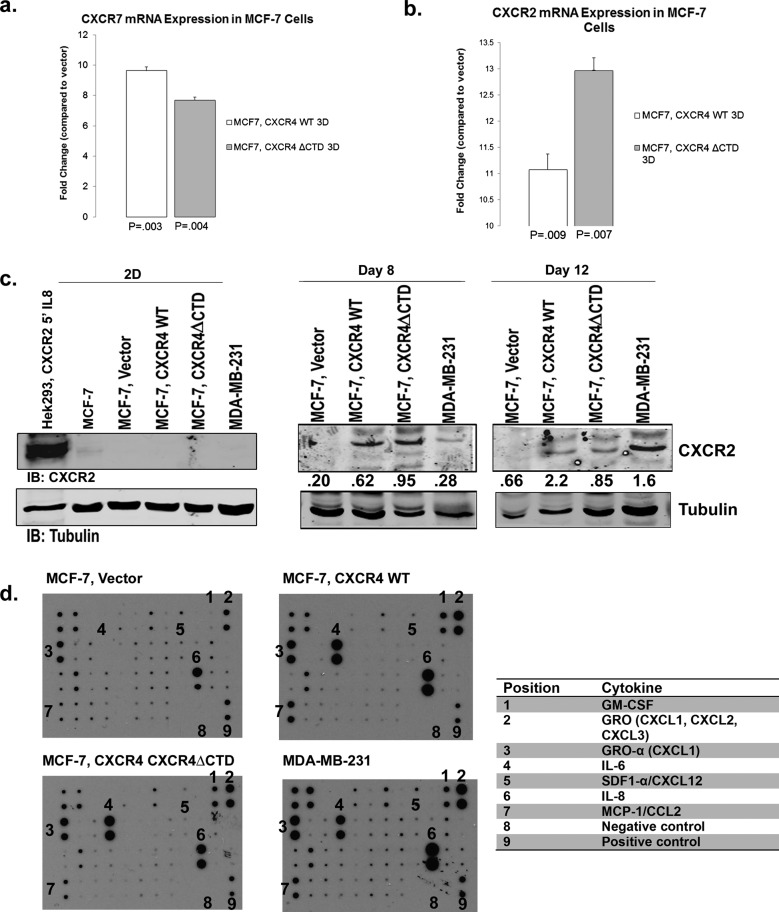
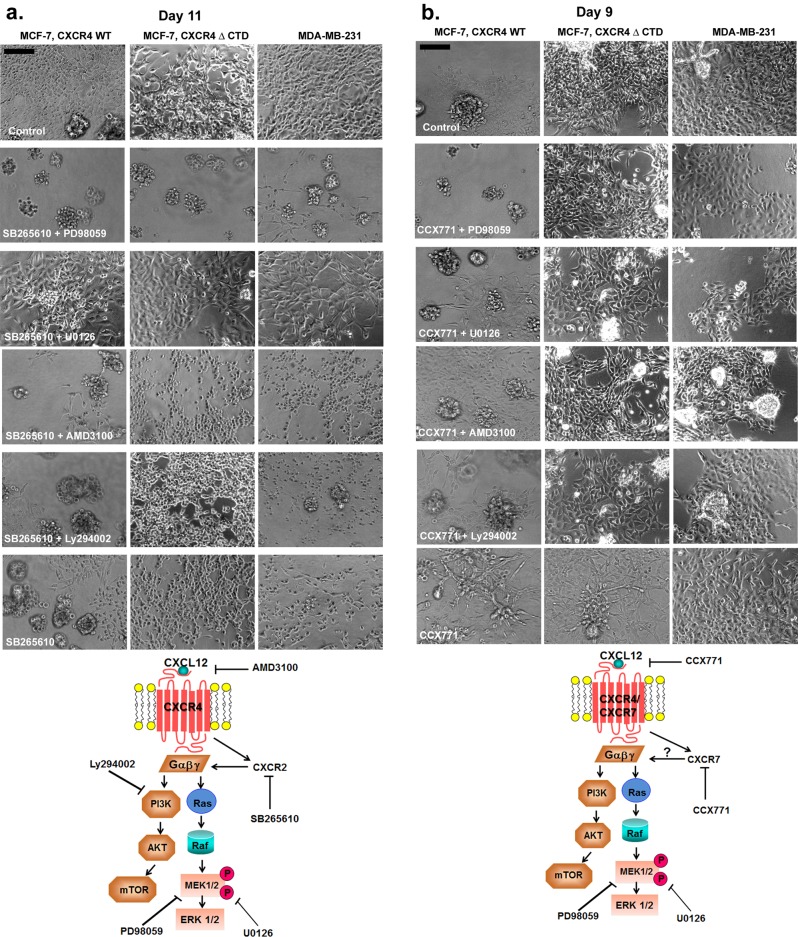
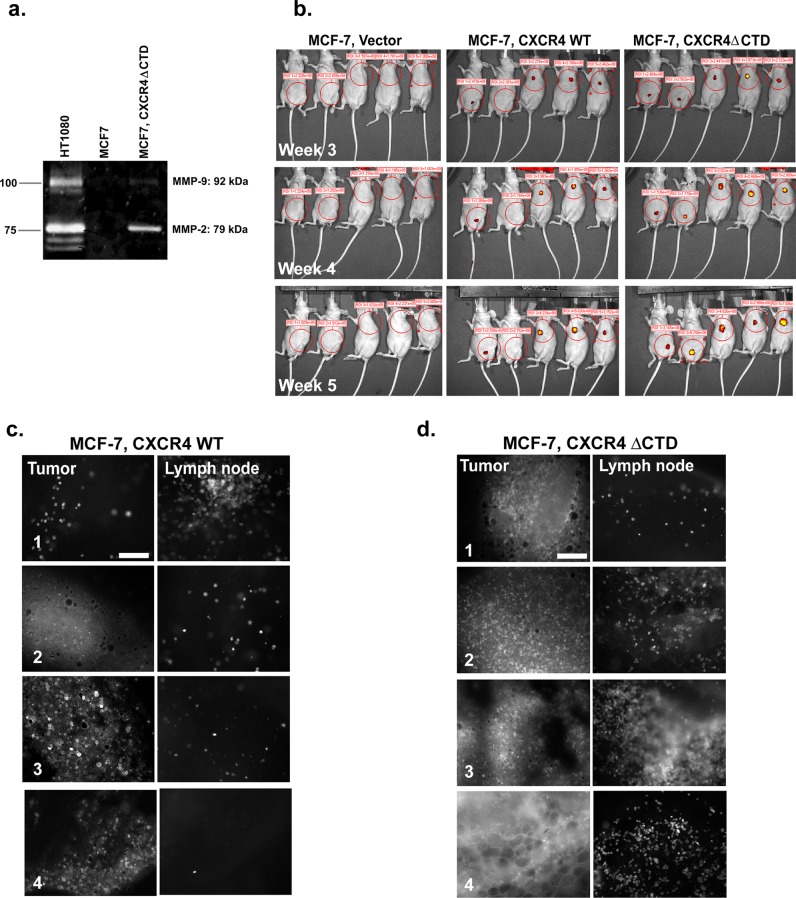
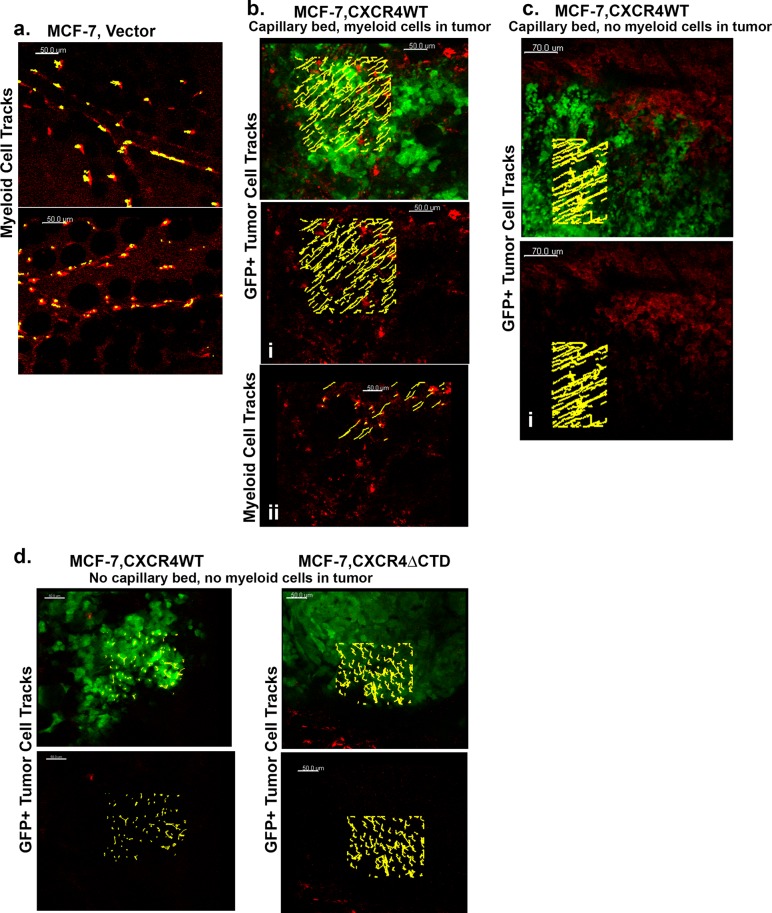
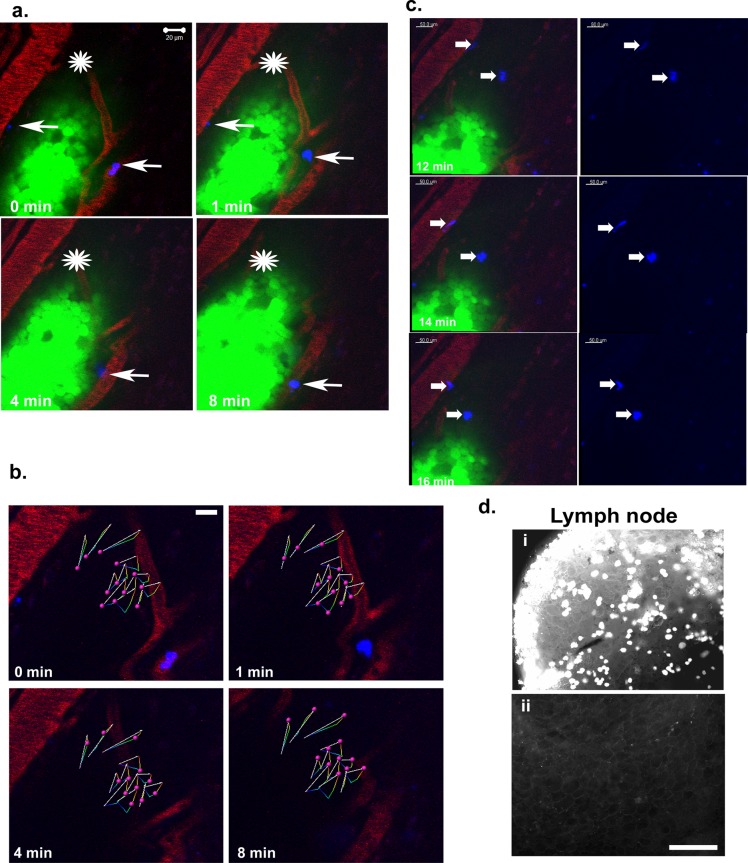
Aberrant expression of CXCR4 in human breast cancer correlates with metastasis to tissues secreting CXCL12. To understand the mechanism by which CXCR4 mediates breast cancer metastasis, MCF-7 breast carcinoma cells were transduced to express wild-type CXCR4 (CXCR4WT) or constitutively active CXCR4 (CXCR4ΔCTD) and analyzed in two-dimensional (2D) cultures, three-dimensional reconstituted basement membrane (3D rBM) cultures, and mice using intravital imaging. Two-dimensional cultures of MCF-7 CXCR4ΔCTD cells, but not CXCR4WT, exhibited an epithelial-to-mesenchymal transition (EMT) characterized by up-regulation of zinc finger E box-binding homeobox 1, loss of E-cadherin, up-regulation of cadherin 11, p120 isoform switching, activation of extracellular signal-regulated kinase 1/2, and matrix metalloproteinase-2. In contrast to the 2D environment, MCF-7 CXCR4WT cells cultured in 3D rBM exhibited an EMT phenotype, accompanied by expression of CXCR2, CXCR7, CXCL1, CXCL8, CCL2, interleukin-6, and granulocyte-macrophage colony stimulating factor. Dual inhibition of CXCR2 with CXCR4, or inhibition of either receptor with inhibitors of mitogen-activated protein kinase 1 or phosphatidylinositol 3-kinase, reversed the aggressive phenotype of MCF-7 CXCR4-expressing or MDA-MB-231 cells in 3D rBM. Intravital imaging of CXCR4-expressing MCF-7 cells revealed that tumor cells migrate toward blood vessels and metastasize to lymph nodes. Thus CXCR4 can drive EMT along with an up-regulation of chemokine receptors and cytokines important in cell migration, lymphatic invasion, and tumor metastasis.


Figures

FIGURE 1:
FIGURE 1:
Expression of CXCR4ΔCTD in MCF-7 breast carcinoma cells results in up-regulation of cadherin 11 and ZEB-1. (a) Western blot of cadherin 11 and tubulin. Densitometric scans from triplicate assays were quantitated and normalized to the loading control (tubulin). (b) Immunofluorescence staining of cadherin 11. Arrows indicate cadherin 11 localization at cell–cell contacts. Bars, 150 μm. (c) Immunofluorescence staining for colocalization of cadherin 11 and p120 and cadherin 11 and β-catenin in MCF-7 CXCR4ΔCTD and MDA-MB-231 cells. Cells were stained with mouse monoclonal anti-cadherin 11, rabbit polyclonal anti-p120, and rabbit polyclonal β-catenin antibodies and incubated with species-specific Cy3- and Cy5-conjugated secondary antibodies. Overlay images are pseudocolored; red is cadherin 11, and blue is p120 or β-catenin. Image represents a single z-section of 0.28 μm. Insets, enlarged 2× from original images. (d) Western blot of ZEB-1. Densitometric scans from triplicate assays were quantitated and normalized to the loading control (tubulin). (e) Immunofluorescence staining of ZEB-1. Bars, 150 μm.
FIGURE 2:
FIGURE 2:
MCF-7 CXCR4ΔCTD cells exhibit a stellate phenotype and MCF-7 CXCR4WT cells form predominantly stellate structures after day 8 in 3D rBM culture. (a) Colony formation in 3D rBM culture. MCF-10A, MDA-MB-231, and MCF-7 cell lines were incubated for 8 or 12 d in 3D rBM overlay cultures. Phase contrast images. Bars, 150 μm. (b) Western blot of ZEB-1, cadherin 11, and tubulin from cells grown in 3D rBM cultures at days 8 and 12. Densitometric scans from duplicate assays were quantitated and normalized to the loading control (tubulin). (c) qRT-PCR of cadherin 11 in cells from 2D or 3D rBM cultures at day 12. qRT-PCR analysis of mRNA for cadherin 11 in MCF-7 vector control, MCF-7 CXCR4WT, and MCF-7 CXCR4ΔCTD cells from 3D rBM cultures. Data are shown as the fold change in expression of MCF-7 CXCR4WT and MCF-7 CXCR4ΔCTD cells compared with vector control cells, with each gene normalized to β-actin. The difference in expression of cadherin 11 between MCF-7 CXCR4WT and MCF-7 CXCR4ΔCTD cells is statistically significant, based upon a 95% confidence interval. (d) Western blot of E-cadherin and tubulin from cells grown in 3D rBM cultures at days 8 and 12. Densitometric scans from duplicate assays were quantitated and normalized to the loading control (tubulin). (e) Western blot of pAKT473, total AKT, active MAPK, ERK2, and tubulin from cells grown in 3D rBM cultures at days 8 and 12. Densitometric scans from duplicate assays were quantitated, and pAKT473 was normalized to AKT, whereas active MAPK was normalized to ERK2.
FIGURE 3:
FIGURE 3:
Effects of small-molecule inhibitors on the growth of MCF-7 and MDA-MB-231 cells in 3D rBM cultures. (a) MCF-7 CXCR4WT, MCF-7 CXCR4ΔCTD, and MDA-MB-231 cells were seeded for 2 d and then incubated for 8 d in 3D rBM cultures in the presence of control (DMSO), the MEK1 inhibitor PD98059 (20 μM), the MEK1/2 inhibitor U0126 (10 μM), the CXCR4 inhibitor AMD3100 (40 μM), or the PI3K inhibitor Ly294002 (4 μM). Bars, 150 μm. (b) MCF-7 CXCR4WT, MCF-7 CXCR4ΔCTD, and MDA-MB-231 cells were incubated for 8 d in 3D rBM cultures in the presence of control (DMSO), PD98059 (10 μM) and AMD3100 (20 μM), or U0126 (10 μM) and AMD3100 (20 μM). Cell lines were treated with inhibitors on day 2, and inhibitors were then added to the medium on alternate days. Phase contrast images. Bars, 150 μm. (c) MCF-7 CXCR4WT, MCF-7 CXCR4ΔCTD, and MDA-MB-231 cells were incubated for 8 d in 3D rBM cultures in the presence of control (DMSO), Ly294002 (2 μM) and PD98059 (10 μM), Ly294002 (2 μM) and U0126 (10 μM), or Ly294002 (2 μM) and AMD3100 (20 μM). Cell lines were treated with inhibitors on day 2, and inhibitors were then added to the medium on alternate days. Phase contrast images. Bars, 150 μm. (d) Schematic overview of pathway inhibition.
FIGURE 4:
FIGURE 4:
CXCR7 and CXCR2 are up-regulated in MCF-7 cells expressing CXCR4WT or CXCR4∆CTD in 3D rBM cultures. qRT-PCR of CXCR7 (a) and CXCR2 (b) from cells grown in 2D or 3D rBM cultures at day 12. qRT-PCR analysis of mRNA for CXCR7 or CXCR2 in MCF-7 vector control, MCF-7 CXCR4WT, and MCF-7 CXCR4ΔCTD cells grown in 2D cultures compared with 3D rBM cultures at day 12. Data are shown as the fold change in expression of MCF-7 CXCR4WT cells and MCF-7 CXCR4ΔCTD cells compared with vector control cells for each gene normalized to the endogenous control β-actin. The difference in expression of CXCR7 and CXCR2 between MCF-7 CXCR4WT and MCF-7 CXCR4ΔCTD cells is statistically significant, based upon a 95% confidence interval. (c) Western blot of CXCR2 and tubulin in cells grown in 2D cultures compared with 3D rBM cultures at days 8 and 12. Cells in 2D culture were stimulated with interleukin-8 (IL8; 100 ng/ml) for 5 min. Densitometric scans from triplicate assays in 2D culture were quantitated and normalized to the loading control (tubulin). Cells in 3D rBM culture were not stimulated with IL8. Densitometric scans from duplicate assays in 3D rBM culture were quantitated and normalized to the loading control (tubulin). (d) Cytokine array analysis of factors identified in conditioned media from 3D rBM cultures at day 8. Antibodies are immobilized on the array in duplicate, and the table lists antibody locations, including positive and negative controls.
FIGURE 5:
FIGURE 5:
Effects of CXCR2 or CXCR7 inhibition with the combined inhibition of CXCR4, PI3K, or MAPK on the growth of MCF-7 and MDA-MB-231 cells in 3D rBM cultures. (a) MCF-7 CXCR4WT, MCF-7 CXCR4ΔCTD, and MDA-MB-231 cells were incubated for 11 d in 3D rBM cultures in the presence of control (DMSO), CXCR2 inhibitor SB265610 (1 μM) and MEK1 inhibitor PD98059 (10 μM), SB265610 (1 μM) and MEK1/2 inhibitor U0126 (10 μM), SB265610 (1 μM) and CXCR4 inhibitor AMD3100 (20 μM), SB265610 (1 μM) and PI3K inhibitor Ly294002 (2 μM), or SB265610 (1 μM) alone. Cell lines were treated with inhibitors on day 2, and inhibitors were then added to the medium on alternate days. Phase contrast images. Bars, 150 μm. (b) MCF-7 CXCR4WT, MCF-7 CXCR4ΔCTD, and MDA-MB-231 cells were incubated for 9 d in 3D rBM cultures in the presence of control (DMSO), CXCR7 inhibitor CCX771 (1 μM) and PD98059 (10 μM), CCX771 (1 μM) and U0126 (10 μM), CCX771 (1 μM) and AMD3100 (20 μM), or CCX771 (1 μM) and Ly294002 (2 μM). Cell lines were treated with inhibitors on day 2, and inhibitors were then added to the medium on alternate days. Phase contrast images. Bars, 150 μm. Schematic overviews of the pathways inhibited are shown below a and b.
FIGURE 6:
FIGURE 6:
MCF-7 CXCR4∆CTD cells express MMP-2 and both MCF-7 CXCR4∆CTD cells and MCF-7 CXCR4WT cells exhibit lymphatic metastasis. (a) Zymographic analysis of MMP-2 and MMP-9. MCF-7 and MCF-7 CXCR4ΔCTD cells were analyzed for MMP-2 and MMP-9 expression using polyacrylamide gels embedded with 0.1 mg/ml gelatin. HT1080 cells are a positive control for MMP-2 and MMP-9 activity. (b) Optical in vivo imaging of nude mice with GFP-expressing MCF-7 vector control, GFP-MCF-7 CXCR4 WT, or GFP-MCF-7 CXCR4ΔCTD tumors at 3, 4, and 5 wk after orthotopic implantation of cells into either the third or the fourth mammary gland. Encircled areas represent regions of interest for assessment of tumor growth. (c) Representative images of primary tumors and lymph node metastases of GFP-MCF-7 CXCR4WT tumors. Fluorescence microscopy of metastases from a tumor bearing GFP-MCF-7 CXCR4WT cells at the inguinal lymph node near the tumor from mouse 1 (xenograft in the fourth mammary gland) and the axillary lymph nodes near the tumor from mice 3–5 (xenograft in the third mammary gland). Tissues from tumor and lymph nodes were dissected and examined using fluorescence microscopy. Bars, 150 μm. (d) Representative images of primary tumors and lymph node metastases of GFP-MCF-7 CXCR4ΔCTD tumors. Fluorescence microscopy of metastases from a tumor bearing GFP-MCF-7 CXCR4ΔCTD cells at the inguinal lymph node near the tumor from mice 1 and 2 (xenograft in the fourth mammary gland) and the axillary lymph nodes near the tumor from mice 3 and 4 (xenograft in the third mammary gland).
FIGURE 7:
FIGURE 7:
Behavior of GFP- MCF-7 CXCR4WT and GFP- MCF-7 CXCR4ΔCTD cells in vivo. (a–d) Intravital images from a time series of GFP-MCF-7 vector, GFP-MCF-7CXCR4WT, and GFP-MCF-7 CXCR4ΔCTD cells orthotopically implanted in the absence of exogenous estrogen in the fourth mammary fat pad of athymic nude mice 2 wk before imaging. Host vasculature was labeled with 30 μl of 20 mg/ml rhodamine dextran (70 kDa), a skin flap was made to expose the mammary fat pad, and images were acquired with an LSM 510 META inverted confocal microscope with a 20×/0.75 Plan Apochromat objective. (a) GFP-MCF-7 vector tumors were not detected in mice in absence of exogenous estrogen. The GFP and Texas red channels are shown. The trajectories (yellow) of myeloid cells (red) tracked for 20 min with Bitplane Imaris are shown (Supplemental Movies S1 and S2). (b, c) MCF-7 CXCR4WT cells migrate toward blood vessels in single-cell streams. The most-displaced trajectories (yellow) of single GFP-MCF-7 CXCR4WT cells (green) and myeloid cells (red) in the tumor tracked for 20 min are shown (Supplemental Movies S3 and S4). (d) GFP-MCF-7 CXCR4WT are nonmigratory, and GFP-MCF-7 CXCR4ΔCTD cells display random migration in tumors without a vasculature. The most-displaced trajectories (yellow) of single GFP-MCF-7 CXCR4WT cells (green) and GFP-MCF-7 CXCR4ΔCTD cells (green) in the tumor tracked for 20 min are shown (Supplemental Movies S5 and S6).
FIGURE 8:
FIGURE 8:
MCF-7 CXCR4ΔCTD cells migrate toward blood vessels and metastasize to the lymph nodes. (a) Intravital images from a time series of GFP-MCF-7 CXCR4ΔCTD cells orthotopically implanted in the fourth mammary fat pad of athymic nude mice 2 wk before imaging. Differentiated HL60 cells were labeled with DiI Cy5 (blue) and injected into the vasculature via a catheter in the femoral vein. Host vasculature was labeled with 30 μl of 20 mg/ml rhodamine dextran (70 kDa), a skin flap was made to expose the mammary fat pad, and images were acquired 2 h after injection of labeled HL60 cells with an LSM 510 META inverted confocal microscope with a 40×/1.3 Plan Apochromat objective. An asterisk is placed over the area of reference to act as a landmark to identify the direction of cell movement. Differentiated HL60 cells (average of two cells in the vasculature adjacent to the tumor) labeled with DiI Cy5 (blue) are indicated by arrows. (b) The 12 most-displaced trajectories of single GFP-MCF-7 CXCR4ΔCTD cells (pink spheres) in the migrating leading edge were tracked over time with Bitplane Imaris. The arrows represent displacement of tracked cells, and colored lines are dragon tails that represent displaced trajectory of the cells tracked over time (Supplemental Movie S7). (c) Differentiated HL60 cells (average of two cells migrated in the tissue toward the tumor cells) labeled with DiI Cy5 (blue) are indicated by arrows. The dHL60 cells migrated toward the leading edge of the migrating GFP-MCF-7 CXCR4ΔCTD tumor cells over the indicated time periods. (d) GFP-MCF-7 CXCR4ΔCTD cell localization in lymph node metastasis. GFP+ tumor cells were detected in draining lymph nodes (i) but not contralateral lymph nodes (ii) of the tumor-bearing mouse. Bars, 150 μm.

Similar articles

Cited by

References

    1. Ali S, O'Boyle G, Mellor P, Kirby JA. An apparent paradox: chemokine receptor agonists can be used for anti-inflammatory therapy. Mol Immunol. 2007;44:1477–1482. - PubMed
    1. Arihiro K, Oda H, Kaneko M, Inai K. Cytokines facilitate chemotactic motility of breast carcinoma cells. Breast Cancer. 2000;7:221–230. - PubMed
    1. Asgeirsson KS, Olafsdottir K, Jonasson JG, Ogmundsdottir HM. The effects of IL-6 on cell adhesion and e-cadherin expression in breast cancer. Cytokine. 1998;10:720–728. - PubMed
    1. Balabanian K, Lagane B, Infantino S, Chow KY, Harriague J, Moepps B, Arenzana-Seisdedos F, Thelen M, Bachelerie F. The chemokine SDF-1/CXCL12 binds to and signals through the orphan receptor RDC1 in T lymphocytes. J Biol Chem. 2005a;280:35760–35766. - PubMed
    1. Balabanian K, et al. WHIM syndromes with different genetic anomalies are accounted for by impaired CXCR4 desensitization to CXCL12. Blood. 2005b;105:2449–2457. - PubMed

Publication types

MeSH terms