Genome-wide identification of long noncoding natural antisense transcripts and their responses to light in Arabidopsis
- PMID: 24402519
- PMCID: PMC3941109
- DOI: 10.1101/gr.165555.113
Genome-wide identification of long noncoding natural antisense transcripts and their responses to light in Arabidopsis
Abstract
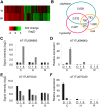
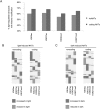
Recent research on long noncoding RNAs (lncRNAs) has expanded our understanding of gene transcription regulation and the generation of cellular complexity. Depending on their genomic origins, lncRNAs can be transcribed from intergenic or intragenic regions or from introns of protein-coding genes. We have recently reported more than 6000 intergenic lncRNAs in Arabidopsis. Here, we systematically identified long noncoding natural antisense transcripts (lncNATs), defined as lncRNAs transcribed from the opposite DNA strand of coding or noncoding genes. We found a total of 37,238 sense-antisense transcript pairs and 70% of annotated mRNAs to be associated with antisense transcripts in Arabidopsis. These lncNATs could be reproducibly detected by different technical platforms, including strand-specific tiling arrays, Agilent custom expression arrays, strand-specific RNA-seq, and qRT-PCR experiments. Moreover, we investigated the expression profiles of sense-antisense pairs in response to light and observed spatial and developmental-specific light effects on 626 concordant and 766 discordant NAT pairs. Genes for a large number of the light-responsive NAT pairs are associated with histone modification peaks, and histone acetylation is dynamically correlated with light-responsive expression changes of NATs.
Figures


Similar articles
-
Small RNAs and the regulation of cis-natural antisense transcripts in Arabidopsis.BMC Mol Biol. 2008 Jan 14;9:6. doi: 10.1186/1471-2199-9-6. BMC Mol Biol. 2008. PMID: 18194570 Free PMC article.
-
Global identification of Arabidopsis lncRNAs reveals the regulation of MAF4 by a natural antisense RNA.Nat Commun. 2018 Nov 29;9(1):5056. doi: 10.1038/s41467-018-07500-7. Nat Commun. 2018. PMID: 30498193 Free PMC article.
-
Protein-coding cis-natural antisense transcripts have high and broad expression in Arabidopsis.Plant Physiol. 2013 Apr;161(4):2171-80. doi: 10.1104/pp.112.212100. Epub 2013 Mar 1. Plant Physiol. 2013. PMID: 23457227 Free PMC article.
-
Natural antisense transcripts as versatile regulators of gene expression.Nat Rev Genet. 2024 Oct;25(10):730-744. doi: 10.1038/s41576-024-00723-z. Epub 2024 Apr 17. Nat Rev Genet. 2024. PMID: 38632496 Review.
-
Long Noncoding RNAs in Plants.Adv Exp Med Biol. 2017;1008:133-154. doi: 10.1007/978-981-10-5203-3_5. Adv Exp Med Biol. 2017. PMID: 28815539 Free PMC article. Review.
Cited by
-
First insights into the nature and evolution of antisense transcription in nematodes.BMC Evol Biol. 2016 Aug 22;16(1):165. doi: 10.1186/s12862-016-0740-y. BMC Evol Biol. 2016. PMID: 27549405 Free PMC article.
-
Plant Long Noncoding RNAs: New Players in the Field of Post-Transcriptional Regulations.Noncoding RNA. 2021 Feb 17;7(1):12. doi: 10.3390/ncrna7010012. Noncoding RNA. 2021. PMID: 33671131 Free PMC article. Review.
-
In plants, decapping prevents RDR6-dependent production of small interfering RNAs from endogenous mRNAs.Nucleic Acids Res. 2015 Mar 11;43(5):2902-13. doi: 10.1093/nar/gkv119. Epub 2015 Feb 18. Nucleic Acids Res. 2015. PMID: 25694514 Free PMC article.
-
Natural antisense transcripts of MIR398 genes suppress microR398 processing and attenuate plant thermotolerance.Nat Commun. 2020 Oct 22;11(1):5351. doi: 10.1038/s41467-020-19186-x. Nat Commun. 2020. PMID: 33093449 Free PMC article.
-
Plant Noncoding RNAs: Hidden Players in Development and Stress Responses.Annu Rev Cell Dev Biol. 2019 Oct 6;35:407-431. doi: 10.1146/annurev-cellbio-100818-125218. Epub 2019 Aug 12. Annu Rev Cell Dev Biol. 2019. PMID: 31403819 Free PMC article. Review.
References
Publication types
MeSH terms
Substances
Associated data
- Actions
- Actions
- Actions
LinkOut - more resources
Full Text Sources
Other Literature Sources
Molecular Biology Databases
