. 2014 Mar;34(6):1003-19.
doi: 10.1128/MCB.00940-13. Epub 2014 Jan 6.

SH2B1β interacts with STAT3 and enhances fibroblast growth factor 1-induced gene expression during neuronal differentiation

Affiliations

SH2B1β interacts with STAT3 and enhances fibroblast growth factor 1-induced gene expression during neuronal differentiation

Yu-Jung Chang et al. Mol Cell Biol. 2014 Mar.

Abstract

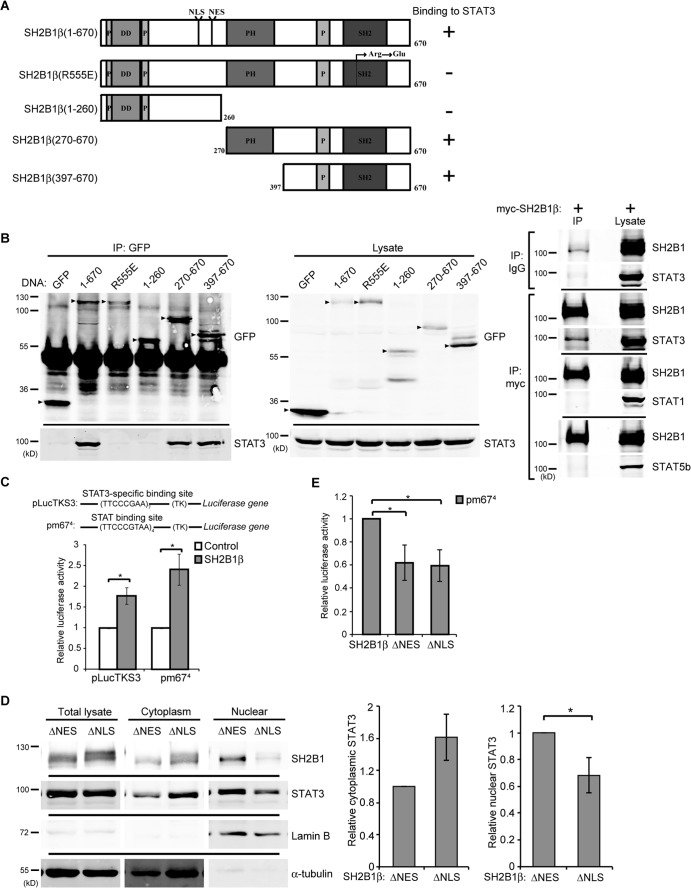
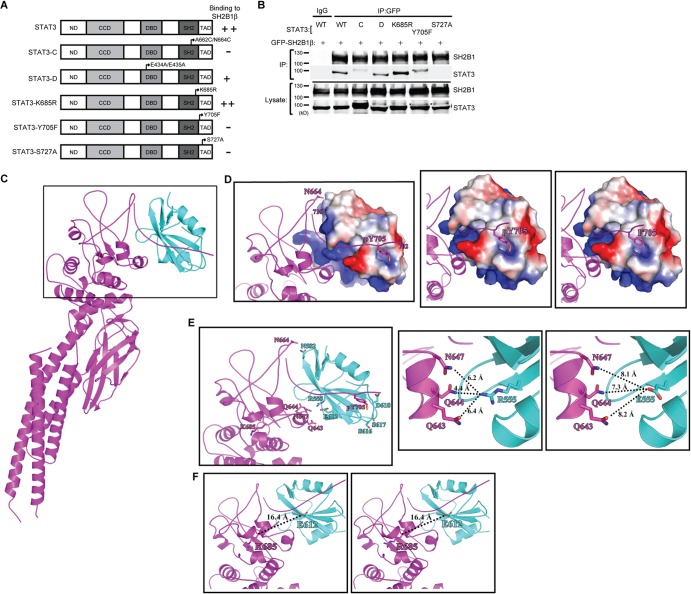
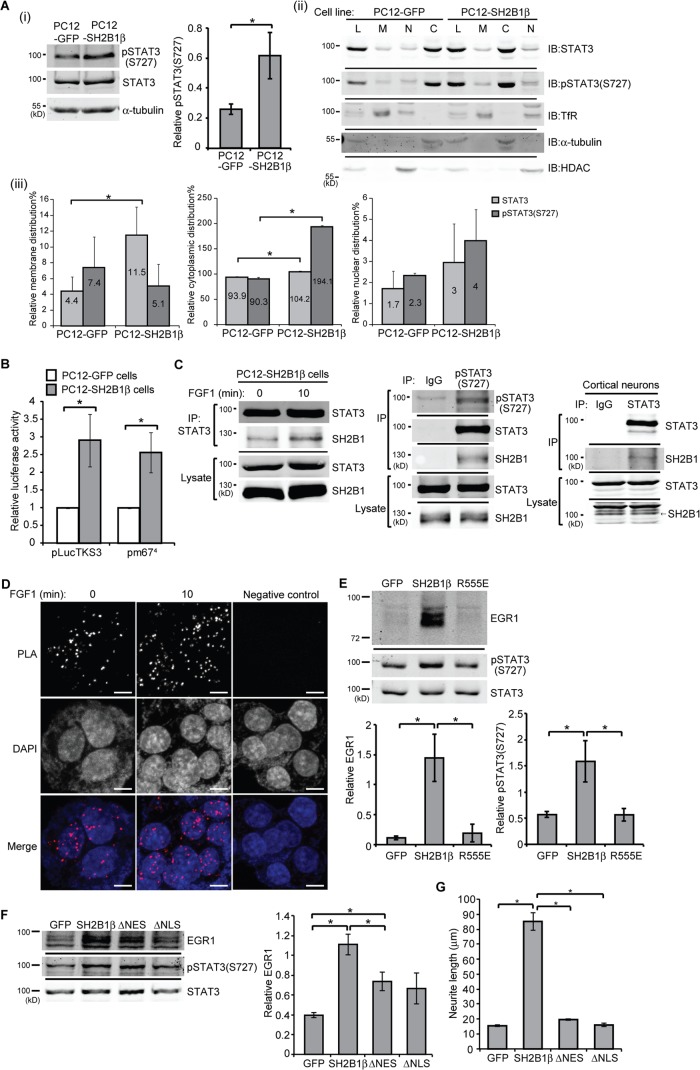
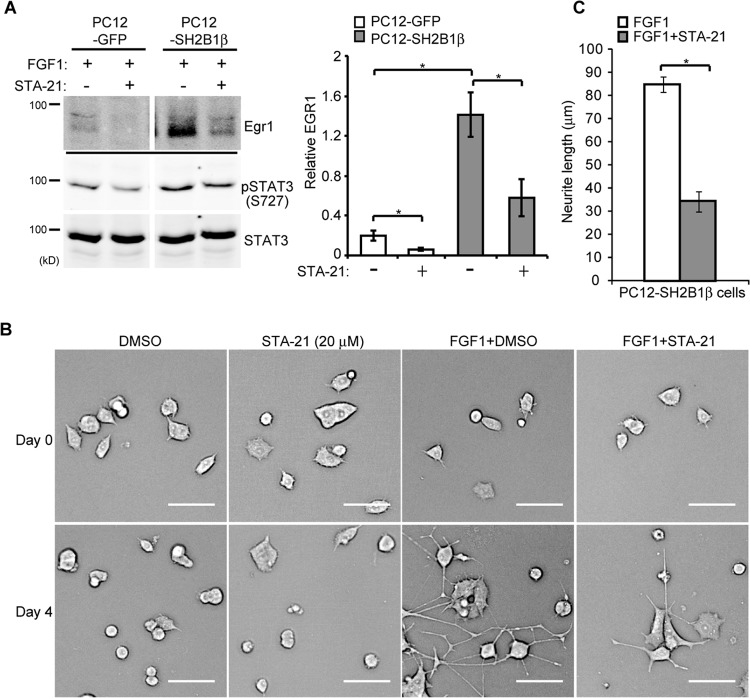
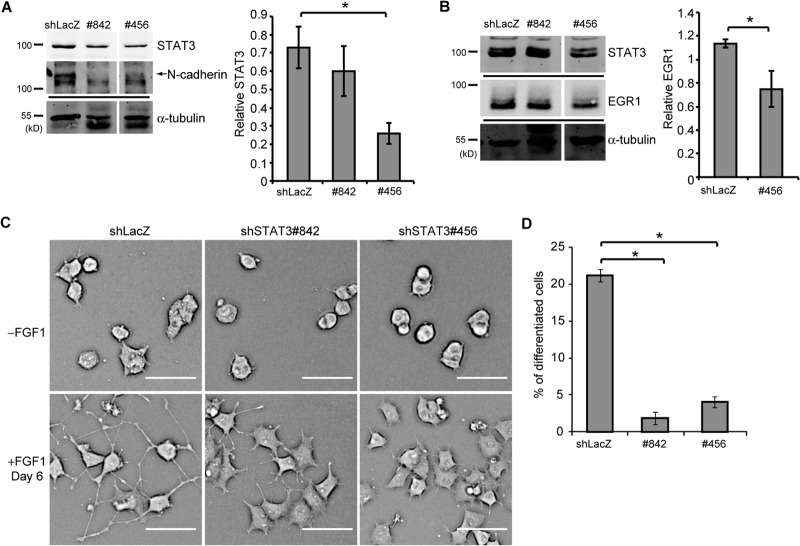
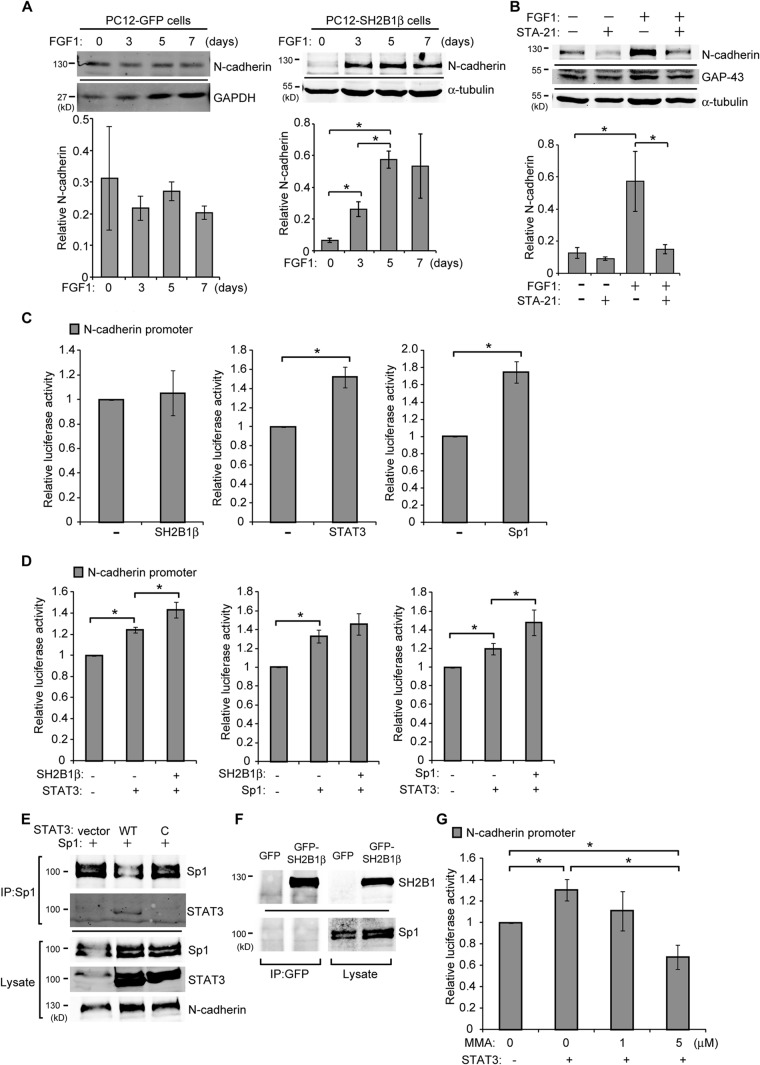
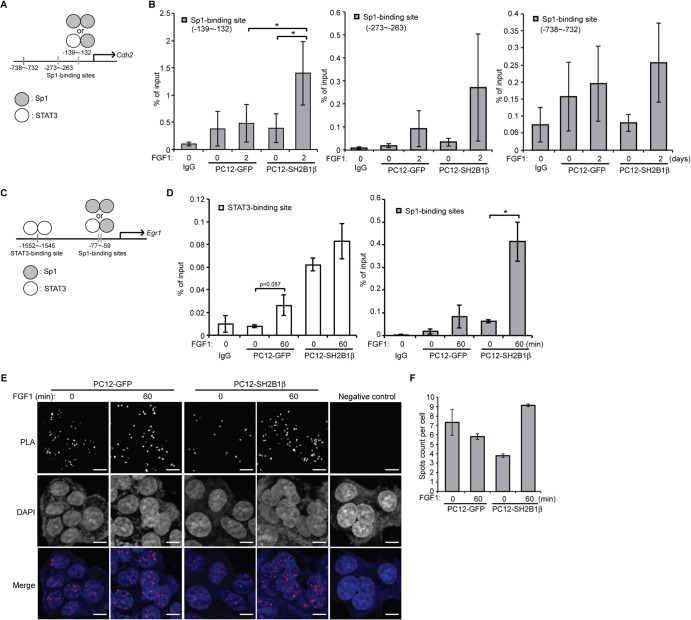
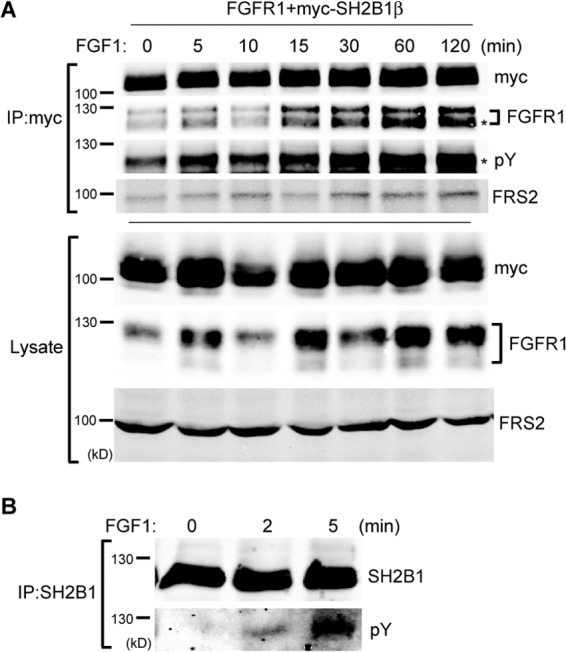
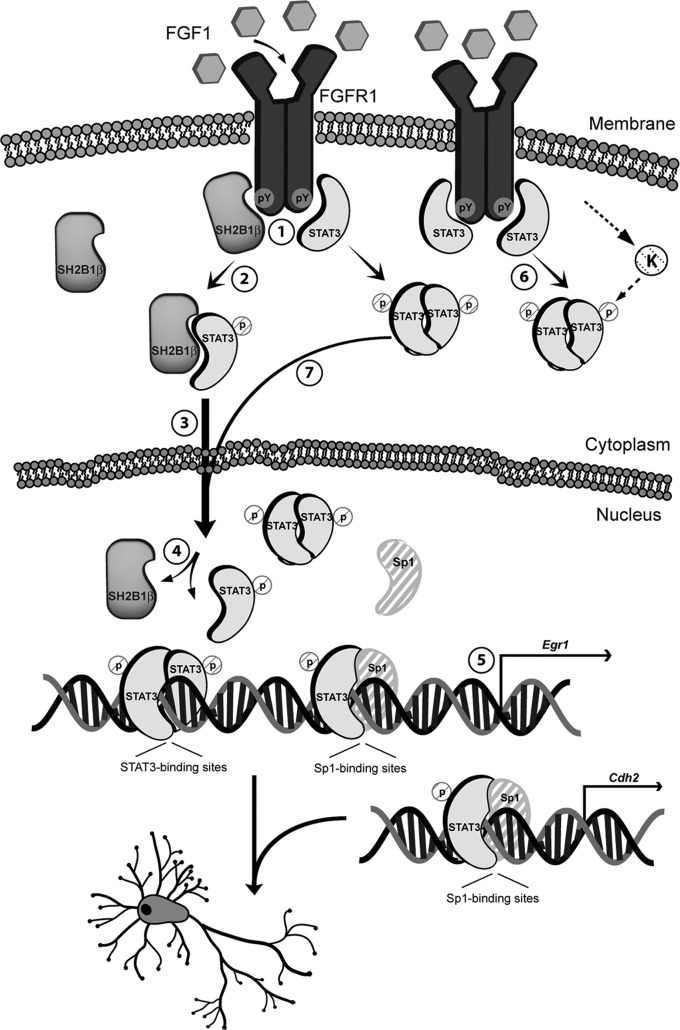
Neurite outgrowth is an essential process during neuronal differentiation as well as neuroregeneration. Thus, understanding the molecular and cellular control of neurite outgrowth will benefit patients with neurological diseases. We have previously shown that overexpression of the signaling adaptor protein SH2B1β promotes fibroblast growth factor 1 (FGF1)-induced neurite outgrowth (W. F. Lin, C. J. Chen, Y. J. Chang, S. L. Chen, I. M. Chiu, and L. Chen, Cell. Signal. 21:1060-1072, 2009). SH2B1β also undergoes nucleocytoplasmic shuttling and regulates a subset of neurotrophin-induced genes. Although these findings suggest that SH2B1β regulates gene expression, the nuclear role of SH2B1β was not known. In this study, we show that SH2B1β interacts with the transcription factor, signal transducer, and activator of transcription 3 (STAT3) in neuronal PC12 cells, cortical neurons, and COS7 fibroblasts. By affecting the subcellular distribution of STAT3, SH2B1β increased serine phosphorylation and the concomitant transcriptional activity of STAT3. As a result, overexpressing SH2B1β enhanced FGF1-induced expression of STAT3 target genes Egr1 and Cdh2. Chromatin immunoprecipitation assays further reveal that, in response to FGF1, overexpression of SH2B1β promotes the in vivo occupancy of STAT3-Sp1 heterodimers at the promoter of Egr1 and Cdh2. These findings establish a central role of SH2B1β in orchestrating signaling events to transcriptional activation through interacting and regulating STAT3-containing complexes during neuronal differentiation.


Figures

FIG 1
FIG 1
SH2B1β interacts with STAT3. (A) Domains of SH2B1β and SH2B1β deletion mutants. SH2B1β contains three proline-rich domains (P), a dimerization domain (DD), a nuclear localization signal (NLS), a nuclear export sequence (NES), a PH domain, and an SH2 domain. SH2B1β(R555E) is a dominant-negative mutant with a point mutation of arginine to glutamic acid at residue 555. (B) COS7 cells were transiently transfected with GFP, GFP-SH2B1β(1-670), GFP-SH2B1β(R555E), GFP-SH2B1β(1-260), GFP-SH2B1β(270-670), and GFP-SH2B1β(390-670) (left). Cell lysates were immunoprecipitated using anti-GFP antibody and resolved via SDS-PAGE followed by immunoblotting with anti-GFP and anti-STAT3 antibodies. Arrowheads indicate the overexpressed proteins. Cell lysates from COS7 cells expressing myc-SH2B1β were immunoprecipitated using anti-IgG or anti-myc antibody and resolved with SDS-PAGE, followed by immunoblotting using antibodies against STAT3, STAT1, STAT5b, and SH2B1. (C) COS7 cells were transiently cotransfected with vector only or myc-SH2B1β along with plasmid containing STAT3- or STAT-binding sequences fused to firefly luciferase (pLucTKS3 or pm674) and pEGFP. Cells were harvested, and the firefly luciferase activity was measured and normalized to pEGFP levels. Values are the means ± standard errors of the means (SEM) from three independent experiments. (D) COS7 cells were transiently transfected with GFP-SH2B1β(ΔNES) or GFP-SH2B1β(ΔNLS). Cell lysates were fractionated and immunoblotted with anti-STAT3 and anti-SH2B1 antibodies. α-Tubulin was used as a marker for the cytoplasmic fraction and lamin B as a marker for the nuclear fraction. Cytoplasmic STAT3 was normalized to cytoplasmic α-tubulin, and nuclear STAT3 was normalized to nuclear lamin B levels. Values are means ± SEM from three independent experiments. (E) COS7 cells were transiently transfected with GFP-SH2B1β, GFP-SH2B1β(ΔNES), or GFP-SH2B1β(ΔNLS) along with pm674 and a Renilla luciferase plasmid. The firefly luciferase activities were normalized to the corresponding Renilla luciferase activities. Values are the means ± SEM from three independent experiments. *, P < 0.05 by paired Student's t test.
FIG 2
FIG 2
Interaction between SH2B1β and STAT3 depends on STAT3 phosphorylation. (A) Domains of STAT3 and STAT3 mutant constructs. (B) PC-3 cells were transiently transfected with GFP-SH2B1β along with STAT3, STAT3-C-FLAG, HA-STAT3-D, STAT3-K685R, STAT3-Y705F, or STAT3-S727A (designated WT, C, D, K685R, Y705F, and S727A). Lysates were immunoprecipitated using anti-IgG or anti-GFP antibody and resolved with SDS-PAGE followed by immunoblotting using antibodies against SH2B1 and STAT3. Representative blots are shown from four independent experiments. Arrowheads indicate the STAT3 protein. An asterisk indicates the nonspecific bands. (C) The overall complex model contains the SH2 domain of SH2B1β (in cyan; PDB code 2HDX) and STAT3β (in magenta; PDB code 1BG1). A higher-magnification view of the boxed region is shown in panels D and E. (D) STAT3 is shown as a magenta ribbon, and the surface electrostatic potential of SH2B1β is also shown. The first (702) and last (716) residues of the phosphotyrosyl tail segment of STAT3 are numbered. N664 and pY705, which are involved in STAT3-SH2B1β complex formation, are shown as sticks (left). The phosphorylated tyrosine of STAT3 provides a negative charge to interact with SH2B1β (middle). The interaction is likely disrupted in the Y705F mutant due to the loss of the negative charge of the phosphate group (right). (E) The residues involved in SH2B1β-STAT3 interaction are shown (left). SH2B1β and STAT3 are shown as cyan and magenta ribbons, respectively. R555 of SH2B1β is surrounded by polar residues Q643, Q644, and N647 at a distance of 4 to 6 Å (middle). The distance is increased to 7 to 8 Å as R555 is mutated to glutamic acid (right). (F) SH2B1β and STAT3 are shown in cyan and magenta ribbons, respectively. The location of K685 of STAT3 is relatively far away from the interacting interface with 16.4 Å relative to E612, the nearest residue of SH2B1β (left). The distance is not affected after the K685 residue was replaced by arginine (right).
FIG 3
FIG 3
SH2B1β enhances S727 phosphorylation and transcriptional activity of STAT3. (Ai) Cell lysates from PC12 cells that stably expressed GFP or GFP-SH2B1β were collected, and an equal amount of proteins from each was separated by SDS-PAGE and immunoblotted (IB) with anti-pSTAT3(S727) and anti-STAT3 antibodies. α-Tubulin was used as a loading control. Expression of pSTAT3(S727) was normalized to total STAT3 levels. Values are the means ± SEM from five independent experiments. (Aii and iii) Cell lysates from PC12-GFP and PC12-SH2B1β cells were separated by subcellular fractionation. Samples were resolved by SDS-PAGE and immunoblotted with anti-STAT3 and anti-pSTAT3(S727). Transferrin receptor (TfR) was used as a membrane (M) fraction marker, α-tubulin was used as a cytoplasmic (C) fraction marker, and histone deacetylase (HDAC) was used as a nuclear (N) fraction marker. L, total cell lysate. The relative level of a fraction marker was the level of the marker in a fraction divided by the level in total cell lysate. The relative level of the indicated protein was the level of the indicated protein in a fraction times the relative level of a fraction marker. Values are means ± SEM from three independent experiments. (B) PC12-GFP and PC12-SH2B1β cells were transiently transfected with pLucTKS3 or pm674 and a Renilla luciferase plasmid. Cells were harvested 18 h later, and firefly luciferase activities were measured. The firefly luciferase activities were normalized to the corresponding Renilla luciferase activities. Values are the means ± SEM from at least three independent experiments. (C) PC12-SH2B1β cells were incubated in serum-free medium overnight before being left untreated or treated with 100 ng/ml FGF1 plus 10 μg/ml heparin for 10 min. Cell lysates were immunoprecipitated using anti-IgG, anti-STAT3, or anti-pSTAT3(S727) antibody. Immunoprecipitated complexes were resolved with SDS-PAGE followed by immunoblotting using antibodies against STAT3, SH2B1, and pSTAT3(S727). Primary cortical neurons from E18 mice were cultured in vitro for 7 days (DIV 7). Lysates were immunoprecipitated using anti-IgG or anti-STAT3 antibody and immunoblotted with anti-STAT3 and anti-SH2B1 antibodies. (D) PC12-SH2B1β cells were incubated in serum-free medium overnight before being left untreated or treated with 100 ng/ml FGF1 for 10 min. Primary rabbit anti-GFP and mouse anti-STAT3 antibodies were combined with Duolink PLA mouse minus and PLA rabbit plus probes. Cells incubated with Duolink PLA probes only served as a negative control. Images were taken using an LSM 780 confocal fluorescence microscope. The SH2B1β-STAT3 complexes were detected as spots of PLA signal. Nuclear material was stained by DAPI. Scale bar, 5 μm. Representative images are shown from two independent experiments. (E) PC12-GFP, PC12-SH2B1β, and PC12-SH2B1β(R555E) cells were incubated in serum-free medium overnight and then were treated with 100 ng/ml FGF1 for 2 h. Cell lysates were collected, and equal amounts of proteins were separated by SDS-PAGE and immunoblotted with anti-EGR1, anti-pSTAT3(S727), and anti-STAT3 antibodies. The expression levels of EGR1 and pSTAT3(S727) were normalized to total STAT3. Values are the means ± SEM from three independent experiments. (F) PC12-GFP, PC12-SH2B1β, PC12-SH2B1β(ΔNES), and PC12-SH2B1β(ΔNLS) cells were incubated in serum-free medium overnight and then treated with 100 ng/ml FGF1 for 2 h. Cell lysates were collected, and equal amounts of proteins were resolved by SDS-PAGE and immunoblotted with anti-EGR1, anti-pSTAT3(S727), and anti-STAT3 antibodies. Expression of EGR1 was normalized to total STAT3 levels. Values are means ± SEM from three independent experiments. (G) PC12-GFP, PC12-SH2B1β, PC12-SH2B1β(ΔNES), and PC12-SH2B1β(ΔNLS) cells were treated with 100 ng/ml FGF1 for 4 days. The average neurite length on differentiation day 4 was calculated from three independent experiments. *, P < 0.05 by paired Student's t test.
FIG 4
FIG 4
Inhibiting STAT3 activity reduces SH2B1β-enhanced EGR1 expression and neurite outgrowth. (A) PC12-GFP and PC12-SH2B1β cells were incubated in serum-free medium overnight before being treated with DMSO (−) or with the STAT3 inhibitor STA-21 (20 μM) (+) for 24 h, and then 100 ng/ml FGF1 was added for 2 h. Cell lysates were collected, and equal amounts of proteins were separated by SDS-PAGE and immunoblotted with anti-EGR1, anti-pSTAT3(S727), and anti-STAT3 antibodies. EGR1 expression was normalized to STAT3 levels. Values are the means ± SEM from three independent experiments. (B) PC12-SH2B1β cells were preincubated with DMSO or 20 μM STA-21 for 1 h and then were left untreated or treated with 100 ng/ml FGF1 for 4 days. Live-cell images are shown. Scale bar, 50 μm. (C) The average neurite length of PC12-SH2B1β cells on differentiation day 4 was calculated from three independent experiments. *, P < 0.05 by paired Student's t test.
FIG 5
FIG 5
STAT3 is required for SH2B1β-enhanced gene expression during neuronal differentiation. (A) PC12-SH2B1β cell lines that stably expressed shLacZ or one of the shSTAT3 constructs (842 and 456) were established. Cell lysates were collected, and equal amounts of proteins were separated by SDS-PAGE and immunoblotted with anti-STAT3 and anti-N-cadherin antibodies. α-Tubulin was used as a loading control. The arrow points to the N-cadherin band. The level of STAT3 was normalized to α-tubulin. Values are the means ± SEM from four independent experiments. (B) Cells like those described for panel A were incubated in serum-free medium overnight and then treated with 100 ng/ml FGF1 for 2 h. Cell lysates were collected and immunoblotted with anti-STAT3 and anti-EGR1 antibodies. α-Tubulin was used as a loading control. The level of EGR1 was normalized to α-tubulin. Values are the means ± SEM from four independent experiments. (C) Cells like those described for panel A were treated with 100 ng/ml FGF1 for 6 days. Live-cell images are shown. Scale bar, 50 μm. (D) The percentage of differentiated cells was calculated from three independent experiments. *, P < 0.05 by paired Student's t test.
FIG 6
FIG 6
SH2B1β regulates Cdh2 promoter activity through STAT3 and Sp1. (A) PC12-GFP and PC12-SH2B1β cells were treated with 100 ng/ml FGF1 for the indicated number of days. Cell lysates were collected, and equal amounts of proteins were separated by SDS-PAGE and immunoblotted with anti-N-cadherin, anti-GAPDH, and anti-α-tubulin antibodies. GAPDH or α-tubulin was used as a loading control. The level of N-cadherin was normalized to GADPH or α-tubulin. Values of PC12-GFP cells are the means ± standard deviations from two independent experiments, and values of PC12-SH2B1β cells are the means ± SEM from three independent experiments. (B) PC12-SH2B1β cells were preincubated with DMSO or STA-21 (20 μM) for 1 h and then were left untreated or treated with 100 ng/ml FGF1 for 4 days. Cell lysates were analyzed by Western blotting using anti-N-cadherin and anti-GAP-43 antibodies. α-Tubulin was used as a loading control. The level of N-cadherin was normalized to α-tubulin. Values are the means ± SEM from three independent experiments. (C) PC-3 cells were transiently transfected with SH2B1β, STAT3, or Sp1 together with Cdh2 promoter sequences fused to firefly luciferase and pEGFP. Cells were harvested 18 h later, and luciferase activities were measured. Firefly luciferase activities were normalized to pEGFP levels. (D) PC-3 cells were transiently cotransfected with SH2B1β ± STAT3 (left), SH2B1β ± Sp1 (middle), or STAT3 ± Sp1 (right), together with the Cdh2 promoter construct and pEGFP. Cells were harvested at 18 h, and luciferase activities were analyzed as described for panel C. (E) PC-3 cells were transiently transfected with Sp1 along with vector control, STAT3, and STAT3-C-FLAG (designated WT and C). Cell lysates were extracted and immunoprecipitated using anti-Sp1 antibody and analyzed by Western blotting using antibodies against Sp1, STAT3, and N-cadherin. (F) PC-3 cells were transiently transfected with GFP or GFP-SH2B1β plasmid. Cell lysates were immunoprecipitated using anti-GFP antibody and analyzed by Western blotting using antibodies against SH2B1 and Sp1. (G) PC-3 cells were left untransfected or were transiently transfected with STAT3 plus Cdh2 reporter constructs and pEGFP. Cells were treated with 0, 1, or 5 μM MMA for 18 h and then were harvested for luciferase activity measurements. Firefly luciferase activities were normalized to pEGFP levels. Values in panels C, D, and G are means ± SEM from three independent experiments. *, P < 0.05 by paired Student's t test.
FIG 7
FIG 7
SH2B1β enhances in vivo STAT3-Sp1 occupancy at the Cdh2 and Egr1 promoter. (A) Diagram of the Cdh2 promoter region containing three Sp1-binding sites. (B) PC12-GFP and PC12-SH2B1β cells were incubated in serum-free medium overnight before 100 ng/ml FGF1 treatment for 2 days. Cells were cross-linked, followed by ChIP analysis using either anti-IgG or anti-STAT3 antibody for immunoprecipitation. The immunoprecipitated DNA was analyzed by qPCR with specific primers flanking three Sp1-binding sites within the Cdh2 promoter. Values are the means ± SEM from four independent experiments. (C) Diagram of the Egr1 promoter region containing the STAT3-binding site or Sp1-binding sites. (D) PC12-GFP and PC12-SH2B1β cells were incubated in serum-free medium overnight before 100 ng/ml FGF1 treatment for 1 h. Cells were cross-linked, followed by ChIP analysis using either anti-IgG or anti-STAT3 antibody for immunoprecipitation. The immunoprecipitated DNA was analyzed by qPCR with specific primers flanking the STAT3-binding site or Sp1-binding site within the Egr1 promoter. Values are the means ± SEM from three independent experiments. *, P < 0.05 by paired Student's t test. (E) PC12-GFP and PC12-SH2B1β cells were incubated in serum-free medium overnight before being left untreated or treated with 100 ng/ml FGF1 for 1 h. Primary mouse anti-STAT3 and rabbit anti-Sp1 antibodies were combined with Duolink PLA mouse minus and PLA rabbit plus probes. Cells incubated with Duolink PLA probes only served as the negative control. Images were taken using an LSM 780 confocal fluorescence microscope. The STAT3-Sp1 heterodimers were detected as spots of PLA signal. Nuclear material was stained by DAPI. Scale bar, 5 μm. (F) Quantification of PLA spots counted by Blobfinder software and calculated from two independent experiments. Values are means ± standard deviations.
FIG 8
FIG 8
SH2B1β interacts with FGFR1. (A) COS7 cells were transiently transfected with rat FGFR1 and myc-SH2B1β. Cells were incubated in serum-free medium overnight before being treated with 100 ng/ml FGF1 plus 10 μg/ml heparin for the indicated times. Cell lysates were immunoprecipitated using anti-myc antibody and resolved with SDS-PAGE, followed by immunoblotting using antibodies against FGFR1, myc, phosphotyrosine (pY), and FRS2. An asterisk indicates matching molecular sizes. (B) PC12-SH2B1β cells were incubated in serum-free medium overnight before being treated with 100 ng/ml FGF1 for the indicated times. Cell lysates were immunoprecipitated using anti-SH2B1 antibody and resolved with SDS-PAGE followed by immunoblotting using antibodies against SH2B1 and phosphotyrosine to determine FGF1-induced tyrosine phosphorylation of SH2B1β.
FIG 9
FIG 9
Schematic model of how SH2B1β enhances gene expression and neuronal differentiation through STAT3 (step 1). After FGF1 stimulation, SH2B1β and STAT3 interact with FGFR1 (step 2). SH2B1β subsequently interacts with STAT3 (step 3) and transports STAT3 to the nucleus (step 4). SH2B1β and STAT3 dissociate, followed by the formation of STAT3-STAT3 dimers and/or STAT3-Sp1 heterodimers, both of which bind to the promoter regions of differentiation genes, such as Egr1 (step 5) and Cdh2 (step 6). In a parallel pathway, phosphorylated STAT3 forms a homodimer and shuttles to the nucleus in response to FGF1 stimulation (step 7). SH2B1β may regulate a putative serine kinase (K) that phosphorylates STAT3. Solid line, known pathways or pathways identified in this study; dashed line, putative steps.

Similar articles

Cited by

References

    1. Hashimoto M, Sagara Y, Langford D, Everall IP, Mallory M, Everson A, Digicaylioglu M, Masliah E. 2002. Fibroblast growth factor 1 regulates signaling via the glycogen synthase kinase-3beta pathway. Implications for neuroprotection. J. Biol. Chem. 277:32985–32991. 10.1074/jbc.M202803200 - DOI - PubMed
    1. Allen SJ, Dawbarn D. 2006. Clinical relevance of the neurotrophins and their receptors. Clin. Sci. 110:175–191. 10.1042/CS20050161 - DOI - PubMed
    1. Iwata T, Hevner RF. 2009. Fibroblast growth factor signaling in development of the cerebral cortex. Dev. Growth Differ. 51:299–323. 10.1111/j.1440-169X.2009.01104.x - DOI - PubMed
    1. McAllister AK. 2001. Neurotrophins and neuronal differentiation in the central nervous system. Cell. Mol. Life Sci. 58:1054–1060. 10.1007/PL00000920 - DOI - PMC - PubMed
    1. Baird A. 1994. Fibroblast growth factors: activities and significance of non-neurotrophin neurotrophic growth factors. Curr. Opin. Neurobiol. 4:78–86. 10.1016/0959-4388(94)90035-3 - DOI - PubMed

Publication types

MeSH terms