. 2014 Jan 21;111(3):930-5.
doi: 10.1073/pnas.1316312111. Epub 2014 Jan 6.

TRAIL-coated leukocytes that kill cancer cells in the circulation

Affiliations

TRAIL-coated leukocytes that kill cancer cells in the circulation

Michael J Mitchell et al. Proc Natl Acad Sci U S A. .

Abstract

Metastasis through the bloodstream contributes to poor prognosis in many types of cancer. Mounting evidence implicates selectin-based adhesive interactions between cancer cells and the blood vessel wall as facilitating this process, in a manner similar to leukocyte trafficking during inflammation. Here, we describe a unique approach to target and kill colon and prostate cancer cells in the blood that causes circulating leukocytes to present the cancer-specific TNF-related apoptosis inducing ligand (TRAIL) on their surface along with E-selectin adhesion receptor. This approach, demonstrated in vitro with human blood and also in mice, mimics the cytotoxic activity of natural killer cells and increases the surface area available for delivery of the receptor-mediated signal. The resulting "unnatural killer cells" hold promise as an effective means to neutralize circulating tumor cells that enter blood with the potential to form new metastases.

Keywords: drug delivery; nanomedicine.


Conflict of interest statement

The authors declare no conflict of interest.

Figures
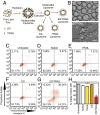
Fig. 1.
Fig. 1.
ES/TRAIL liposomes adhesively interact with and kill cancer cells under uniform shear flow. (A) Synthesis of ES, TRAIL, and ES/TRAIL unilamellar liposomes using a thin film hydration method. Briefly, lipids in chloroform were dried overnight to form a thin lipid film. Lipids were then hydrated and subjected to freeze–thaw cycles to form multilamellar liposomes, which were extruded through membranes to form unilamellar liposomes. ES, TRAIL, or a combination of ES and TRAIL was then conjugated to Ni-NTA on the liposome surface. To assess the ability of ES/TRAIL liposomes to target and kill cancer cells under flow, ES/TRAIL liposomes were added to a suspension of COLO 205 cancer cells and exposed to shear flow in a cone-and-plate viscometer at a shear rate of 188 s−1 for 2 h. Cells were then removed, washed, placed into culture for 24 h, and assessed for cell viability. (B) COLO 205 morphology after treatment with ES (Upper) and ES/TRAIL (Lower) liposomes under shear flow. (Scale bar, 20 µm.) (CG) Representative propidium iodide/Annexin-V flow cytometry plots of unsheared cancer cells (C) and cells sheared with naked (D), TRAIL-bound (E), ES-bound (F), and ES/TRAIL-bound liposomes (G) under shear flow. Cells were classified into four categories based on dye uptake: viable cells [negative for Annexin-V and propidium iodide (PI)], early apoptotic cells (positive for Annexin-V only), late apoptotic cells (positive for Annexin-V and PI), and necrotic cells (positive for PI only). (H) Percent of viable cells after treatment for each group. n = 3 for all samples. Bars represent the mean ± SD in each treatment group. ***P < 0.0001 (one-way ANOVA with Tukey posttest).
Fig. 2.
Fig. 2.
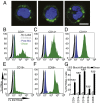
ES/TRAIL liposomes adhere to multiple leukocyte subpopulations after exposure to shear flow in whole blood. (A) Confocal images of ES/TRAIL liposomes (green) bound to human leukocytes (blue, cell nuclei) after exposure to shear flow in whole blood in a cone-and-plate viscometer at 188 s−1 for 30 min. Leukocytes have nuclear morphology characteristic of monocytes (Left), lymphocytes (Center), and neutrophils (Right). (Scale bar, 5 μm.) (BG) To assess the adhesion of ES/TRAIL liposomes to leukocyte subpopulations, fluorescent ES/TRAIL liposomes were added to human blood and exposed to shear flow in a cone-and-plate viscometer at a shear rate of 188 s−1 for 30 min. Leukocytes were isolated from blood using a Polymorphs density gradient and labeled with CD3, CD14, CD16, CD19, and CD56, which is typically expressed on T lymphocytes, monocytes, neutrophils, B-lymphocytes, and natural killer cells, respectively. Expression of fluorescent ES/TRAIL (FL ES/TRAIL) liposomes on the surface of leukocytes that are CD3+ (B), CD14+ (C), CD16+ (D), CD19+ (E), and CD56+ (F), determined using flow cytometry. Expression of CD3, CD14, CD16, CD19, and CD56 on the leukocyte surface was determined using isotype controls. No label, unsheared cells that were not treated with fluorescent ES/TRAIL liposomes; ES Block, cells treated with fluorescent ES/TRAIL liposomes that were pretreated with an ES functional blocking antibody; Post-Mix, cells labeled with fluorescent ES/TRAIL liposomes immediately after mixing liposomes in whole blood. (G) Percent of CD3+, CD14+, CD16+, CD19+, and CD56+ leukocytes adhered to ES/TRAIL liposomes. n = 3 for all samples. Bars represent the mean ± SD in each treatment group. ***P < 0.0001 (one-way ANOVA with Tukey posttest).
Fig. 3.
Fig. 3.
ES/TRAIL liposome therapeutic effects are enhanced in human blood under flow in vitro. (A) Flow cytometry of COLO 205 cancer cells after treatment with ES/TRAIL or ES liposomes in blood under shear flow in a cone-and-plate viscometer at 188 s−1 for 2 h. Unsheared, viable untreated cancer cell control. (B) Representative flow cytometry histogram showing the number of viable cancer cells collected. (C) Representative micrographs of COLO 205 cells (white) in blood when treated with ES/TRAIL (Left) and ES only (Right) liposomes in blood under shear flow. (Scale bar, 50 μm.) (D) Number of viable COLO 205 and PC-3 cells per volume of blood after treatment with ES/TRAIL or ES liposomes in blood under shear flow. n = 3 for all samples. Bars represent the mean ± SD in each treatment group. **P < 0.001, ***P < 0.0001 (unpaired t test). (E) Comparison of fraction of COLO 205 and PC-3 cells that remained viable after treatment with ES/TRAIL liposomes in buffer versus blood. n = 3 for all samples. Bars represent the mean ± SD in each treatment group. ***P < 0.0001 (unpaired t test). (F) Fraction of COLO 205 and PC-3 cells that remained viable after treatment with ES/TRAIL liposomes in blood with varying percentages of normal hematocrit. Hematocrit was varied whereas other blood components remained constant, based on a normal hematocrit of 45%. Plasma indicates removal of all blood cells. n = 3 for all samples. Bars represent the mean ± SD in each treatment group. *P < 0.05 (one-way ANOVA with Tukey posttest).
Fig. 4.
Fig. 4.
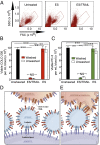
ES/TRAIL liposomes functionalize leukocytes under shear flow in vitro to target and kill cancer cells. (A) Flow cytometry plots of COLO 205 cells in untreated samples (Left) and when treated in human blood with ES (Center) or ES/TRAIL (Right) functionalized leukocytes (but no unbound liposomes) under shear flow. (B and C) Number of viable COLO 205 (B) and PC-3 (C) cells per volume of blood after treatment with leukocytes functionalized with ES/TRAIL or ES liposomes, but with no unbound liposomes, in human blood (Washed), or after treatment with ES or ES/TRAIL liposomes in blood (Unwashed). n = 3 for all samples. Bars represent the mean ± SD in each treatment group. **P < 0.001, ***P < 0.0001 (unpaired t test). (D and E) Schematic of the two-step mechanism involving decoration of leukocytes with liposomes (D), which then contact circulating cancer cells and activate the death receptor (E).
Fig. 5.
Fig. 5.
ES/TRAIL functionalized leukocytes target and kill cancer cells in the circulation of mice in vivo. (A) Schematic of in vivo mouse experiment. (B) Flow cytometry of untreated COLO 205 cancer cells (Left) and those recovered from cardiac puncture from mice treated with ES (Center) and ES/TRAIL liposomes (Right). (C) Number of viable cancer cells recovered per volume of mouse blood for mice treated with ES/TRAIL liposomes, soluble TRAIL (sTRAIL), ES liposomes, and buffer injections. n = 3 for all samples. Bars represent the mean ± SD in each treatment group. *P < 0.01, **P < 0.001, ***P < 0.0001 (one-way ANOVA with Tukey posttest). (D) Representative micrographs of COLO 205 cells removed from circulation in mice treated with ES/TRAIL liposomes (Upper Left), sTRAIL (Upper Right), ES liposomes (Lower Left), and buffer (Lower Right) injections. (Scale bar, 20 μm.) (E) Leukocytes functionalized with fluorescent ES/TRAIL liposomes (green) upon removal from mouse circulation 2.5 h after injection. (Scale bar, 50 μm.)
Fig. 6.
Fig. 6.
Decreased number and increased apoptosis in COLO 205 cells lodged in mouse lung after treatment with ES/TRAIL liposomes. (A) Schematic of mouse lung and example two-photon excited fluorescence (2PEF) image stack from mouse lung where Hoechst-labeled COLO 205 cells (green) are arrested in lung tissue (visible by autofluorescence, yellow). (Scale bar, 80 µm.) (B) The 2PEF images of Hoescht-labeled COLO 205 cells (green) with Alexa Flour 568-labeled Annexin-V apoptosis probe (red) for each experimental group. Red arrows point to apoptotic COLO 205 cells (red and green colocalized), and blue arrows indicate nonapoptotic COLO 205 cells (green only). White circles indicate regions of autofluorescence from lung tissue. (Scale bar, 30 µm.) (C) Density of COLO 205 cells lodged in the lung for each experimental group. (D) Percentage of lodged COLO 205 cells positive for Annexin-V probe for each experimental group. Individual data points represent data from one image stack, with points shown in the same color representing image stacks from the same animal. Superimposed box plots bound the 25th to 75th percentage of all data points and the whiskers extend 1.5 times the interquartile range beyond the boxes. The horizontal lines within the boxplot represent the median. n = 3 animals for each experimental group. *P < 0.01, **P < 0.0001 (one-way ANOVA with Tukey posttest).

Similar articles

Cited by

References

    1. Chaffer CL, Weinberg RA. A perspective on cancer cell metastasis. Science. 2011;331(6024):1559–1564. - PubMed
    1. Riethdorf S, Wikman H, Pantel K. Review: Biological relevance of disseminated tumor cells in cancer patients. Int J Cancer. 2008;123(9):1991–2006. - PubMed
    1. Maheswaran S, Haber DA. Circulating tumor cells: A window into cancer biology and metastasis. Curr Opin Genet Dev. 2010;20(1):96–99. - PMC - PubMed
    1. Coussens LM, Werb Z. Inflammation and cancer. Nature. 2002;420(6917):860–867. - PMC - PubMed
    1. McDonald B, et al. Systemic inflammation increases cancer cell adhesion to hepatic sinusoids by neutrophil mediated mechanisms. Int J Cancer. 2009;125(6):1298–1305. - PubMed

Publication types

MeSH terms