. 2014 Jan;10(1):e1003845.
doi: 10.1371/journal.ppat.1003845. Epub 2014 Jan 2.

Suppression of interferon lambda signaling by SOCS-1 results in their excessive production during influenza virus infection

Affiliations

Suppression of interferon lambda signaling by SOCS-1 results in their excessive production during influenza virus infection

Haitao Wei et al. PLoS Pathog. 2014 Jan.

Erratum in

Abstract

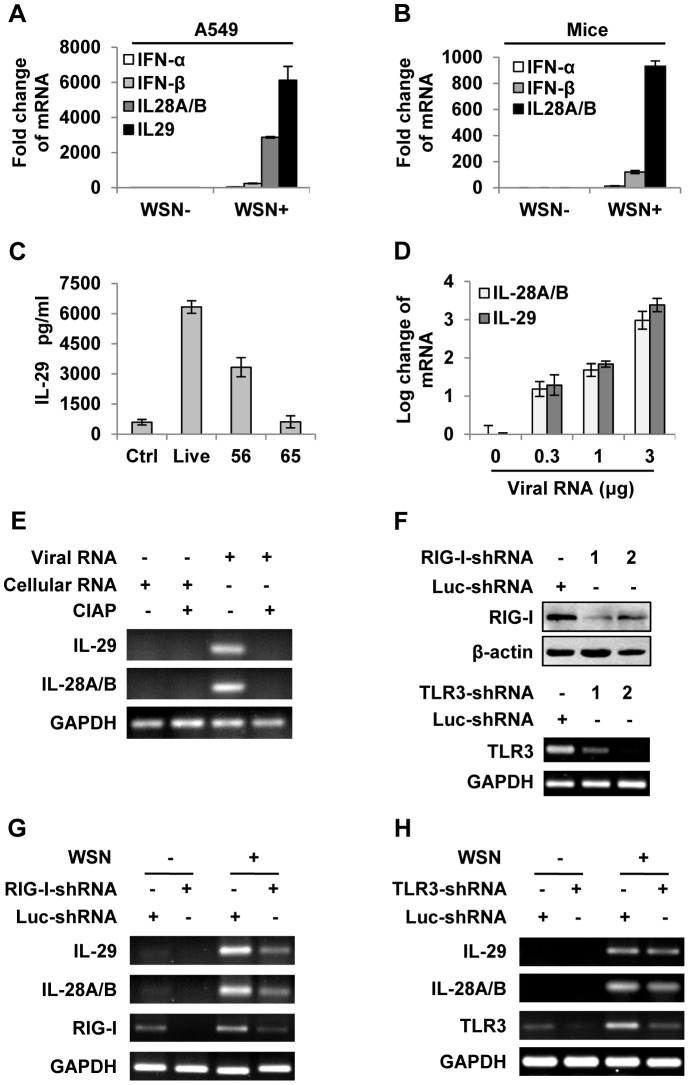
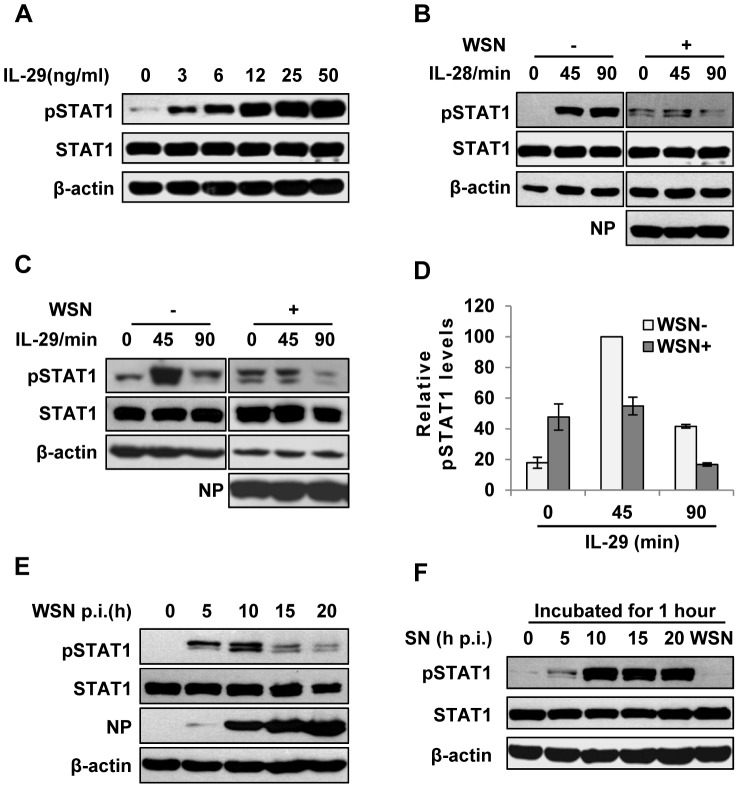
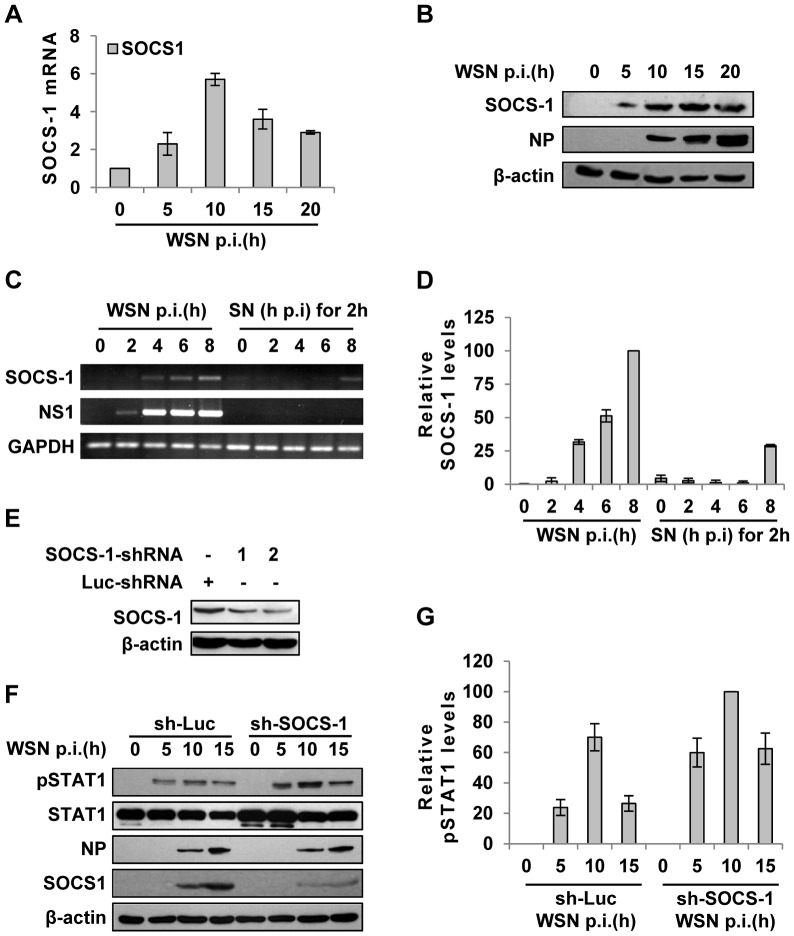
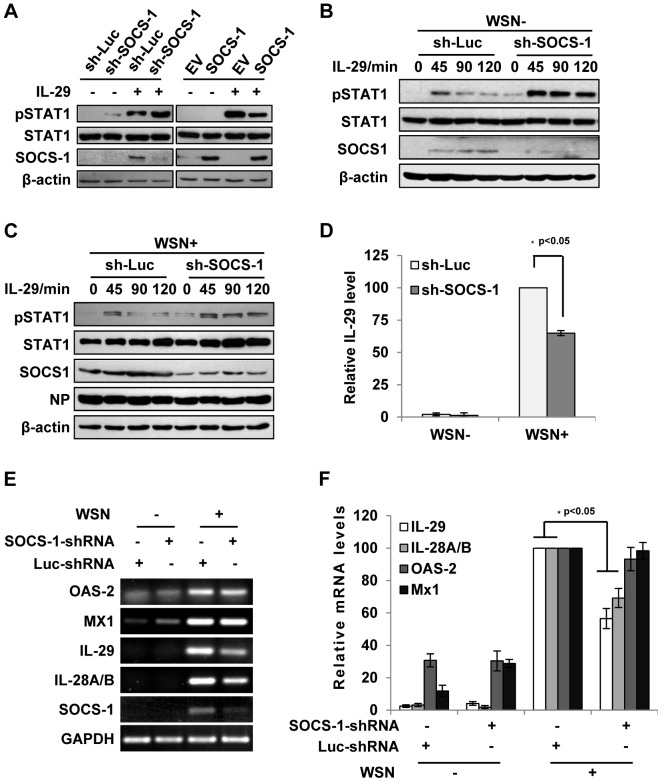
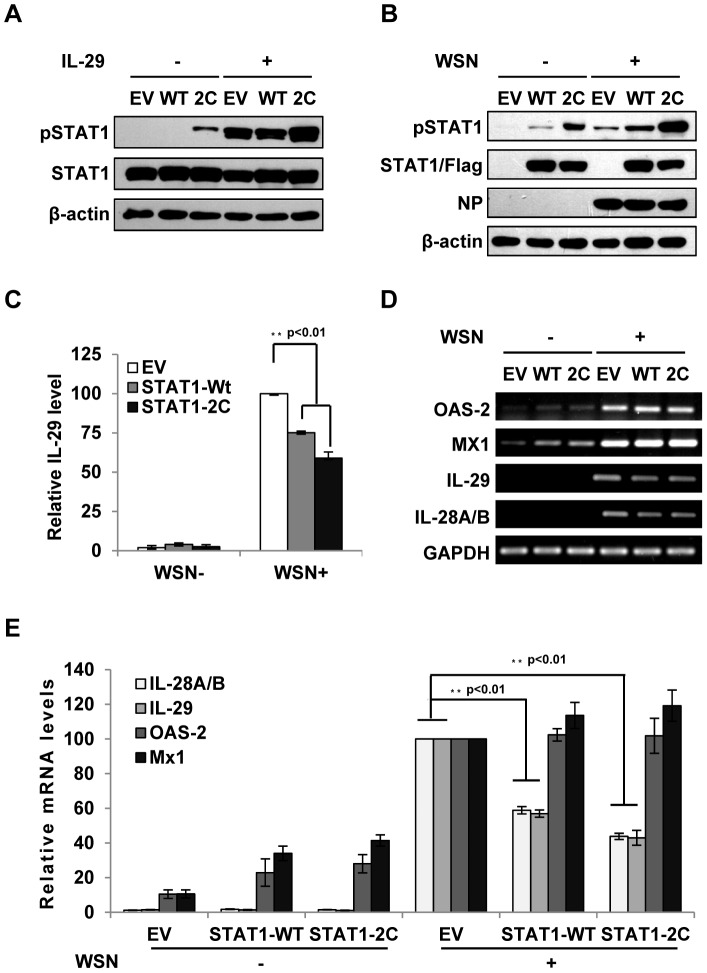
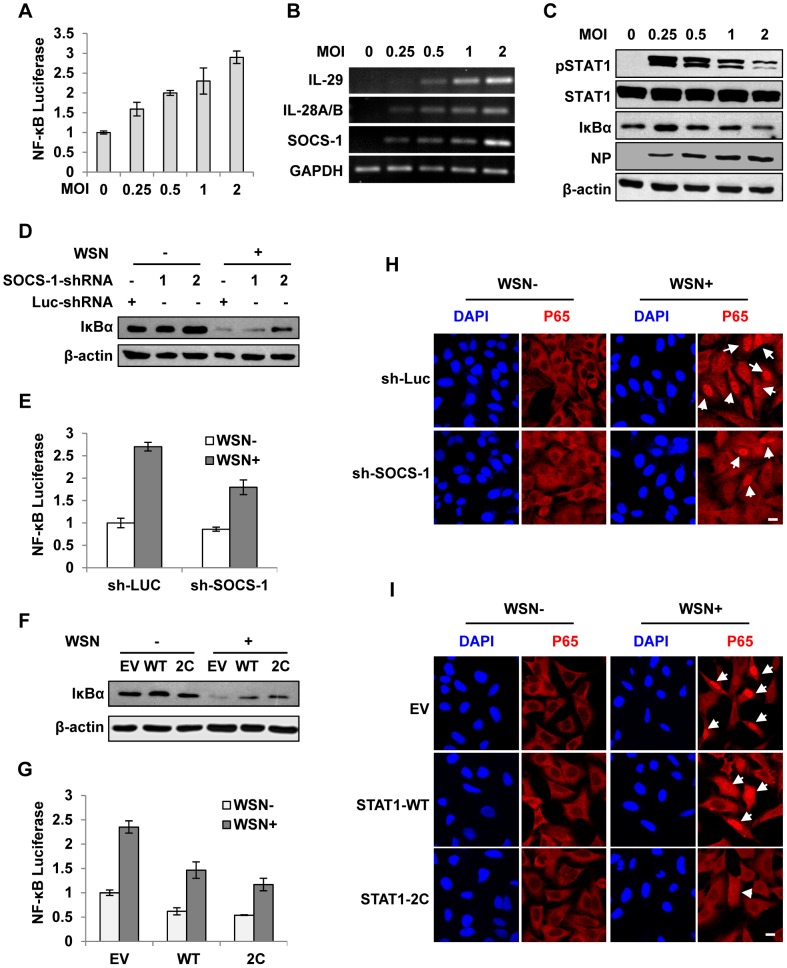
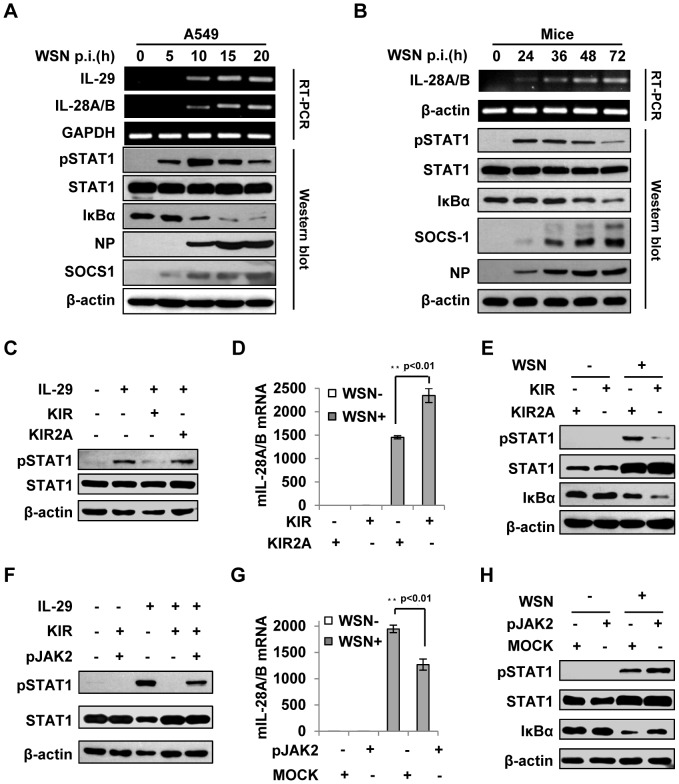
Innate cytokine response provides the first line of defense against influenza virus infection. However, excessive production of cytokines appears to be critical in the pathogenesis of influenza virus. Interferon lambdas (IFN-λ) have been shown to be overproduced during influenza virus infection, but the precise pathogenic processes of IFN-λ production have yet to be characterized. In this report, we observed that influenza virus induced robust expression of IFN-λ in alveolar epithelial cells (A549) mainly through a RIG-I-dependent pathway, but IFN-λ-induced phosphorylation of the signal transducer and activator of transcription protein 1 (STAT1) was dramatically inhibited in the infected cells. Remarkably, influenza virus infection induced robust expression of suppressor of cytokine signaling-1 (SOCS-1), leading to inhibition of STAT1 activation. Interestingly, the virus-induced SOCS-1 expression was cytokine-independent at early stage of infection both in vitro and in vivo. Using transgenic mouse model and distinct approaches altering the expression of SOCS-1 or activation of STAT signaling, we demonstrated that disruption of the SOCS-1 expression or expression of constitutively active STAT1 significantly reduced the production of IFN-λ during influenza virus infection. Furthermore, we revealed that disruption of IFN-λ signaling pathway by increased SOCS-1 protein resulted in the activation of NF-κB and thereby enhanced the IFN-λ expression. Together, these data imply that suppression of IFN-λ signaling by virus-induced SOCS-1 causes an adaptive increase in IFN-λ expression by host to protect cells against the viral infection, as a consequence, leading to excessive production of IFN-λ with impaired antiviral response.


Conflict of interest statement

The authors have declared that no competing interests exist.

Figures

Figure 1
Figure 1. IAV infection induces robust expression of IFN-λ in alveolar epithelial cells mainly through a RIG-I-dependent pathway.
(A) A549 cells infected with or without WSN virus (MOI = 1) for 15 h, mRNA levels of IFN-α, β and λ were examined by real-time PCR. (B) BALB/c mice were infected intranasally with or without WSN virus (1×10⁵ PFU). On day 3 p.i., lungs were lysed, and the mRNA levels of IFN-α, β and λ were examined by real-time PCR. (C) A549 cells were uninfected (Ctrl) or infected with WSN that was untreated (Live) or treated at 56°C or 65°C. IL-29 levels in supernatants from A549 cells at 15 h p.i. were measured by ELISA. (D) Different amounts of total RNA (“Viral RNA”) from A549 cells infected with the IAV were transfected into native A549 cells using Lipofectamine 2000 (L2000). Expression of IL-28A/B and IL-29 in transfected A549 cells was examined by real-time PCR at 4 h p.i. (E) “Viral RNA” and “Cellular RNA” (total RNA from uninfected control A549 cells) treated with or without calf intestine alkaline phosphatase (CIAP) were transfected into native A549 cells. RT-PCR was performed to examine the expression of IL-28A/B and IL-29. (F) shRNA based-knockdown of RIG-I and TLR3 were analyzed by Western blotting or RT-PCR to determine the interference efficiency. (G–H) A549 cells expressing shRNAs targeting RIG-I (G), TLR3 (H) or luciferase (Luc) were infected with or without WSN, and then the expression of IL-28A/B and IL-29 was examined by RT-PCR. Results are representative of three independent experiments.
Figure 2
Figure 2. IAV inhibits IL-29-induced STAT1 phosphorylation in A549 cells.
(A) A549 cells were treated with IL-29 at final concentration of 3, 6, 12, 25, and 50 ng/ml for 45 min, followed by immunoblotting with indicated antibodies. (B, C) A549 cells infected with WSN (MOI = 1) for 15 h (WSN+) or non-infected (WSN−) were stimulated with human IL-28A (B) or IL-29 (50 ng/ml) (C) for indicated time. Cell lysates were analyzed by Western blotting using indicated antibodies. (D) Levels of phosphorylated STAT1 in (C) were quantitated by densitometry, and normalized to STAT1 expression and control β-actin levels. In each experiment, the highest level of STAT1 phosphorylation is 100. Plotted are the average levels from three independent experiments. The error bars represent the S.E. (E) A549 cells were infected with WSN (MOI = 1), lysed at the 0, 5, 10, 15 and 20 h p.i., and analyzed by Western blotting using indicated antibodies. (F) A549 cells were either stimulated by supernatant (SN) culture medium from IAV-infected cells in (E) or infected with WSN for 1 h, followed by Western blotting with indicated antibodies.
Figure 3
Figure 3. IAV infection induces robust expression of SOCS-1, resulting in decreased phosphorylation of STAT1.
(A) Quantitative real-time RT-PCR was performed to examine the expression of SOCS-1 in A549 infected with WSN for indicated time. (B) Lysates from cells in (A) were analyzed for the protein levels of SOCS-1, as detected by Western blotting with indicated antibodies. (C) A549 cells were infected by WSN for indicated time. Supernatants (SN) derived from these cells were used to stimulate the native A549 for 2 h. Both infected cells and supernatants-stimulated cells were lysed and analyzed for SOCS-1 expression by RT-PCR. (D) SOCS-1 levels in (C) were quantitated by densitometry, and normalized to GAPDH levels as described in Figure 2D. Plotted are the average levels from three independent experiments. The error bars represent the S.E. (E) A549 cells expressing shRNAs targeting either SOCS-1 or control luciferase (Luc) were infected with WSN for 15 h. Western blotting was performed to determine the interference efficiency. Treatment with SOCS-1-shRNA#2 caused approximately 75% reduction in SOCS-1 expression quantitated by densitometry. Thus, SOCS-1-shRNA#2 was used in this study. (F) SOCS-1-ablated or control A549 cells were infected with WSN for the indicated time. Cell lysates were analyzed by Western blot probed with the antibodies as indicated. (G) Levels of phosphorylated STAT1 in (F) were quantitated by densitometry, and normalized to control β-actin levels as described in Figure 2D. Plotted are the average levels from three independent experiments. The error bars represent the S.E.
Figure 4
Figure 4. Inhibition of cytokine-mediated STAT1 activation by SOCS-1 contributes to overproduction of IFN-λ during IAV infection.
(A) A549 cells expressing SOCS-1, empty vector (EV) or shRNAs targeting SOCS-1 or luciferase (Luc) were treated with or without IL-29 (50 ng/ml) for 45 min. Cell lysates were analyzed by Western blotting using indicated antibodies. (B, C) Luc or SOCS-1 knockdown A549 cells were infected without (B) or with (C) WSN virus for 15 h and then treated with IL-29 for indicated time. Shown are immunoblots of the cell lysates probed with indicated antibodies. (D, E) SOCS-1-ablated or control A549 cells were infected with or without WSN virus for 15 h. Subsequently, IL-29 levels in the supernatants from the cell culture were examined by ELISA. IL-29 levels produced by infected control cells were set to 100%. Plotted are the average results from three independent experiments and the error bars represent the S.E. (D). mRNA levels of OAS-2, Mx1, IL-28A/B, and IL-29 were examined by RT-PCR (E). (F) Levels of these mRNAs in (E) were quantitated by densitometry, and normalized to GAPDH levels as described in Figure 2D. mRNA level in infected control cells is 100. Plotted are the average results from three independent experiments. The error bars represent the S.E. Statistical significance of change was determined by Student's t-test (*P<0.05).
Figure 5
Figure 5. Forced activation of STAT1 causes a significant decrease in IFN-λ expression during IAV infection.
(A) A549 cell lines stably expressing STAT1-WT, STAT1-2C or empty vector (EV) were treated with or without IL-29 (50 ng/ml) for 45 min. Cell lysates were analyzed by Western blot using indicated antibodies. (B–D) A549 cell lines described in (A) were infected with or without WSN virus for 15 h. Subsequently, the cell lysates were analyzed by Western blot probed with indicated antibodies (B), and the protein levels of IL-29 in the cell culture supernatants were examined by ELISA (C). IL-29 levels produced by infected cells expressing EV were set to 100%. Plotted are the average results from three independent experiments. The error bars represent the S.E. mRNA levels of OAS-2, Mx1, IL-28A/B and IL-29 were measured by RT-PCR (D). (E) IFN-λ levels and OAS-2 and Mx1 levels in (D) were quantitated by densitometry, and normalized to GAPDH levels as described in Figure 2D. Plotted are the average levels from three independent experiments. The error bars represent the S.E. Statistical significance of change was determined by Student's t-test (*P<0.05, **P<0.01).
Figure 6
Figure 6. Disruption of cytokine signaling pathway results in robust activation of NF-κB during IAV infection.
(A) 293T cells were co-transfected with pNF-κB-Luc and pRL-TK for 10 h and then infected with WSN virus at indicated MOI for 15 h. Luciferase activity in cell lysates was measured and displayed as the mean ± SD of relative luciferase units normalized to Renilla luciferase activity from three independent experiments. (B, C) A549 cells were infected with WSN virus as described in (A). RT-PCR was performed to examine the expression of indicated genes (B), and Western blotting was performed using indicated antibodies (C). (D) A549 cells expressing shRNAs targeting SOCS-1 or luciferase were infected with or without WSN virus for 15 h, followed by Western blotting with indicated antibodies. (E) 293T cells were co-transfected with pNF-κB-Luc, pRL-TK and either SOCS-1 shRNA expressing vector or control for 10 h and then infected with WSN virus for 15 h. Luciferase activity was analyzed as described in (A). (F) A549 cells expressing STAT1-WT, STAT1-2C or control were infected with or without WSN virus and analyzed by Western blotting with indicated antibodies. (G) Experiments were carried out as described in (E). Shown are results from experiments using cells expressing STAT1-WT, STAT1-2C or control. (H) A549 cells stably expressing SOCS-1 shRNA or control were infected with or without WSN virus for 15 h. Immunofluorescence staining was performed using an anti-p65 antibody to detect translocation of NF-κB. The nuclei were stained with DAPI. Bar, 10 µm. (I) Experiments were carried out as described in (H). Shown are results from experiments using cells expressing STAT1-WT, STAT1-2C or control. Bar, 10 µm.
Figure 7
Figure 7. Suppression of cytokine signaling by SOCS-1 contributes to overproduction of IFN-λ in mice.
(A) A549 cells were infected with WSN for indicated time. Subsequently, the cell lysates were analyzed by Western blot probed with indicated antibodies, and the mRNA levels of IL-28A/B and IL-29 were measured by RT-PCR. (B) BALB/c mice were infected intranasally with or without WSN virus (1×10⁵ PFU) for indicated time. The lungs were lysed and analyzed by Western blot probed with indicated antibodies. Expression of IL-28A/B in lung was measured by RT-PCR. (C) A549 cells were treated with or without 10 µM lipo-SOCS-1-KIR or lipo-SOCS-1-KIR2A for 20 min and then stimulated with or without IL-29 for 45 min, followed by Western blotting using indicated antibodies. (D, E) Mice were treated twice with lipo-SOCS-1-KIR peptide or lipo-SOCS-1-KIR2A control peptide at 5 µg/g body weight by intraperitoneal injection (i.p.) and then inoculated intranasally with or without WSN (1×10⁵ PFU). On Day 3 p.i., expression of IL-28A/B in lung was examined by real-time PCR (D), and Western blotting was performed using antibodies as indicated (E). (F) A549 cells were treated with 10 µM lipo-SOCS-1-KIR, lipo-pJAK2 or both and then stimulated with IL-29 as described in (C). Shown is a Western blot probed with indicated antibodies. (G–H) Mice were treated with or without lipo-pJAK2 peptide at 5 µg/g body weight and then infected with or without WSN as described in (D). IL-28A/B expression was examined by real-time PCR (G), and immunoblot was probed as indicated (H).
Figure 8
Figure 8. Silencing SOCS-1 causes a significant reduction of IFN-λ expression in transgenic mice during IAV infection.
(A) Immunoblotting was performed to test shRNA-based knockdown of mouse SOCS-1 in transfected cell line. (B) The SOCS-1-knockdown transgenic mice were genotyped by PCR. Shown is representative genotyping of SOCS-1-knockdown transgenic mice. Numbers 1-11, representative transgenic mice and wild type littermates; P, positive control; N, negative control. (C) SOCS-1 expression in representative tissues (lung) from SOCS-1-knockdown transgenic mice (TG) and wild-type littermates (WT) was examined by immunoblotting after WSN infection. (D) The transgenic founders with high interference efficiency were selected and maintained on a BALB/c genetic background. Shown is a representative photograph of SOCS-1-knockdown transgenic mouse and wild-type littermate. (E–H) WT and TG mice were infected with or without WSN virus as described in Figure 7. On Day 3 p.i., lungs were lysed and analyzed by Western blotting with indicated antibodies (E), IL-28A/B expression was examined by RT-PCR (F) and real-time PCR (G), and viral titers in lungs of WT and TG mice were examined by plaque assay and values are shown as mean ± SD (H).

Similar articles

Cited by

References

    1. Teijaro JR, Walsh KB, Cahalan S, Fremgen DM, Roberts E, et al. (2011) Endothelial cells are central orchestrators of cytokine amplification during influenza virus infection. Cell 146: 980–991. - PMC - PubMed
    1. Jewell NA, Cline T, Mertz SE, Smirnov SV, Flano E, et al. (2010) Lambda interferon is the predominant interferon induced by influenza A virus infection in vivo. J Virol 84: 11515–11522. - PMC - PubMed
    1. Kumagai Y, Takeuchi O, Kato H, Kumar H, Matsui K, et al. (2007) Alveolar macrophages are the primary interferon-alpha producer in pulmonary infection with RNA viruses. Immunity 27: 240–252. - PubMed
    1. Kobasa D, Jones SM, Shinya K, Kash JC, Copps J, et al. (2007) Aberrant innate immune response in lethal infection of macaques with the 1918 influenza virus. Nature 445: 319–323. - PubMed
    1. Iwasaki A, Medzhitov R (2011) A new shield for a cytokine storm. Cell 146: 861–862. - PMC - PubMed

Publication types

MeSH terms

Substances

Grants and funding

This work was supported by grants from National Key Technologies Research and Development Program of China (2013ZX10004-611), National Basic Research Program (973) of China (2014CB541804), Natural Science Foundation of China (U1305212), Intramural grant of the Chinese Academy of Sciences (KSZD-EW-L01-3). The funders had no role in study design, data collection and analysis, decision to publish, or preparation of the manuscript.