An in-depth comparison of latent HIV-1 reactivation in multiple cell model systems and resting CD4+ T cells from aviremic patients
- PMID: 24385908
- PMCID: PMC3873446
- DOI: 10.1371/journal.ppat.1003834
An in-depth comparison of latent HIV-1 reactivation in multiple cell model systems and resting CD4+ T cells from aviremic patients
Abstract
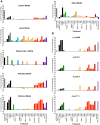
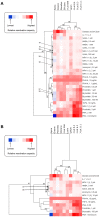
The possibility of HIV-1 eradication has been limited by the existence of latently infected cellular reservoirs. Studies to examine control of HIV latency and potential reactivation have been hindered by the small numbers of latently infected cells found in vivo. Major conceptual leaps have been facilitated by the use of latently infected T cell lines and primary cells. However, notable differences exist among cell model systems. Furthermore, screening efforts in specific cell models have identified drug candidates for "anti-latency" therapy, which often fail to reactivate HIV uniformly across different models. Therefore, the activity of a given drug candidate, demonstrated in a particular cellular model, cannot reliably predict its activity in other cell model systems or in infected patient cells, tested ex vivo. This situation represents a critical knowledge gap that adversely affects our ability to identify promising treatment compounds and hinders the advancement of drug testing into relevant animal models and clinical trials. To begin to understand the biological characteristics that are inherent to each HIV-1 latency model, we compared the response properties of five primary T cell models, four J-Lat cell models and those obtained with a viral outgrowth assay using patient-derived infected cells. A panel of thirteen stimuli that are known to reactivate HIV by defined mechanisms of action was selected and tested in parallel in all models. Our results indicate that no single in vitro cell model alone is able to capture accurately the ex vivo response characteristics of latently infected T cells from patients. Most cell models demonstrated that sensitivity to HIV reactivation was skewed toward or against specific drug classes. Protein kinase C agonists and PHA reactivated latent HIV uniformly across models, although drugs in most other classes did not.
Conflict of interest statement
The authors have declared that no competing interests exist.
Figures


Similar articles
-
Ex Vivo Bioactivity and HIV-1 Latency Reversal by Ingenol Dibenzoate and Panobinostat in Resting CD4(+) T Cells from Aviremic Patients.Antimicrob Agents Chemother. 2015 Oct;59(10):5984-91. doi: 10.1128/AAC.01077-15. Epub 2015 Jul 13. Antimicrob Agents Chemother. 2015. PMID: 26169416 Free PMC article.
-
In Vitro Reactivation of Replication-Competent and Infectious HIV-1 by Histone Deacetylase Inhibitors.J Virol. 2015 Dec 9;90(4):1858-71. doi: 10.1128/JVI.02359-15. Print 2016 Feb 15. J Virol. 2015. PMID: 26656693 Free PMC article.
-
Short Communication: The Broad-Spectrum Histone Deacetylase Inhibitors Vorinostat and Panobinostat Activate Latent HIV in CD4(+) T Cells In Part Through Phosphorylation of the T-Loop of the CDK9 Subunit of P-TEFb.AIDS Res Hum Retroviruses. 2016 Feb;32(2):169-73. doi: 10.1089/AID.2015.0347. AIDS Res Hum Retroviruses. 2016. PMID: 26727990 Free PMC article.
-
Reactivation of latent HIV by histone deacetylase inhibitors.Trends Microbiol. 2013 Jun;21(6):277-85. doi: 10.1016/j.tim.2013.02.005. Epub 2013 Mar 18. Trends Microbiol. 2013. PMID: 23517573 Free PMC article. Review.
-
The development of immune-modulating compounds to disrupt HIV latency.Cytokine Growth Factor Rev. 2012 Aug-Oct;23(4-5):159-72. doi: 10.1016/j.cytogfr.2012.05.003. Epub 2012 Jul 4. Cytokine Growth Factor Rev. 2012. PMID: 22766356 Review.
Cited by
-
Optimization of a lentivirus-mediated gene therapy targeting HIV-1 RNA to eliminate HIV-1-infected cells.Mol Ther Nucleic Acids. 2024 Sep 16;35(4):102341. doi: 10.1016/j.omtn.2024.102341. eCollection 2024 Dec 10. Mol Ther Nucleic Acids. 2024. PMID: 39434850 Free PMC article.
-
Targeted HIV-1 Latency Reversal Using CRISPR/Cas9-Derived Transcriptional Activator Systems.PLoS One. 2016 Jun 24;11(6):e0158294. doi: 10.1371/journal.pone.0158294. eCollection 2016. PLoS One. 2016. PMID: 27341108 Free PMC article.
-
A passive-flow microfluidic device for imaging latent HIV activation dynamics in single T cells.Integr Biol (Camb). 2015 Sep;7(9):998-1010. doi: 10.1039/c5ib00094g. Epub 2015 Jul 3. Integr Biol (Camb). 2015. PMID: 26138068 Free PMC article.
-
What Integration Sites Tell Us about HIV Persistence.Cell Host Microbe. 2016 May 11;19(5):588-98. doi: 10.1016/j.chom.2016.04.010. Cell Host Microbe. 2016. PMID: 27173927 Free PMC article. Review.
-
Splicing Factor 3B Subunit 1 Interacts with HIV Tat and Plays a Role in Viral Transcription and Reactivation from Latency.mBio. 2018 Nov 6;9(6):e01423-18. doi: 10.1128/mBio.01423-18. mBio. 2018. PMID: 30401776 Free PMC article.
References
-
- Finzi D, Hermankova M, Pierson T, Carruth LM, Buck C, et al. (1997) Identification of a reservoir for HIV-1 in patients on highly active antiretroviral therapy. Science 278: 1295–1300. - PubMed
-
- Chun TW, Carruth L, Finzi D, Shen X, DiGiuseppe JA, et al. (1997) Quantification of latent tissue reservoirs and total body viral load in HIV-1 infection. Nature 387: 183–188. - PubMed
-
- Wong JK, Hezareh M, Gunthard HF, Havlir DV, Ignacio CC, et al. (1997) Recovery of replication-competent HIV despite prolonged suppression of plasma viremia. Science 278: 1291–1295. - PubMed
-
- Deeks SG (2012) HIV: Shock and kill. Nature 487: 439–440. - PubMed
Publication types
MeSH terms
Substances
Grants and funding
- T32 AI060537/AI/NIAID NIH HHS/United States
- R56 AI095073/AI/NIAID NIH HHS/United States
- U19 AI096109/AI/NIAID NIH HHS/United States
- AI36214/AI/NIAID NIH HHS/United States
- MRC_/Medical Research Council/United Kingdom
- P30 AI027763/AI/NIAID NIH HHS/United States
- P30 AI036214/AI/NIAID NIH HHS/United States
- U19AI096113/AI/NIAID NIH HHS/United States
- P30 AI050410/AI/NIAID NIH HHS/United States
- HHMI/Howard Hughes Medical Institute/United States
- 1R56AI095073-01A1/AI/NIAID NIH HHS/United States
- R01 DA030216/DA/NIDA NIH HHS/United States
- U19 AI096113/AI/NIAID NIH HHS/United States
LinkOut - more resources
Full Text Sources
Other Literature Sources
Research Materials
Miscellaneous

