

Nrf2 enhances cholangiocyte expansion in Pten-deficient livers
- PMID: 24379438
- PMCID: PMC4023823
- DOI: 10.1128/MCB.01384-13
Nrf2 enhances cholangiocyte expansion in Pten-deficient livers
Abstract
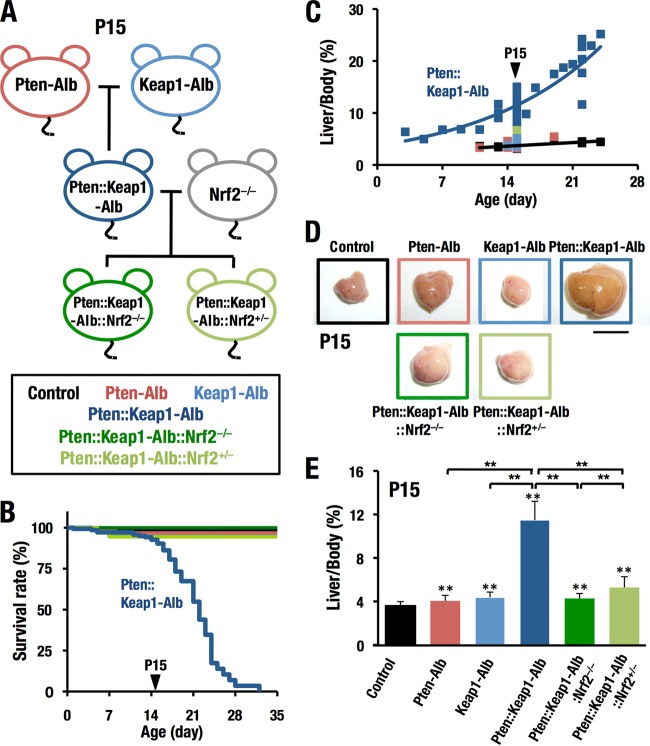
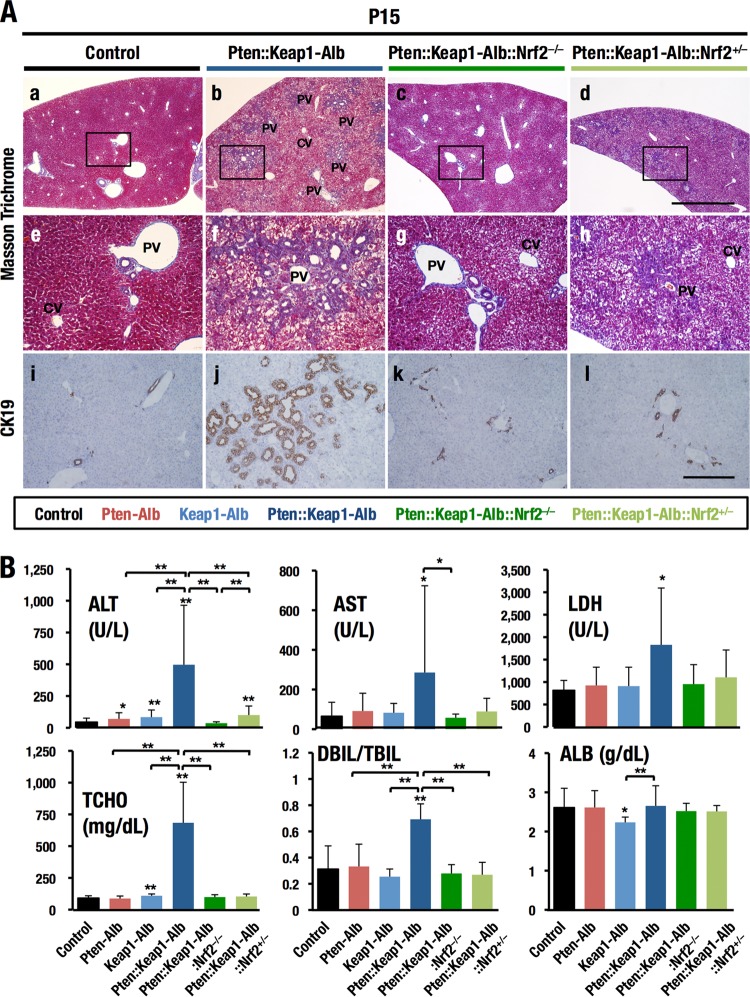
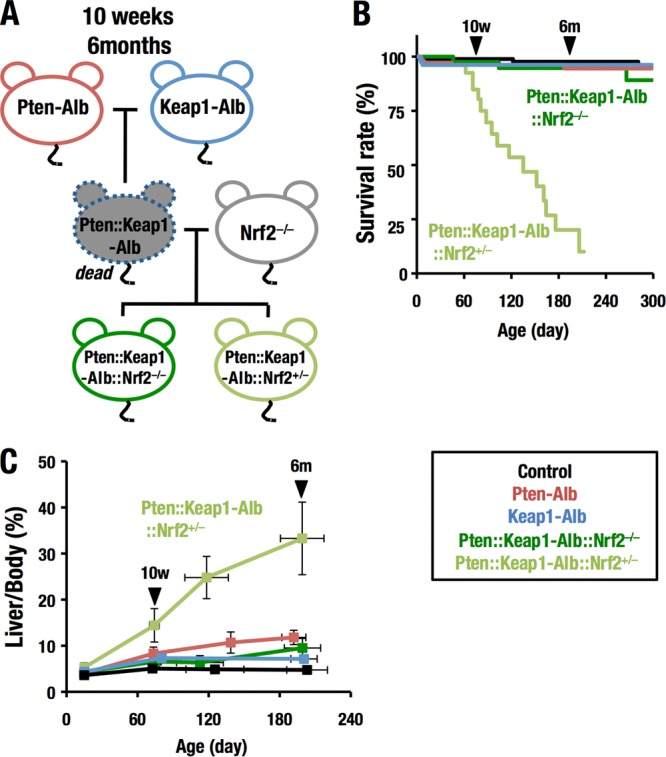
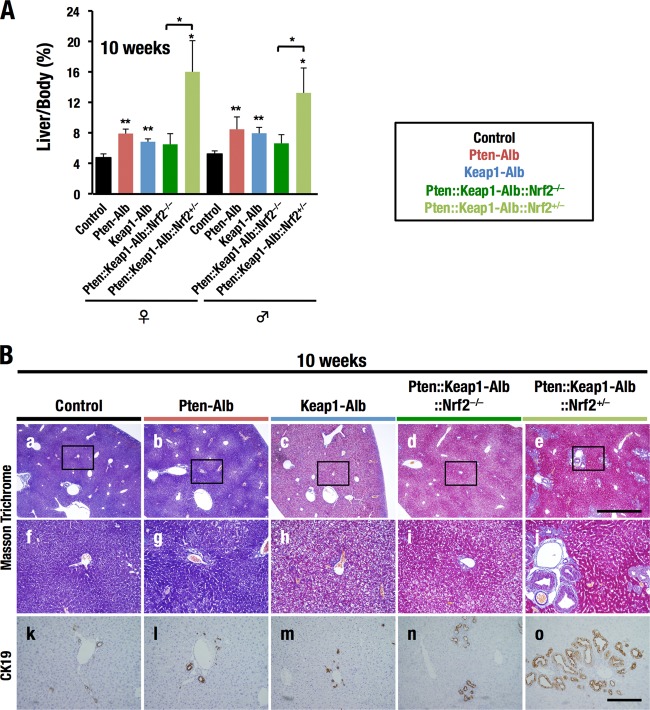
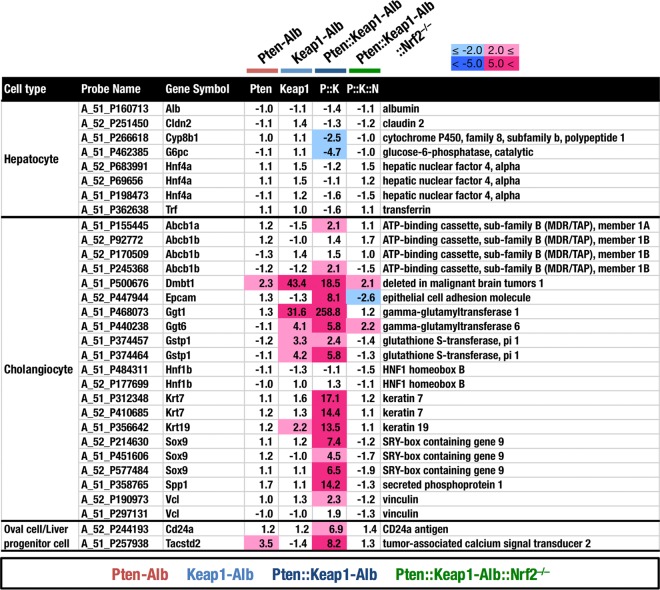
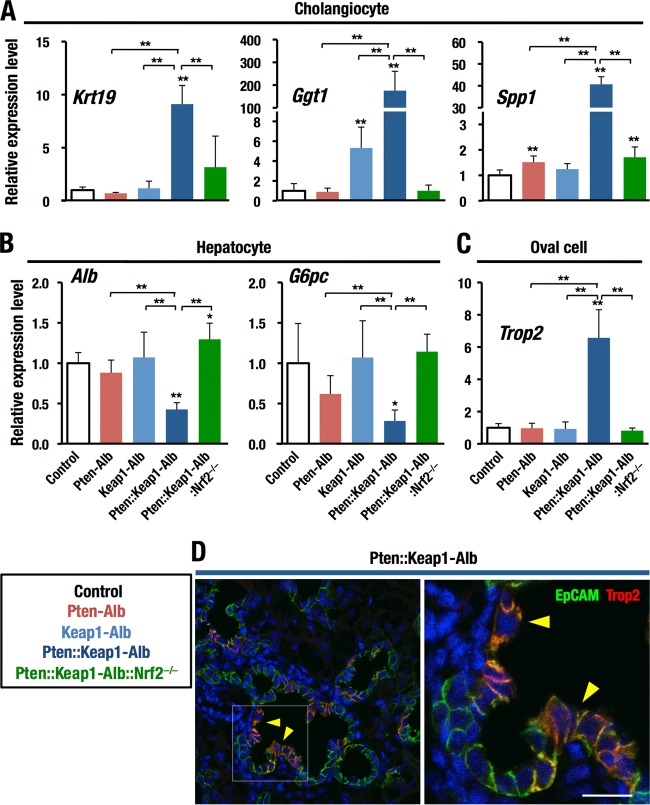
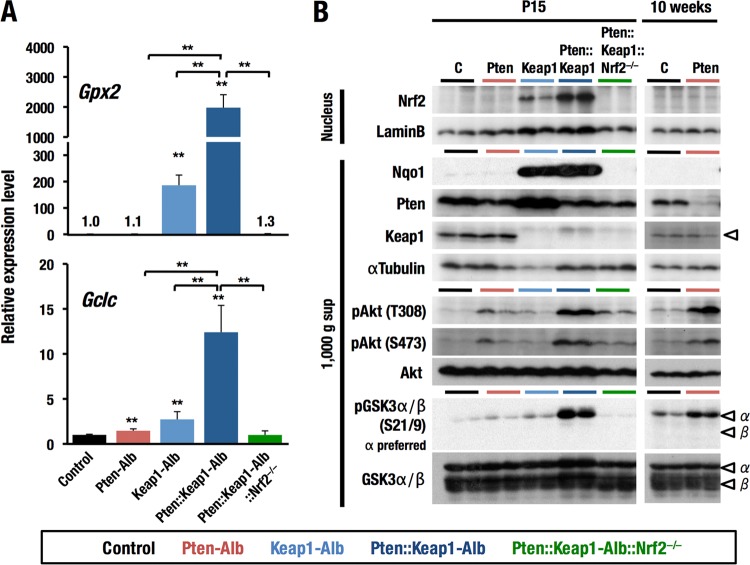
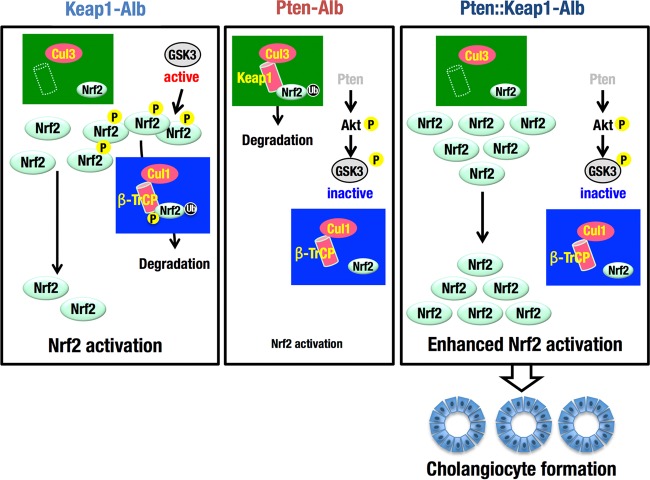
Keap1-Nrf2 system plays a central role in the stress response. While Keap1 ubiquitinates Nrf2 for degradation under unstressed conditions, this Keap1 activity is abrogated in response to oxidative or electrophilic stresses, leading to Nrf2 stabilization and coordinated activation of cytoprotective genes. We recently found that nuclear accumulation of Nrf2 is significantly increased by simultaneous deletion of Pten and Keap1, resulting in the stronger activation of Nrf2 target genes. To clarify the impact of the cross talk between the Keap1-Nrf2 and Pten-phosphatidylinositide 3-kinase-Akt pathways on the liver pathophysiology, in this study we have conducted closer analysis of liver-specific Pten::Keap1 double-mutant mice (Pten::Keap1-Alb mice). The Pten::Keap1-Alb mice were lethal by 1 month after birth and displayed severe hepatomegaly with abnormal expansion of ductal structures comprising cholangiocytes in a Nrf2-dependent manner. Long-term observation of Pten::Keap1-Alb::Nrf2(+/-) mice revealed that the Nrf2-heterozygous mice survived beyond 1 month but developed polycystic liver fibrosis by 6 months. Gsk3 directing the Keap1-independent degradation of Nrf2 was heavily phosphorylated and consequently inactivated by the double deletion of Pten and Keap1 genes. Thus, liver-specific disruption of Keap1 and Pten augments Nrf2 activity through inactivation of Keap1-dependent and -independent degradation of Nrf2 and establishes the Nrf2-dependent molecular network promoting the hepatomegaly and cholangiocyte expansion.
Figures


Similar articles
-
The PTEN/NRF2 axis promotes human carcinogenesis.Antioxid Redox Signal. 2014 Dec 20;21(18):2498-514. doi: 10.1089/ars.2014.5843. Epub 2014 Jul 31. Antioxid Redox Signal. 2014. PMID: 24892215 Free PMC article.
-
Keap1 degradation by autophagy for the maintenance of redox homeostasis.Proc Natl Acad Sci U S A. 2012 Aug 21;109(34):13561-6. doi: 10.1073/pnas.1121572109. Epub 2012 Aug 7. Proc Natl Acad Sci U S A. 2012. PMID: 22872865 Free PMC article.
-
Increased Nrf2 activation in livers from Keap1-knockdown mice increases expression of cytoprotective genes that detoxify electrophiles more than those that detoxify reactive oxygen species.Toxicol Sci. 2009 Mar;108(1):35-47. doi: 10.1093/toxsci/kfn267. Epub 2009 Jan 6. Toxicol Sci. 2009. PMID: 19129213 Free PMC article.
-
Cell survival responses to environmental stresses via the Keap1-Nrf2-ARE pathway.Annu Rev Pharmacol Toxicol. 2007;47:89-116. doi: 10.1146/annurev.pharmtox.46.120604.141046. Annu Rev Pharmacol Toxicol. 2007. PMID: 16968214 Review.
-
Nrf2-Keap1 defines a physiologically important stress response mechanism.Trends Mol Med. 2004 Nov;10(11):549-57. doi: 10.1016/j.molmed.2004.09.003. Trends Mol Med. 2004. PMID: 15519281 Review.
Cited by
-
FOXO1 regulates pentose phosphate pathway-mediated induction of developmental erythropoiesis.Front Cell Dev Biol. 2022 Oct 12;10:1039636. doi: 10.3389/fcell.2022.1039636. eCollection 2022. Front Cell Dev Biol. 2022. PMID: 36313554 Free PMC article.
-
Nrf2 attenuates hyperglycemia-induced nNOS impairment in adult mouse primary enteric neuronal crest cells and normalizes stomach function.Am J Physiol Gastrointest Liver Physiol. 2022 Mar 1;322(3):G368-G382. doi: 10.1152/ajpgi.00323.2021. Epub 2022 Jan 27. Am J Physiol Gastrointest Liver Physiol. 2022. PMID: 35084215 Free PMC article.
-
A Novel Nrf2 Pathway Inhibitor Sensitizes Keap1-Mutant Lung Cancer Cells to Chemotherapy.Mol Cancer Ther. 2021 Sep;20(9):1692-1701. doi: 10.1158/1535-7163.MCT-21-0210. Epub 2021 Jun 22. Mol Cancer Ther. 2021. PMID: 34158350 Free PMC article.
-
The PTEN/NRF2 axis promotes human carcinogenesis.Antioxid Redox Signal. 2014 Dec 20;21(18):2498-514. doi: 10.1089/ars.2014.5843. Epub 2014 Jul 31. Antioxid Redox Signal. 2014. PMID: 24892215 Free PMC article.
-
Generation of a New Model Rat: Nrf2 Knockout Rats Are Sensitive to Aflatoxin B1 Toxicity.Toxicol Sci. 2016 Jul;152(1):40-52. doi: 10.1093/toxsci/kfw065. Epub 2016 Apr 12. Toxicol Sci. 2016. PMID: 27071940 Free PMC article.
References
-
- Singh A, Happel C, Manna SK, Acquaah-Mensah G, Carrerero J, Kumar S, Nasipuri P, Krausz KW, Wakabayashi N, Dewi R, Boros LG, Gonzalez FJ, Gabrielson E, Wong KK, Girnun G, Biswal S. 2013. Transcription factor NRF2 regulates miR-1 and miR-206 to drive tumorigenesis. J. Clin. Invest. 123:2921–2934. 10.1172/JCI66353 - DOI - PMC - PubMed
Publication types
MeSH terms
Substances
LinkOut - more resources
Full Text Sources
Other Literature Sources
Molecular Biology Databases
Research Materials
Miscellaneous