

Local proliferation of macrophages contributes to obesity-associated adipose tissue inflammation
- PMID: 24374218
- PMCID: PMC3931314
- DOI: 10.1016/j.cmet.2013.11.017
Local proliferation of macrophages contributes to obesity-associated adipose tissue inflammation
Abstract
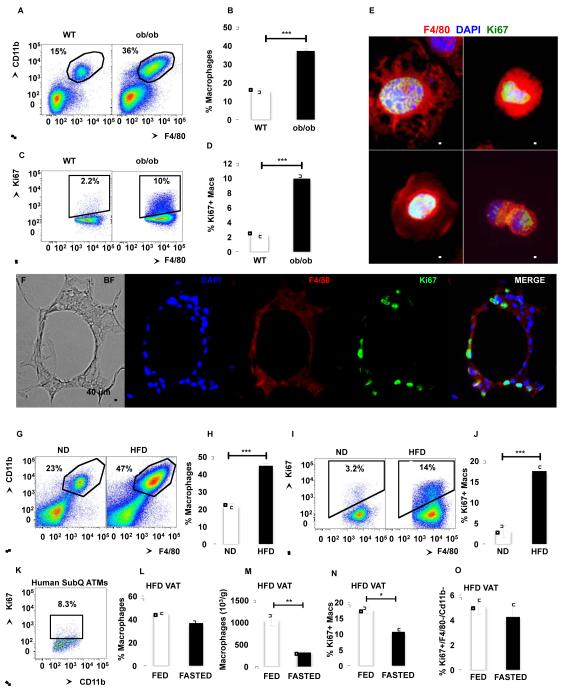
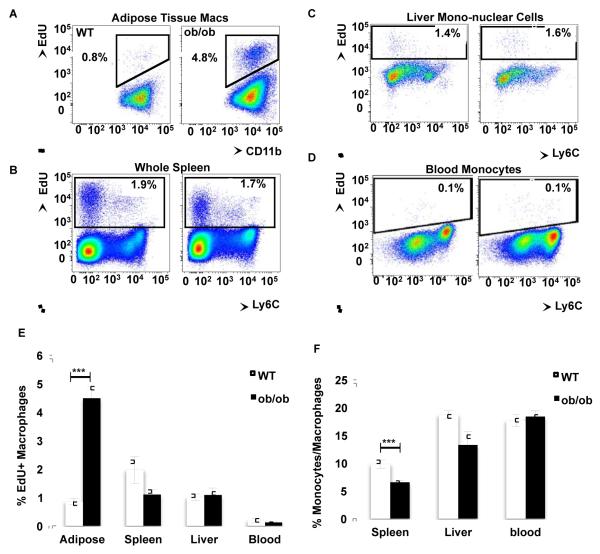
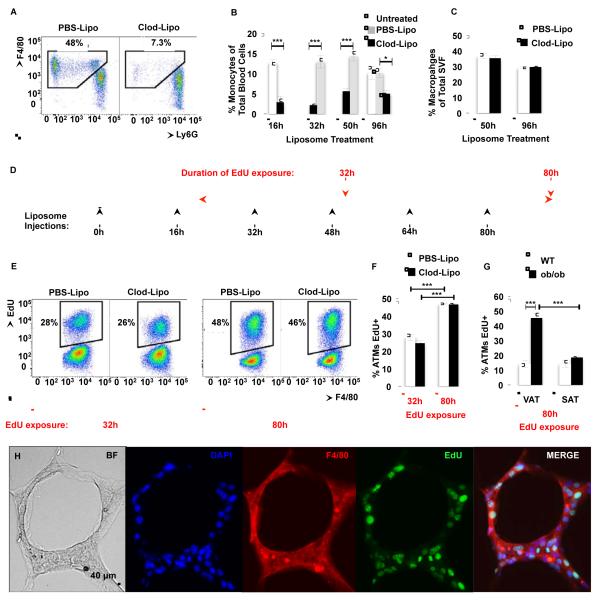
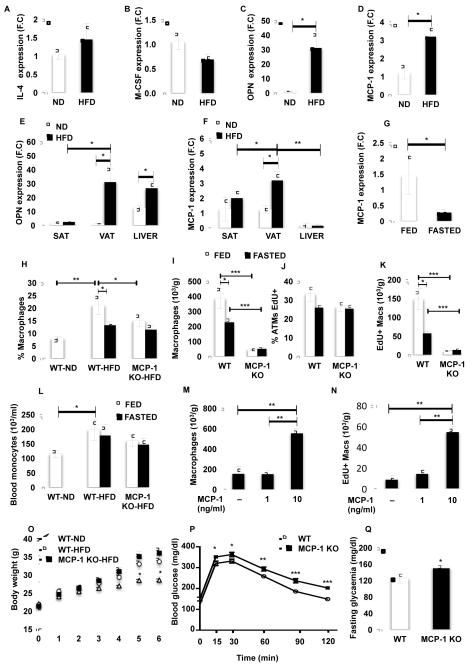
Adipose tissue (AT) of obese mice and humans accumulates immune cells, which secrete cytokines that can promote insulin resistance. AT macrophages (ATMs) are thought to originate from bone-marrow-derived monocytes, which infiltrate the tissue from the circulation. Here, we show that a major fraction of macrophages unexpectedly undergo cell division locally within AT, as detected by Ki67 expression and 5-ethynyl-2'-deoxyuridine incorporation. Macrophages within the visceral AT (VAT), but not those in other tissues (including liver and spleen), displayed increased proliferation in obesity. Importantly, depletion of blood monocytes had no impact on ATM content, whereas their proliferation in situ continued. Treatment with monocyte chemotactic protein 1 (MCP-1) induced macrophage cell division in AT explants, whereas mcp-1 deficiency in vivo decreased ATM proliferation. These results reveal that, in addition to blood monocyte recruitment, in situ proliferation driven by MCP-1 is an important process by which macrophages accumulate in the VAT in obesity.
Copyright © 2014 Elsevier Inc. All rights reserved.
Figures
Similar articles
-
Local proliferation initiates macrophage accumulation in adipose tissue during obesity.Cell Death Dis. 2016 Mar 31;7(3):e2167. doi: 10.1038/cddis.2016.54. Cell Death Dis. 2016. PMID: 27031964 Free PMC article.
-
Increased macrophage migration into adipose tissue in obese mice.Diabetes. 2012 Feb;61(2):346-54. doi: 10.2337/db11-0860. Epub 2011 Dec 21. Diabetes. 2012. PMID: 22190646 Free PMC article.
-
Adipose tissue macrophages induce hepatic neutrophil recruitment and macrophage accumulation in mice.Gut. 2018 Jul;67(7):1317-1327. doi: 10.1136/gutjnl-2016-313654. Epub 2017 Oct 26. Gut. 2018. PMID: 29074725
-
Cellular and molecular players in adipose tissue inflammation in the development of obesity-induced insulin resistance.Biochim Biophys Acta. 2014 Mar;1842(3):446-62. doi: 10.1016/j.bbadis.2013.05.017. Epub 2013 May 22. Biochim Biophys Acta. 2014. PMID: 23707515 Free PMC article. Review.
-
Adipocyte-Macrophage Cross-Talk in Obesity.Adv Exp Med Biol. 2017;960:327-343. doi: 10.1007/978-3-319-48382-5_14. Adv Exp Med Biol. 2017. PMID: 28585206 Review.
Cited by
-
Neutrophil oxidative stress mediates obesity-associated vascular dysfunction and metastatic transmigration.Nat Cancer. 2021 May;2(5):545-562. doi: 10.1038/s43018-021-00194-9. Epub 2021 May 3. Nat Cancer. 2021. PMID: 35122017
-
Netrin-1 Alters Adipose Tissue Macrophage Fate and Function in Obesity.Immunometabolism. 2019;1(2):e190010. doi: 10.20900/immunometab20190010. Epub 2019 Aug 7. Immunometabolism. 2019. PMID: 31428465 Free PMC article.
-
Distinct macrophage populations direct inflammatory versus physiological changes in adipose tissue.Proc Natl Acad Sci U S A. 2018 May 29;115(22):E5096-E5105. doi: 10.1073/pnas.1802611115. Epub 2018 May 14. Proc Natl Acad Sci U S A. 2018. PMID: 29760084 Free PMC article.
-
The role of obesity in the immune response during sepsis.Nutr Diabetes. 2014 Sep 22;4(9):e137. doi: 10.1038/nutd.2014.34. Nutr Diabetes. 2014. PMID: 25244356 Free PMC article.
-
Adipocyte-specific IKKβ signaling suppresses adipose tissue inflammation through an IL-13-dependent paracrine feedback pathway.Cell Rep. 2014 Dec 11;9(5):1574-1583. doi: 10.1016/j.celrep.2014.10.068. Epub 2014 Nov 26. Cell Rep. 2014. PMID: 25466256 Free PMC article.
References
-
- Allavena P, Bianchi G, Zhou D, van Damme J, Jilek P, Sozzani S, Mantovani A. Induction of natural killer cell migration by monocyte chemotactic protein-1, -2 and -3. Eur J Immunol. 1994;24:3233–3236. - PubMed
-
- Bourlier V, Zakaroff-Girard A, Miranville A, De Barros S, Maumus M, Sengenes C, Galitzky J, Lafontan M, Karpe F, Frayn KN, et al. Remodeling phenotype of human subcutaneous adipose tissue macrophages. Circulation. 2008;117:806–815. - PubMed
Publication types
MeSH terms
Substances
Grants and funding
LinkOut - more resources
Full Text Sources
Other Literature Sources
Medical
Molecular Biology Databases
Research Materials
Miscellaneous