mTOR target NDRG1 confers MGMT-dependent resistance to alkylating chemotherapy
- PMID: 24367102
- PMCID: PMC3890826
- DOI: 10.1073/pnas.1314469111
mTOR target NDRG1 confers MGMT-dependent resistance to alkylating chemotherapy
Erratum in
-
Correction to Supporting Information for Weiler et al., mTOR target NDRG1 confers MGMT-dependent resistance to alkylating chemotherapy.Proc Natl Acad Sci U S A. 2021 Sep 21;118(38):e2114464118. doi: 10.1073/pnas.2114464118. Proc Natl Acad Sci U S A. 2021. PMID: 34493584 Free PMC article. No abstract available.
Abstract
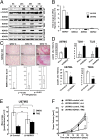
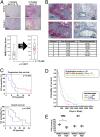
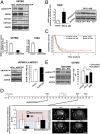
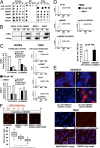
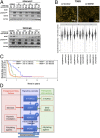
A hypoxic microenvironment induces resistance to alkylating agents by activating targets in the mammalian target of rapamycin (mTOR) pathway. The molecular mechanisms involved in this mTOR-mediated hypoxia-induced chemoresistance, however, are unclear. Here we identify the mTOR target N-myc downstream regulated gene 1 (NDRG1) as a key determinant of resistance toward alkylating chemotherapy, driven by hypoxia but also by therapeutic measures such as irradiation, corticosteroids, and chronic exposure to alkylating agents via distinct molecular routes involving hypoxia-inducible factor (HIF)-1alpha, p53, and the mTOR complex 2 (mTORC2)/serum glucocorticoid-induced protein kinase 1 (SGK1) pathway. Resistance toward alkylating chemotherapy but not radiotherapy was dependent on NDRG1 expression and activity. In posttreatment tumor tissue of patients with malignant gliomas, NDRG1 was induced and predictive of poor response to alkylating chemotherapy. On a molecular level, NDRG1 bound and stabilized methyltransferases, chiefly O(6)-methylguanine-DNA methyltransferase (MGMT), a key enzyme for resistance to alkylating agents in glioblastoma patients. In patients with glioblastoma, MGMT promoter methylation in tumor tissue was not more predictive for response to alkylating chemotherapy in patients who received concomitant corticosteroids.
Conflict of interest statement
The authors declare no conflict of interest.
Figures
Similar articles
-
Transcriptional control of O6 -methylguanine DNA methyltransferase expression and temozolomide resistance in glioblastoma.J Neurochem. 2018 Mar;144(6):780-790. doi: 10.1111/jnc.14326. J Neurochem. 2018. PMID: 29480969
-
Correlation of O6-methylguanine methyltransferase (MGMT) promoter methylation with clinical outcomes in glioblastoma and clinical strategies to modulate MGMT activity.J Clin Oncol. 2008 Sep 1;26(25):4189-99. doi: 10.1200/JCO.2007.11.5964. J Clin Oncol. 2008. PMID: 18757334 Review.
-
20(S)-ginsenoside-Rg3 reverses temozolomide resistance and restrains epithelial-mesenchymal transition progression in glioblastoma.Cancer Sci. 2019 Jan;110(1):389-400. doi: 10.1111/cas.13881. Epub 2018 Dec 14. Cancer Sci. 2019. PMID: 30431207 Free PMC article.
-
IKBKE enhances TMZ-chemoresistance through upregulation of MGMT expression in glioblastoma.Clin Transl Oncol. 2020 Aug;22(8):1252-1262. doi: 10.1007/s12094-019-02251-3. Epub 2019 Dec 21. Clin Transl Oncol. 2020. PMID: 31865606
-
Anti-glioma therapy with temozolomide and status of the DNA-repair gene MGMT.Anticancer Res. 2009 Nov;29(11):4845-54. Anticancer Res. 2009. PMID: 20032445 Review.
Cited by
-
Proximity ligation assay evaluates IDH1R132H presentation in gliomas.J Clin Invest. 2015 Feb;125(2):593-606. doi: 10.1172/JCI77780. Epub 2015 Jan 2. J Clin Invest. 2015. PMID: 25555220 Free PMC article. Clinical Trial.
-
Regulation of expression of O6-methylguanine-DNA methyltransferase and the treatment of glioblastoma (Review).Int J Oncol. 2015 Aug;47(2):417-28. doi: 10.3892/ijo.2015.3026. Epub 2015 May 29. Int J Oncol. 2015. PMID: 26035292 Free PMC article. Review.
-
S6Ks isoforms contribute to viability, migration, docetaxel resistance and tumor formation of prostate cancer cells.BMC Cancer. 2016 Aug 5;16:602. doi: 10.1186/s12885-016-2629-y. BMC Cancer. 2016. PMID: 27491285 Free PMC article.
-
Disrupting glioblastoma networks with tumor treating fields (TTFields) in in vitro models.J Neurooncol. 2024 Oct;170(1):139-151. doi: 10.1007/s11060-024-04786-0. Epub 2024 Aug 1. J Neurooncol. 2024. PMID: 39088157 Free PMC article.
-
mTOR Signaling Pathway and Gut Microbiota in Various Disorders: Mechanisms and Potential Drugs in Pharmacotherapy.Int J Mol Sci. 2023 Jul 22;24(14):11811. doi: 10.3390/ijms241411811. Int J Mol Sci. 2023. PMID: 37511569 Free PMC article. Review.
References
-
- Amberger-Murphy V. Hypoxia helps glioma to fight therapy. Curr Cancer Drug Targets. 2009;9(3):381–390. - PubMed
-
- Harris AL. Hypoxia—A key regulatory factor in tumour growth. Nat Rev Cancer. 2002;2(1):38–47. - PubMed
-
- Winkler F, et al. Kinetics of vascular normalization by VEGFR2 blockade governs brain tumor response to radiation: Role of oxygenation, angiopoietin-1, and matrix metalloproteinases. Cancer Cell. 2004;6(6):553–563. - PubMed
Publication types
MeSH terms
Substances
LinkOut - more resources
Full Text Sources
Other Literature Sources
Medical
Research Materials
Miscellaneous

