

Review
doi: 10.1021/cr4003769.
Epub 2013 Dec 23.
Microbial and animal rhodopsins: structures, functions, and molecular mechanisms
Affiliations
- PMID: 24364740
- PMCID: PMC3979449
- DOI: 10.1021/cr4003769
Item in Clipboard
Review
Microbial and animal rhodopsins: structures, functions, and molecular mechanisms
Chem Rev.
.
No abstract available
Figures
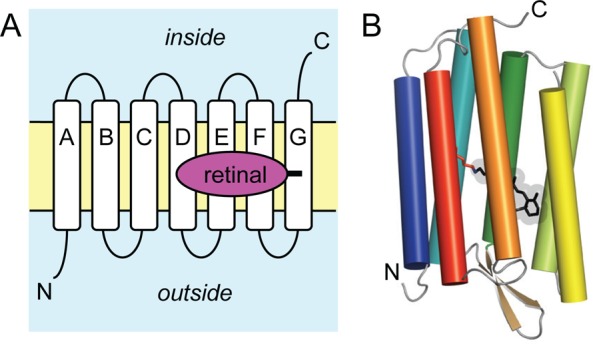
Topology
of the retinal proteins. (A) These membrane proteins contain
seven α-helices (typically denoted helix A to G in microbial
opsins and TM1 to 7 in the animal opsins) spanning the lipid bilayer.
The N-terminus faces the outside of the cell and the C-terminus the
inside. Retinal is covalently attached to a lysine side chain on helix
G or TM7, respectively. (B) Cartoon representation of the helical
arrangement of a microbial rhodopsin with attached all-trans-retinal (bacteriorhodopsin, PDB ID: 1C3W).
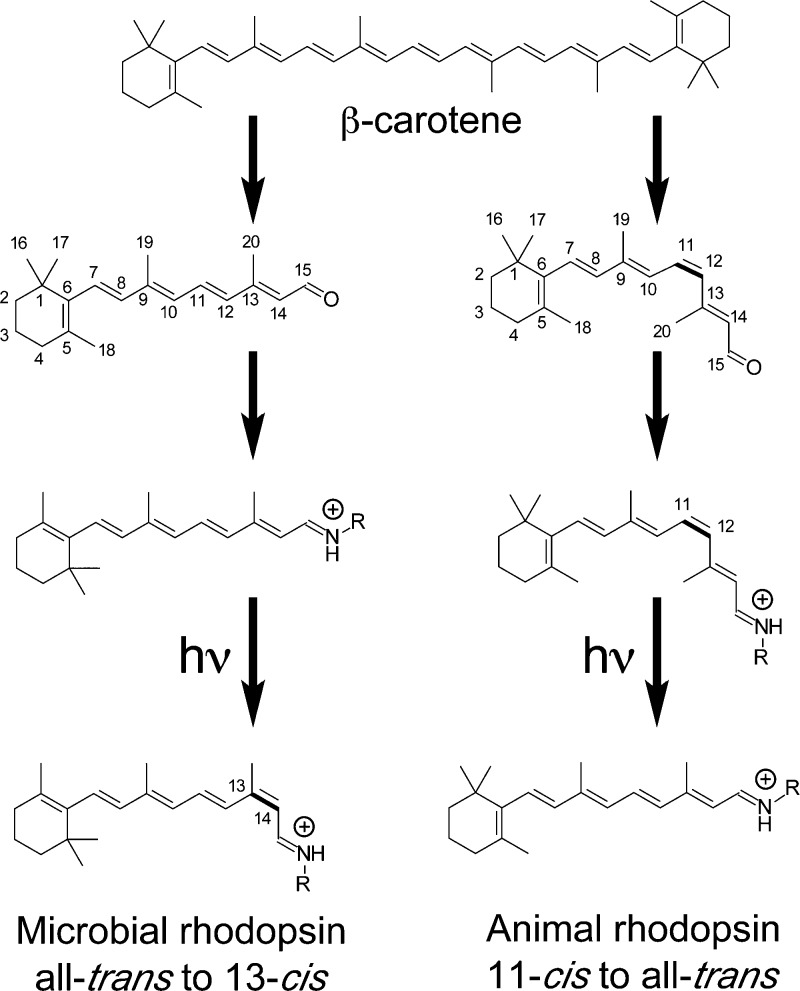
Genesis of the chromophore of microbial and animal rhodopsins.
Cleavage of β-carotene is the source of the chromophore. The
ground state of microbial and animal rhodopsins possesses all-trans- and 11-cis-retinal as its chromophore,
respectively, bound to a Lys residue via a Schiff base, which is normally
protonated and exists in the 15-anti configuration.
It should be noted that microbial rhodopsins depend exclusively on
all-trans-retinal, while some animal rhodopsins possess
vitamin A2 (C3=C4 double bond for fish visual pigments) and
hydroxyl (C3—OH for insect visual pigments) forms of 11-cis-retinal. Usually, photoactivation isomerizes microbial
rhodopsin selectively at the C13=C14 double bond and animal
rhodopsin at the C11=C12 double bond.
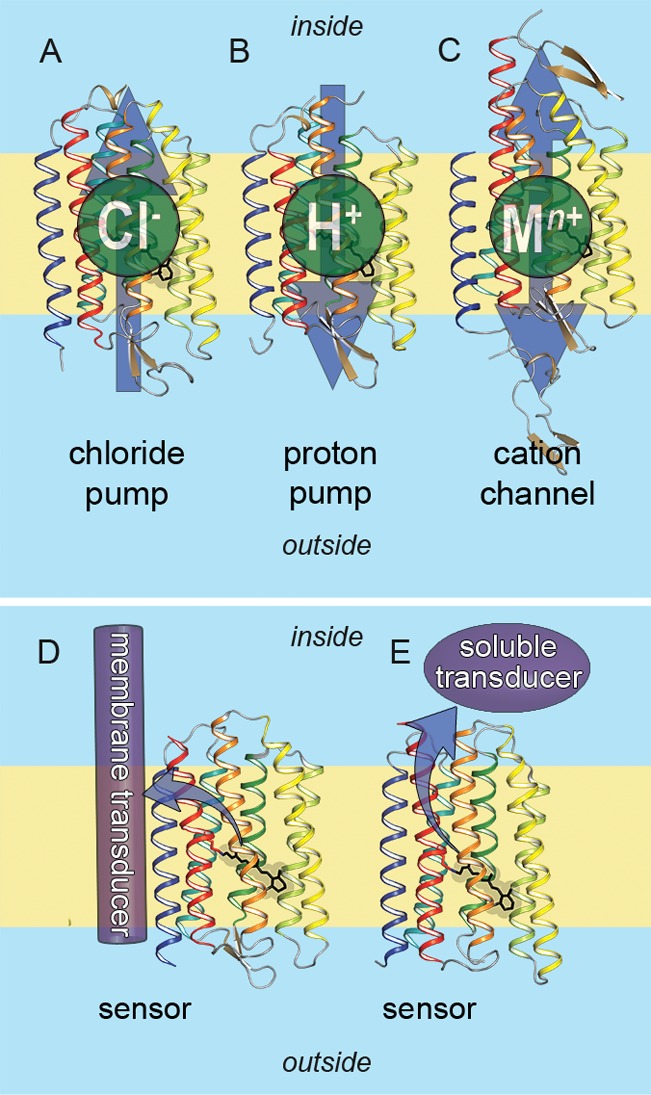
Microbial rhodopsins can function as pumps, channels, and light-sensors.
Arrows indicate the direction of transport or flow of signal: (A)
light-driven inward chloride pump (halorhodopsin (HR), PDB ID: 1E12), (B) light-driven
outward proton pump (bacteriorhodopsin (BR), PDB ID: 1C3W), (C) light-gated
cation channel (channelrhodopsin (ChR), PDB ID: 3UG9), (D) light-sensor
activating transmembrane transducer protein (sensory rhodopsin II
(SRII), PDB ID: 1JGJ), (E) light-sensor activating soluble transducer protein (Anabaena sensory rhodopsin (ASR), PDB ID: 1XIO).
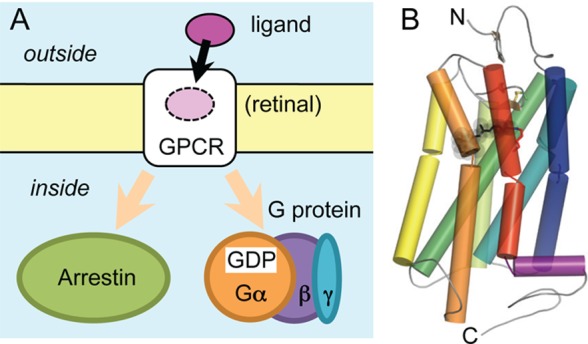
Animal rhodopsins are specialized G-protein-coupled receptors (GPCRs).
(A) Binding of extracellular ligands stabilizes certain GPCR conformations
which enable the GPCR to catalyze GDP/GTP exchange in heterotrimeric
G proteins (Gαβγ) and/or to induce G-protein-independent,
arrestin-mediated signaling. (B) Typical GPCR fold shown in cartoon
representation for bovine rhodopsin (PDB ID: 1U19). Structures of
animal and microbial rhodopsins differ largely (cf. Figure 1B) and are drawn in opposite orientations with respect
to the membrane. As model for the GPCR family, animal rhodopsin is
shown in the orientation commonly used for GPCRs. In a large number
of publications, animal rhodopsins are shown for historical reasons
in the orientation of microbial rhodopsins (C-terminus up).
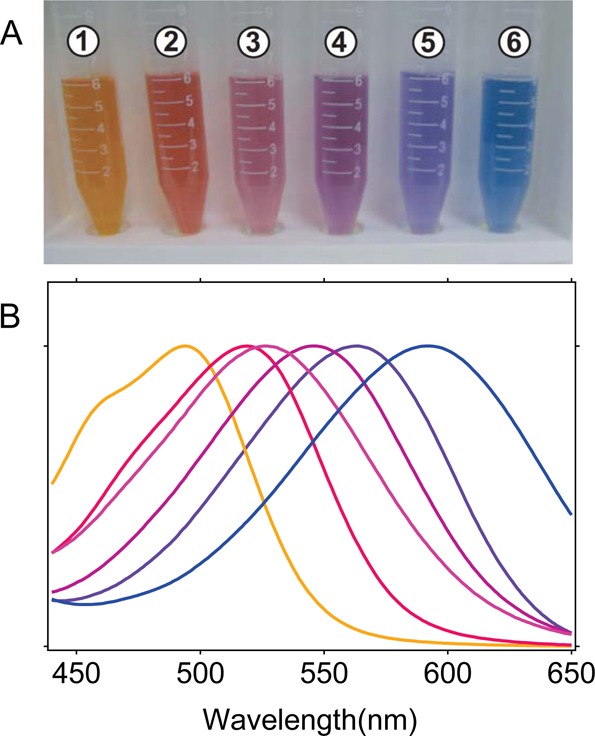
Microbial rhodopsins
exhibit a wide range of absorption maxima.
Colors of microbial rhodopsins (A) and their absorption spectra (B).
The following rhodopsins are shown: (1) a blue-proteorhodopsin (LC1-200,
pH 7), (2) Q105L mutant of LC1-200 (pH 7), (3) a green-proteorhodopsin
(EBAC31A08, pH 7), (4) A178R mutant of green-proteorhodopsin (pH 7),
(5) bacteriorhodopsin (pH 7), (6) H. salinarum sensory
rhodopsin I (pH 4).
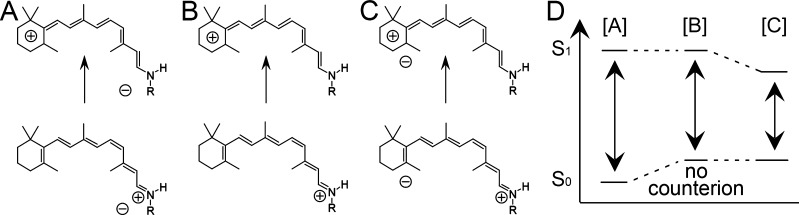
Color tuning
exemplified by visual rhodopsins (containing 11-cis-retinal and RSBH+). Photoexcitation causes
bond alteration, which leads in the electronically excited state to
the movement of the positive charge from the RSBH+ to the
β-ionone ring. (A) Excitation when a negatively charged counterion
is close to the positively charged RSBH+. (B) Excitation
in the absence of a negatively charged counterion. (C) Excitation
when the chromophore counterion is located near the β-ionone
ring. (D) Electrostatic interactions with the counterion lower the
energy level of the ground state (case [A]) or excited state (case
[C]), yielding a spectral blue- or red-shift, respectively.
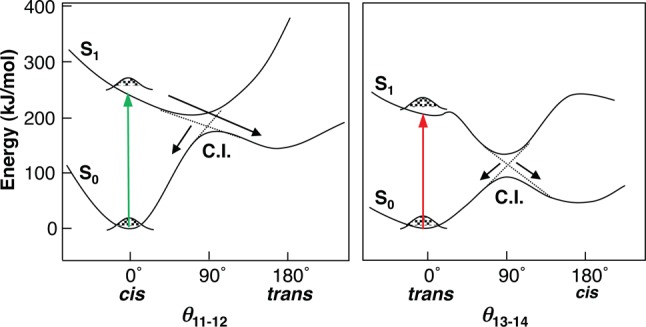
Suggested mechanism of retinal photoisomerization in rhodopsins.
Potential energy profiles along the reaction coordinate (the dihedral
angle of C11=C12 and C13=C14 bonds of animal (left)
and microbial (right) rhodopsins): S0, ground state; S1, the first electronic excited state. Colored arrows represent
excitation by visible light. C.I. represents conical intersection,
the point of the closest approach of the energy surfaces of the ground
and the excited states, through which transitions are the most probable.
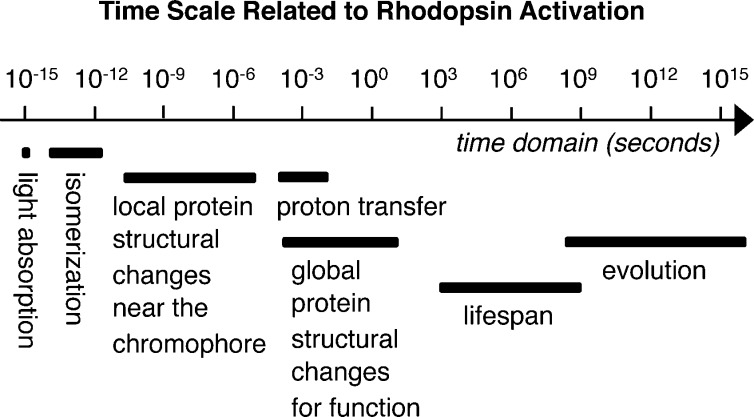
Time scale
related to activation of microbial and animal rhodopsins.
Light absorption, retinal isomerization, proton transfer, and local
and global protein structural changes take place hierarchically, leading
to functional activity.
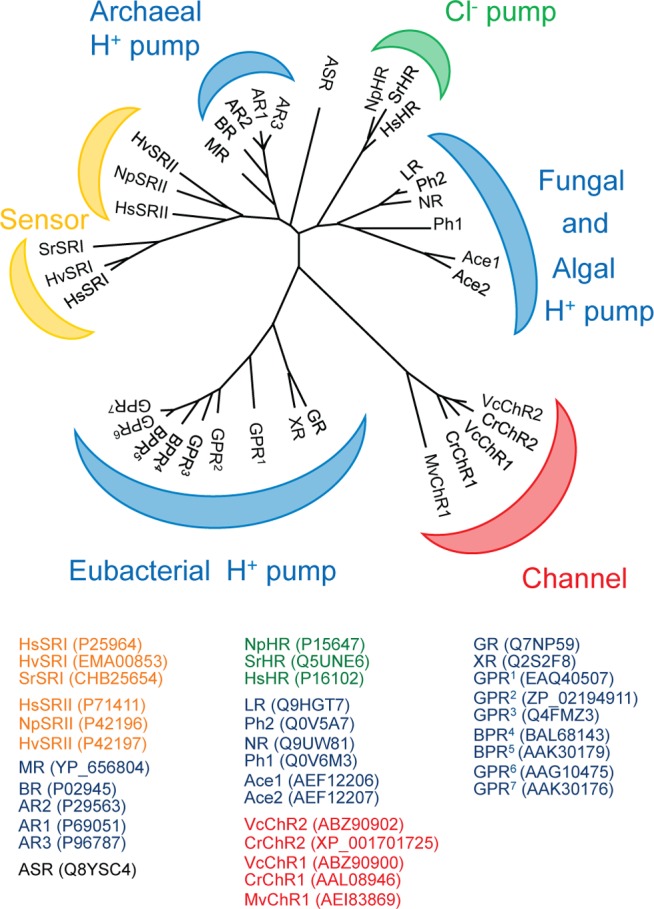
Phylogenetic
tree of selected microbial rhodopsins. Four main functions
of microbial rhodopsins are shown in different colors: blue, proton
pumps; green, chloride ion pumps; red, light-gated cation channels;
yellow, photosensors. Proton pumps are widely distributed among Archaea, Eubacteria, and Eukaryota. Two additional poorly studied functional groups (sodium ion pumps
and enzymerhodopsins) are not included. See Supporting
Information Figure 1 for additional information on genus and
species of the microbial rhodopsins.
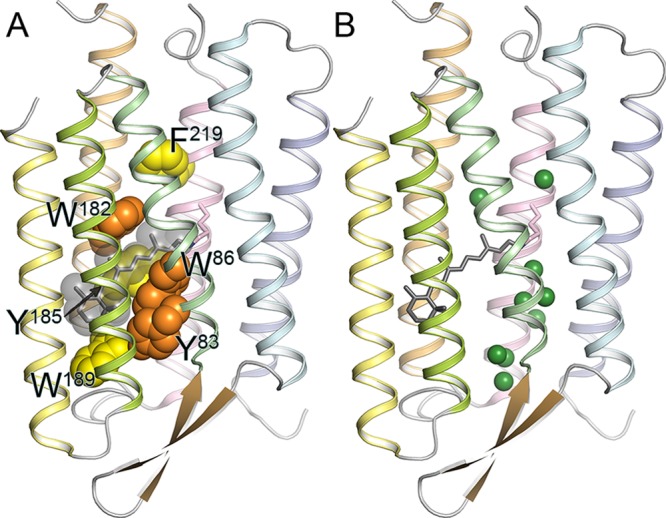
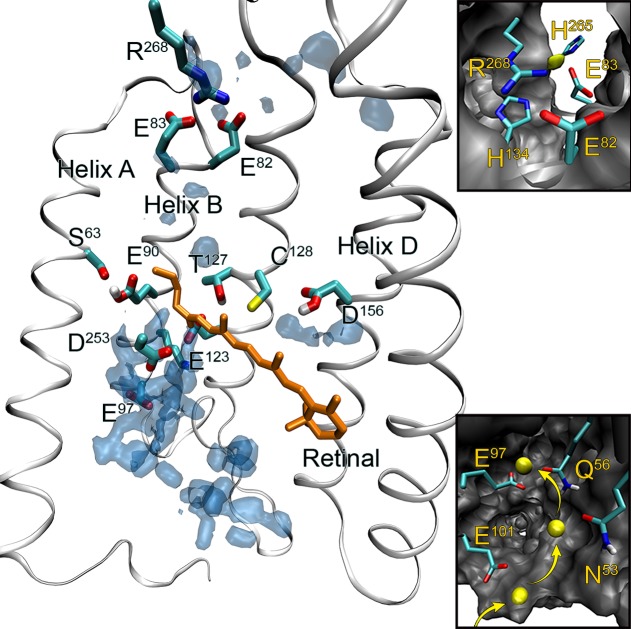
(A) Structure
of bacteriorhodopsin (BR), with conserved aromatic
residues highlighted (PDB ID: 1QM8). Tyr83, Trp86, and Trp182 are strongly
conserved among microbial rhodopsins (orange). Aromatic amino acids
are strongly conserved at the position of Tyr185, Trp189, and Phe219
(yellow). In BR, Trp86, Trp182, Tyr185, and Trp189 constitute the
chromophore binding pocket for all-trans-retinal
(gray). (B) Crystallographically observed internal water molecules
of BR (shown as green spheres). Note much higher hydration of the
extracellular half compared to the cytoplasmic one.
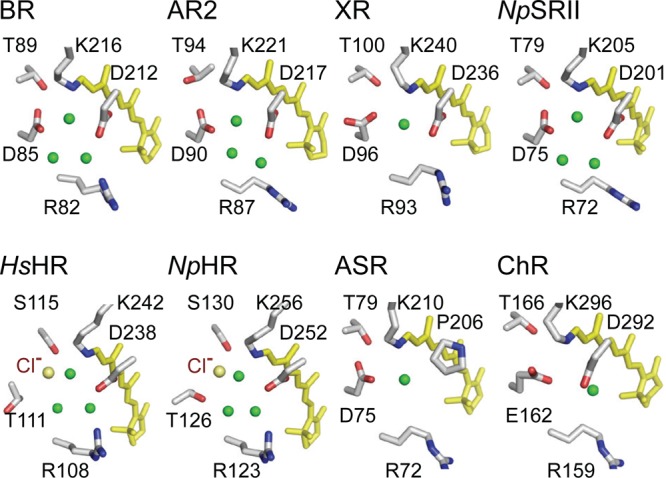
X-ray crystallographic
structures of the RSB region for eight representative
microbial rhodopsins with various transport/signaling functions. BR,
AR2 (archaerhodopsin 2), and XR function as proton pumps. NpSRII is a phototaxis sensor, but pumps protons in the
absence of its transmembrane transducer. HsHR and NpHR are chloride pumps, ASR is a photochromic sensor, and
ChR is a light-gated cation channel. Membrane normal is approximately
in the vertical direction of the figure. Upper and lower regions correspond
to the cytoplasmic and extracellular sides, respectively. Green spheres
denote ordered water molecules observed crystallographically. For
abbreviations of microbial rhodopsins, see Supporting
Information Figure 1.
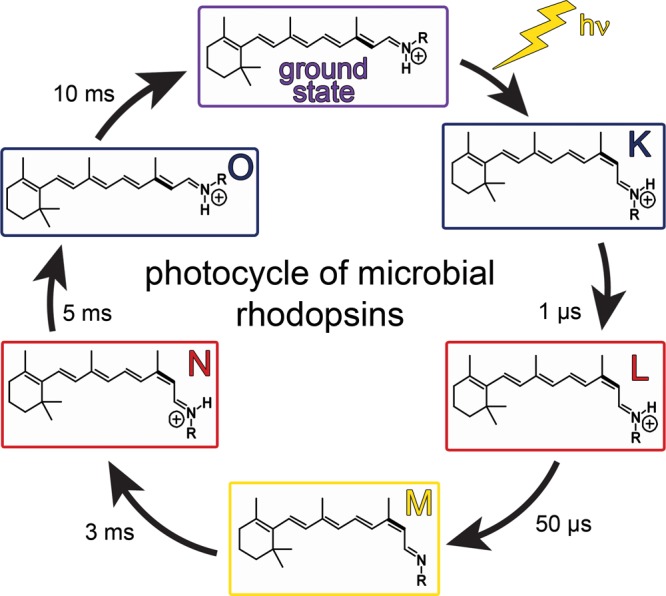
Typical photocycle of microbial rhodopsins showing isomeric
and
protonation state of the retinal. Names of the photocycle intermediates
and their characteristics were originally established for BR. In the
case of BR, K and O are the red-shifted intermediates, while L, M,
and N are all blue-shifted intermediates. The primary photoreaction
is the retinal isomerization from the all-trans,15-anti- to 13-cis,15-anti-isomer. The RSBH+ deprotonates upon M formation and is
reprotonated upon M decay. Thermal reisomerization occurs upon O formation
from the 13-cis,15-anti- to reform
the all-trans,15-anti-state.
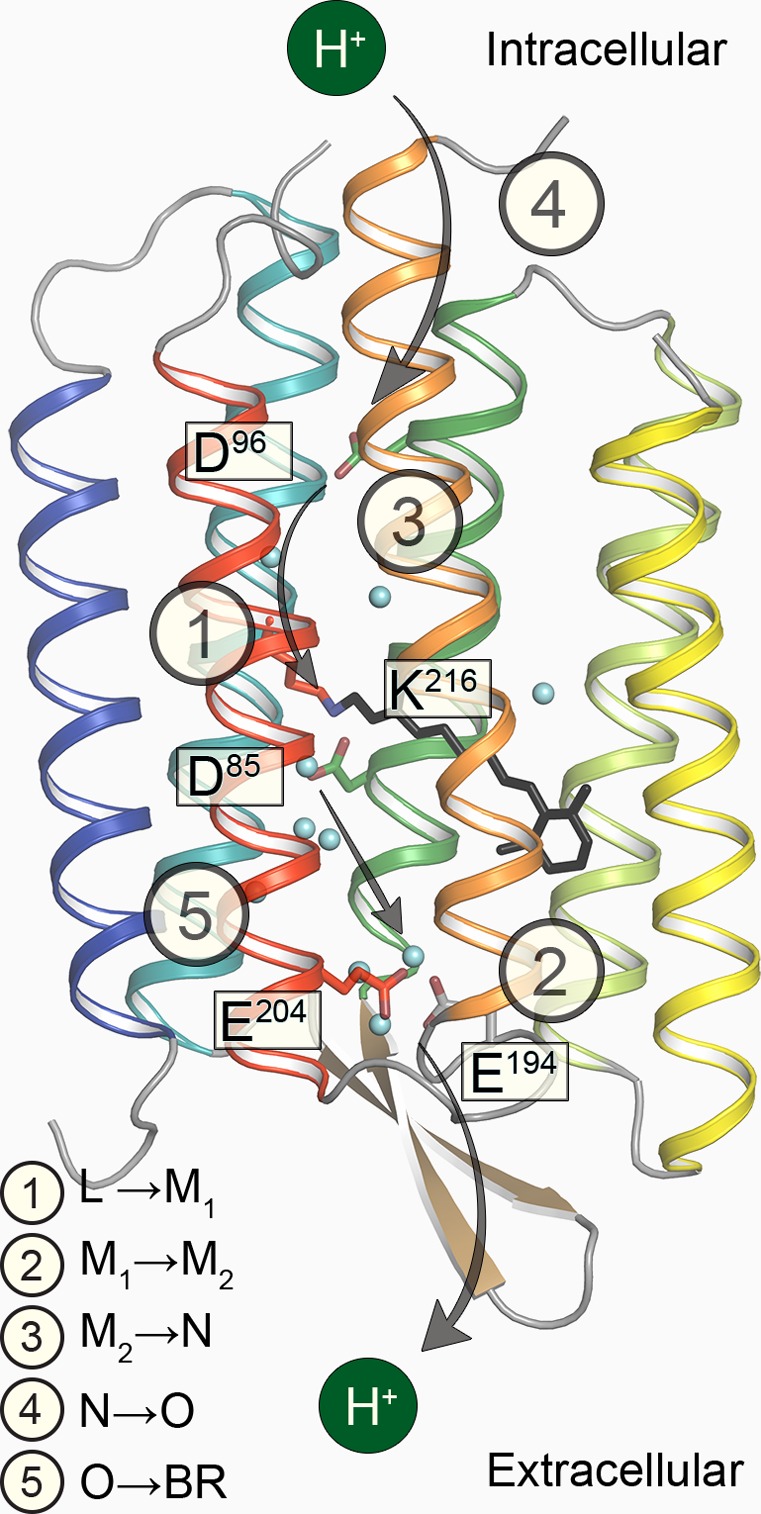
Main proton transfers
in the bacteriorhodopsin photocycle. Protonatable
groups and bound water molecules important for transport activity
are shown as stick representation and blue spheres, respectively (PDB
ID: 1C3W). Numbers
with arrows represent the sequence of proton transfer reactions, the
corresponding transitions between the photointermediates are indicated
in the inset. The TM helices are shown in the following colors: A,
blue; B, teal; C, green; D, lime green; E, yellow; F, orange; G, red;
and the chromophore is depicted as black sticks. ① Proton transfer
from the RSBH+ to the primary proton acceptor Asp85; ②
proton release to the extracellular medium from the proton-releasing
complex; ③ reprotonation of the RSB from the primary proton
donor Asp96; ④ reprotonation of Asp96 from the cytoplasmic
medium; ⑤ proton transfer from Asp85 to the proton-releasing
complex.
Sequence of the main
molecular events in the bacteriorhodopsin
photocycle and accessibility of RSB: ① absorption of a photon
by all-trans-retinal, photoisomerization to twisted
13-cis form; ② relaxation of retinal twist,
strengthening of water-mediated hydrogen-bonding between RSBH+ and Asp85; ③ proton transfer from RSBH+ to the primary proton acceptor Asp85; ④ proton release to
the extracellular medium from the proton-releasing complex and switch
of the accessibility of RSB to the cytoplasmic side; ⑤ conformational
change of the backbone in the cytoplasmic half and reprotonation of
RSB from the primary proton donor Asp96; ⑥ reprotonation of
Asp96 from the cytoplasmic medium and thermal reisomerization of retinal
to all-trans; ⑦ proton transfer from Asp85
to the proton-releasing complex and restoration of the initial conformation.
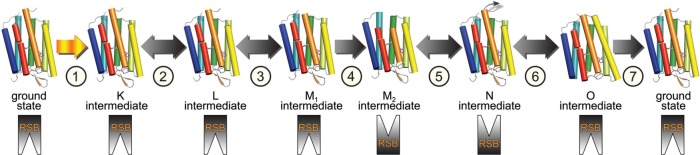
(A) Photocycle of Natronomonas
pharaonis halorhodopsin (NpHR). (B)
Light-induced hydrogen-bonding
alteration in the RSB region of NpHR (left) and bacteriorhodopsin
(BR, right), suggesting the mechanism of proton and chloride ion translocation
(refs (306, 566), respectively).
X-ray
crystallographic structure of the transmembrane part of the NpSRII–NpHtrII complex (PDB ID: 1H2S). NpSRII helices are shown in purple, and NpHtrII helices
are shown in green. (A) Side view of the complex. (B) Complex viewed
from the cytoplasmic side. Inset: Illustration of the light-induced
conformational changes of helix F of SRII and TM2 of HtrII. Because
of the tight interaction between helix F and TM2, the outward movement
of helix F in the receptor (arrow) causes a clockwise rotary motion
of TM2 in the transducer.
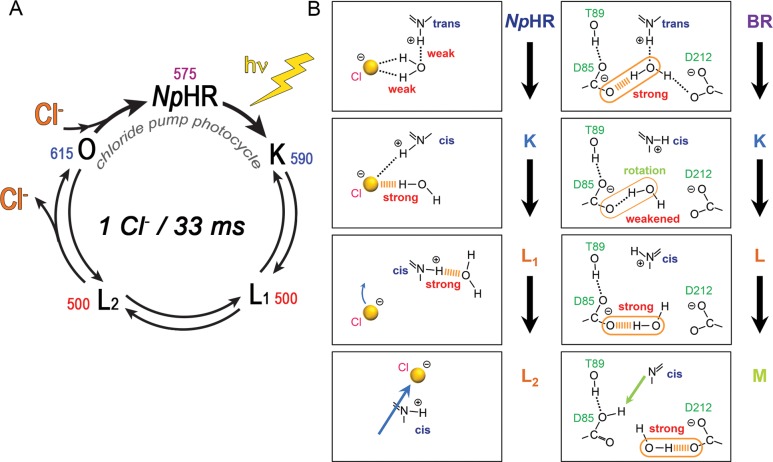
Structural model of ChR2 based on the C1C2 chimera crystal structure
as derived from extensive MD simulations. Shown are the relevant amino acids as discussed in the text and
the calculated water (blue) and sodium ion (yellow) distributions
averaged over the course of MD simulations. Insets: cation binding
site (top) and cation uptake pathway observed in MD simulations with
sodium trajectory (bottom). Cytoplasmic side of ChR2 is facing up.
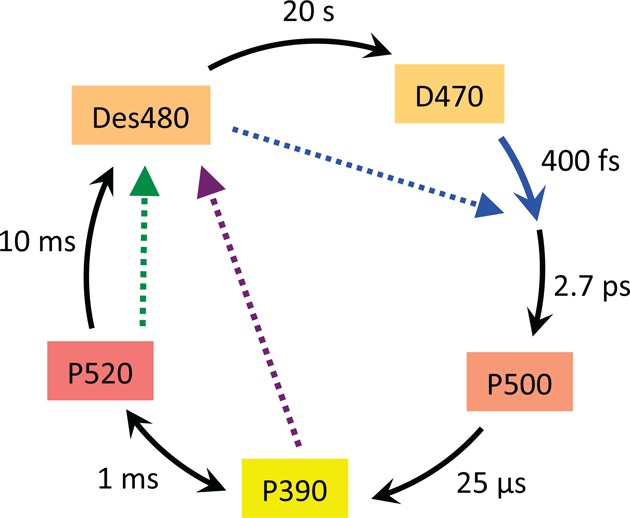
Simplified scheme of
the ChR2 photocycle with D470 as dark-adapted
state and P520 as conducting state based on data from refs (369, 370, 379, 386). It is worth noting that during
bright continuous illumination or repetitive flashing the photocycle
is fed by photoconversion of the late photocycle intermediate Des480,
the so-called desensitized or light-adapted state (blue dotted arrow).
Green and UV light photoconverts the conducting state P520 and the
early state P390, respectively, back to the light-adapted state (green
and purple dotted arrows).
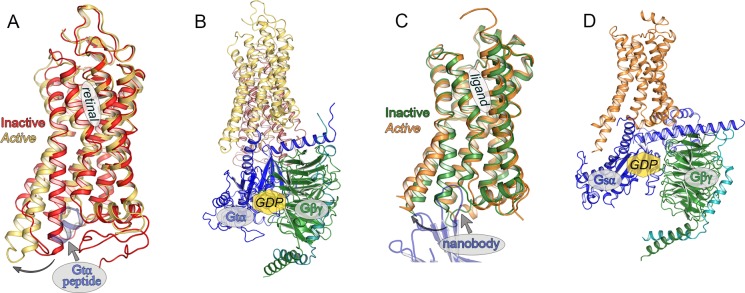
Global changes in the
structure of rhodopsin and other GPCRs upon
attainment of the active state. (A) Structural superposition of inactive
and active G-protein-interacting state of bovine Rho reveals structural
rearrangement of TM5 and TM6 to accommodate binding of the C-terminus
of the α-subunit of transducin (Gtα peptide,
shown in gray). Inactive rhodopsin (dark state; PDB ID: 1U19) is denoted in red,
and active rhodopsin (Meta II; PDB ID: 3PQR) is denoted in yellow. (B) Model of the
complex between a rhodopsin dimer and transducin built into electron
microscopy map derived from native source purified bovine rhodopsin/transducin
complex. GDP/GTP binding site is denoted by a yellow hexagon in parts
B and D although both structures are solved in the nucleotide-free
state. (C) Structural superposition of antagonist bound (inactive
state, denoted in green) and agonist bound (active state, denoted
in orange) β2-adrenergic receptors (β2AR). Structural displacement of TM5 and TM6 is similar to that seen
in the comparison shown in part A. A nanobody (shown in gray) was
utilized to stabilize the agonist bound state, and a nanobody loop
protrudes into a similar position as seen for the Gtα peptide which stabilizes the Meta II state in part A. A T4 lysozyme
(T4L) domain used to facilitate crystallization is not shown for clarity.
The antagonist bound structure is the carazolol bound β2AR-T4L fusion (PDB ID: 2RH1), and the agonist bound structure is
the nanobody stabilized, BI-167107 high affinity agonist bound structure
(PDB ID: 3POG). (D) Crystal structure of an agonist bound β2AR-T4L
fusion (T4L not shown) in complex with its cognate heterotrimeric
G protein, Gsαβγ, and a stabilizing nanobody
(not shown) reveals the mode of Gs binding to monomeric β2AR (PDB ID: 3SN6). In this complex, the Gsα C-terminus also binds
in the cleft formed by the outward movement of TM5 and TM6. All representations
are in approximately the same orientations, and all superpositions
were performed with TM1 to TM4, TM7, and cytoplasmic helix H8 to accurately
portray the differences in the positions of TM5 and TM6.
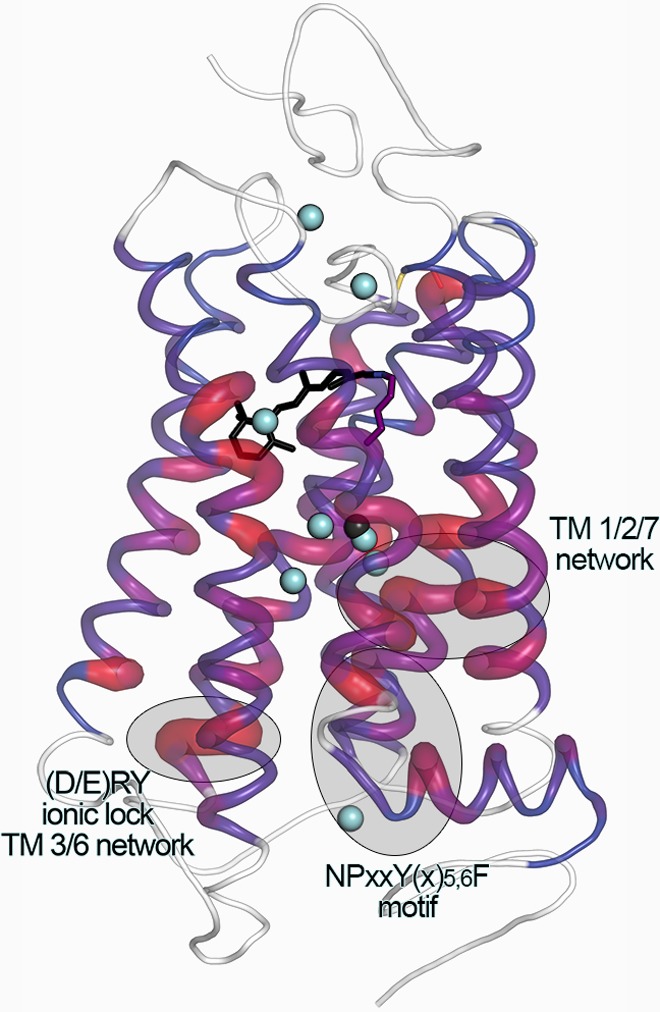
Sequence and motif conservation in GPCRs extends to ordered
bound
water molecules. Sequence conservation among rhodopsin-like (class
A) GPCR sequences was mapped onto the backbone of rhodopsin as reported
in ref (463); greater
“tube” thickness and ramping from blue to red indicate
greater residue conservation at that position. Because of considerably
lower sequence conservation outside of the TM region, these regions
were not included in the analysis and are denoted in white. Structural
superposition of all antagonist bound structures of GPCRs with a resolution
2.7 Å or higher reveals a subset of ordered water molecules that
are found within the transmembrane bundle (shown in light blue). As
indicated by the color and thickness of the cartoon representation,
these waters are found in close proximity to positions within the
TM region that have high homology throughout all class A GPCRs. Water
molecules shared among four or more different receptor structures
are shown here. In addition, density best represented by a bound octahedrally
coordinated sodium ion has been found within the TM bundle of A2A-adenosine and PAR1 receptor structures (PDB ID: 4EIY, 3VW7; shown as a black
sphere) in a similar position to a water observed in the bovine Rho
structure (PDB ID: 1U19). Three motifs important for GPCR activation
are denoted by shaded ovals.
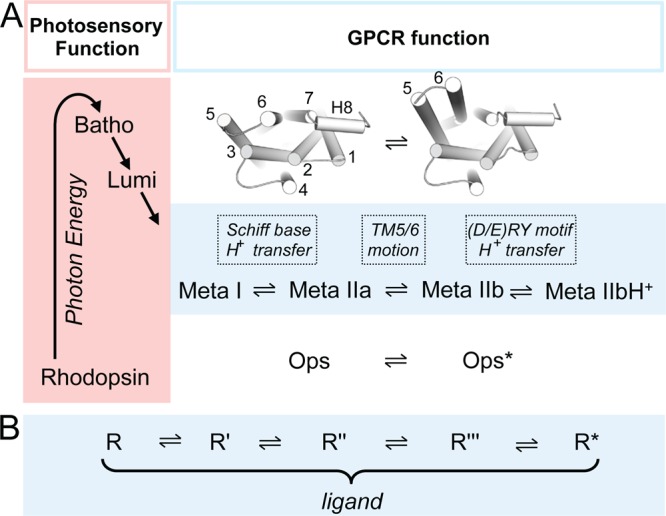
Activation states of
rhodopsin and GPCRs. (A) In the photochemical
core process, photon energy is used to convert the inverse agonist
11-cis-retinal into the full agonist all-trans-retinal. Energy stored in the initially twisted all-trans-retinylidene-Lys296 chromophore is gradually released
via local protein (side chain) conformational changes in the Batho
and Lumi photoproducts. Conformational changes in more distant parts
of the protein begin within microseconds of when Meta I forms, the
first intermediate of several Meta states in equilibrium, which as
GPCR funtional states interact with G protein, GRK1 (rhodopsin kinase),
and arrestin. Deprotonation of the RSBH+ and protonation
of its counterion Glu113 lead to the formation of Meta II substates
which develop sequentially. The largest conformational changes (inset
and Figure 19A) are observed in the transition
from Meta IIa to Meta IIb; the latter intermediate is further stabilized
by proton uptake to Glu134 of the (D/E)RY motif at the cytoplasmic
end of TM3. The retinal-free apoprotein opsin exists also in an equilibrium
between inactive (rhodopsin-like) and active (Meta-II-like) conformations,,, termed Ops and Ops*. (B) Diffusible
ligand activated GPCRs similarly exist in equilibrium between inactive
and active conformations in which similar activating conformational
changes as in the Meta states are thought to occur. Ligand binding shifts the equilibrium toward ligand type
specific energetic states.,
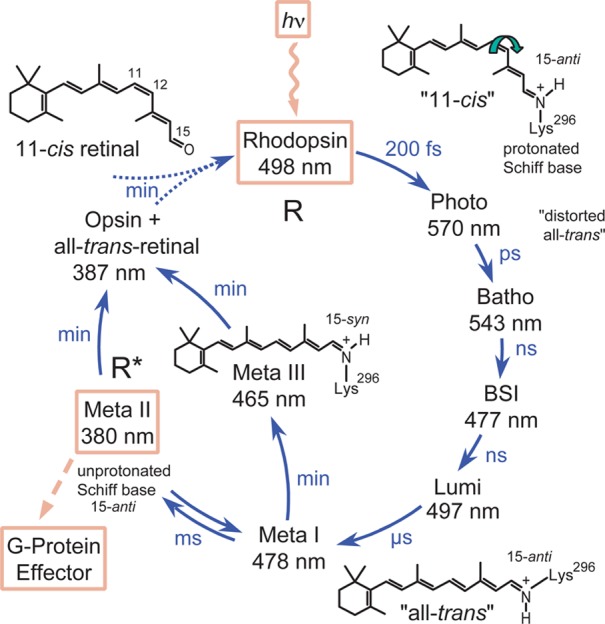
Spectroscopically detected intermediates of photoactivated bovine
rhodopsin. Photoisomerization of the retinal 11-cis double bond leads within femtoseconds to photorhodopsin with a highly
distorted 11-trans bond. Via thermal relaxation,
several intermediates form with distinct λmax values,
distinguishable by low-temperature or time-resolved spectroscopy., Gradual release of the strain in the chromophore leads through Batho
and Lumi to Meta I, as seen by the different absorption maxima that
arise from changes in chromophore/protein interaction. A transient
blue-shifted intermediate (BSI) cannot be trapped at low temperatures.
Time-resolved UV–vis measurements revealed the existence of
additional transient forms of Lumi (Lumi II),, and Meta I (Meta I380;, Meta Ib). The RSBH+ remains protonated up
through Meta I, probably due to the low pKa of the stabilizing counterion Glu113. Larger protein conformational
changes lead to Meta II (comprising substates Meta IIa and Meta IIb)
which is in equilibrium with its predecessor Meta I. Meta II is the
agonist-bound active receptor state capable of catalyzing GDP/GTP
nucleotide exchange in the G protein transducin. Meta II is characterized
by a deprotonated RSB resulting in a large blue-shifted value for
λmax (380 nm). As a result of RSB hydrolysis Meta
II decays to the apoprotein opsin and all-trans-retinal.
Meta I can also form Meta III, involving thermal isomerization of
the RSBH+ (λmax = 465 nm) from all-trans,15-anti to all-trans,15-syn. Meta III decays to opsin and all-trans-retinal, but can also be photoconverted to Meta I
and Meta II. Unlike in invertebrates,
bovine rhodopsin cannot be regenerated in situ by
reisomerization of retinal with a second photon. All-trans-retinal is reduced to retinol by retinol dehydrogenase and transported
out of the photoreceptor cell to adjacent retinal pigment epithelial
cells, where 11-cis-retinal is regenerated (for details,
see ref (551)). Adapted
with permission from ref (576). Copyright 2002 John Wiley & Sons, Inc.
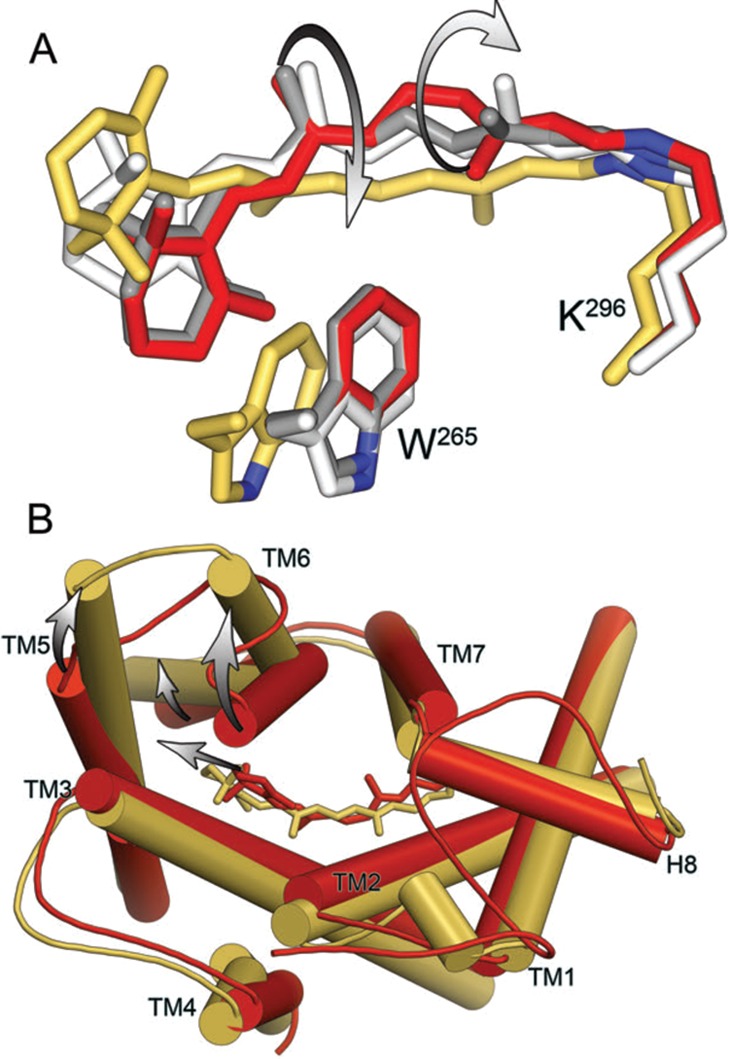
Isomerization, elongation, and rotation of retinal upon
light activation
of rhodopsin. (A) Superposition of retinal and the Lys296 and Trp265
side chains in bovine Rho (11-cis-retinal, PDB ID: 1U19, red sticks), Batho
(twisted all-trans-retinal, PDB ID: 2G87, gray sticks), Lumi
(partially relaxed all-trans-retinal, PDB ID: 2HPY, white sticks),
and Meta II (relaxed all-trans-retinal, PDB ID: 3PXO, yellow sticks)
structures. Note that from Lumi to Meta II retinal undergoes a large
rotation along its long axis. (B) Overlay of rhodopsin and Meta II
structures showing differences in the positions of the TM helices.
Note that retinal movement induces TM5 motion and rotational tilt
of TM6., View from cytoplasmic side.
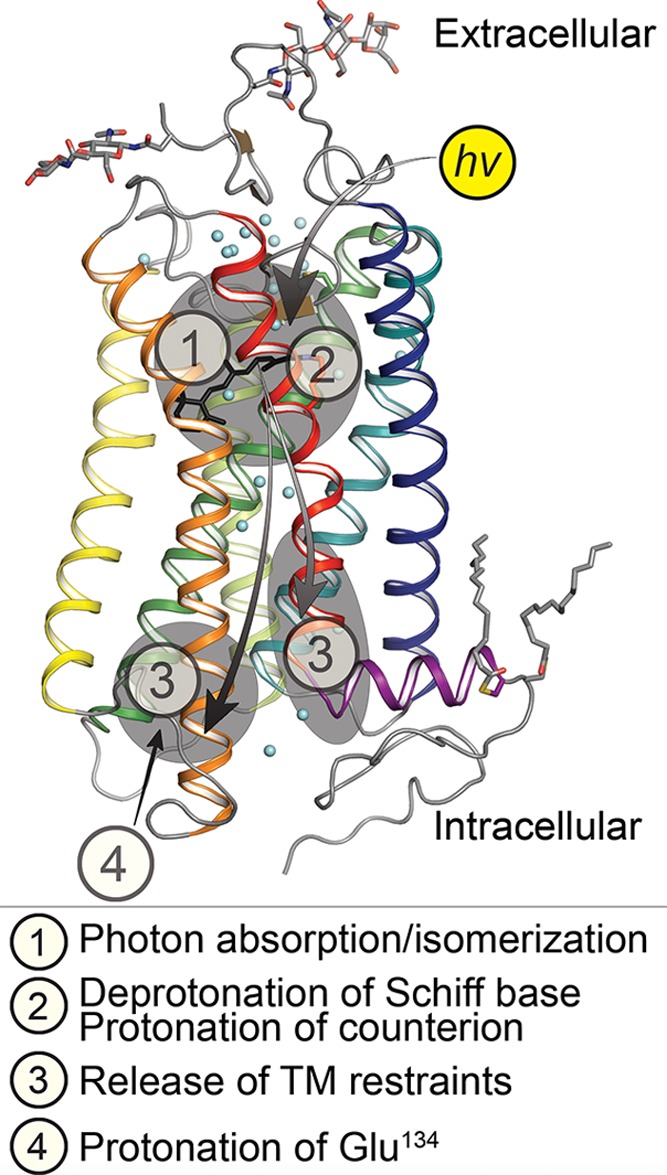
Conformational changes upon rhodopsin activation leading
to the
Meta II activated state. ① Photon absorption causes retinal cis → trans isomerization and small
scale changes in structure in the immediate vicinity of the retinal,
driving all subsequent activation steps. ② Deprotonation of
the RSBH+ along with further small-scale changes within
the TM region. ③ Signal propagation to two regions almost universally
conserved in class A GPCRs, the (D/E)RY and NPxxY(x)5,6F motifs. Changes in the (D/E)RY motif (in TM3; Glu134, Arg135, Tyr136
of bovine Rho), resulting in disruption of the “ionic lock”
between Arg135 and Glu247 (on TM6), and changes in the NPxxY(x)5,6F region (TM7/H8) which rearranges. ④ Proton uptake
from the cytoplasm onto Glu134. The TM helices are depicted in the
following colors: TM1, blue; TM2, teal; TM3, green; TM4, lime green;
TM5, yellow; TM6, orange; TM7, red; and H8, purple.
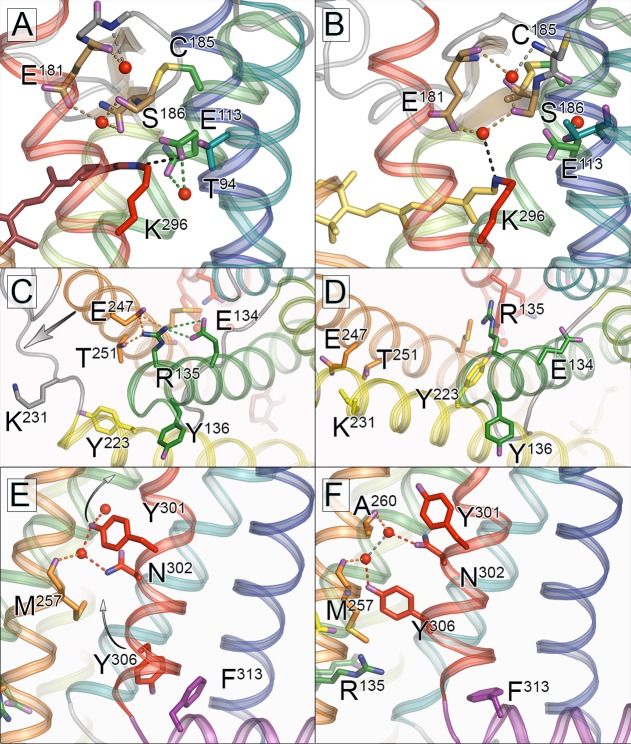
Structural changes in the chromophore binding site and
conserved
motifs that accompany bovine Rho activation. Upon light-induced activation
of Rho a series of small scale structural changes result in the release
of restraints enabling attainment of the fully active Meta II state.
(A, B) Glu181 is found hydrogen bonded to a water molecule in both
the dark state and Meta II structures, and it appears that this water
functions as a noncovalently bound cofactor which moves along with
Glu181 to stabilize the deprotonated RSB in Meta II. (C, D) TM3/TM6
restraints in the dark state due to the “ionic lock”
formed by Arg135, Glu134, Glu247, and Thr251 are released upon Rho
activation. In Meta II new interactions are formed between TM3–TM5
(Arg135–Tyr223) and TM6–TM5 (Glu247–Lys231).
(E, F) Structural changes within the NPxxY(x)5,6F motif
upon activation of Rho entail a remodeling of solvent-mediated hydrogen
bonding of two water molecules as well as a 180° change of rotamer
for Tyr306 and a concomitant shift of the conserved Phe313 residue.
For ease of interpretation, helices are depicted in the following
colors: TM1, blue; TM2, teal; TM3, green; TM4, lime green; TM5, yellow;
TM6, orange; TM7, red; and H8, purple. For all comparisons, PDB ID: 1U19 was used for dark
state and PDB ID: 3PQR was used for Meta II state.
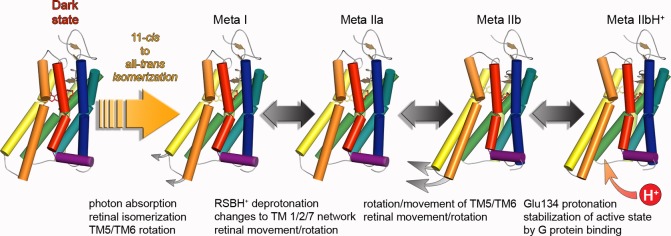
Structural and functional changes in the activation pathway of
bovine Rho based on structural and complementary biophysical data
discussed in the text and ref (490) and described in Figures 23 and 24.
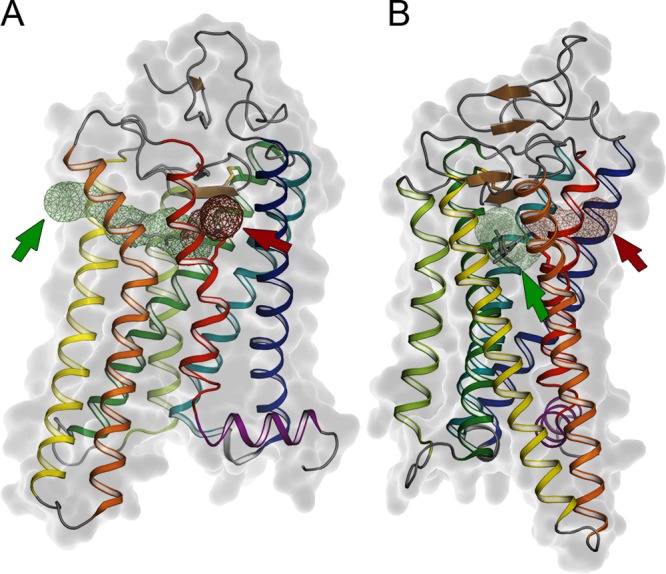
Retinal channel in the
Ops*/Meta II conformation. (A) Meta II structure
(PDB ID: 3PXO) with the putative retinal channel indicated, rotated to face opening
one (red arrow and half channel indicated in red mesh) which is located
between TM1 and TM7, and (B) rotated to face opening two (green arrow
and half channel indicated in green mesh) which is located between
TM5 and TM6. Channels were determined using MOLE on the Ops* structure (PDB ID: 3CAP). The Meta II structure was used for
the figure so that the retinal could be shown as it is absent in the
Ops* structure.
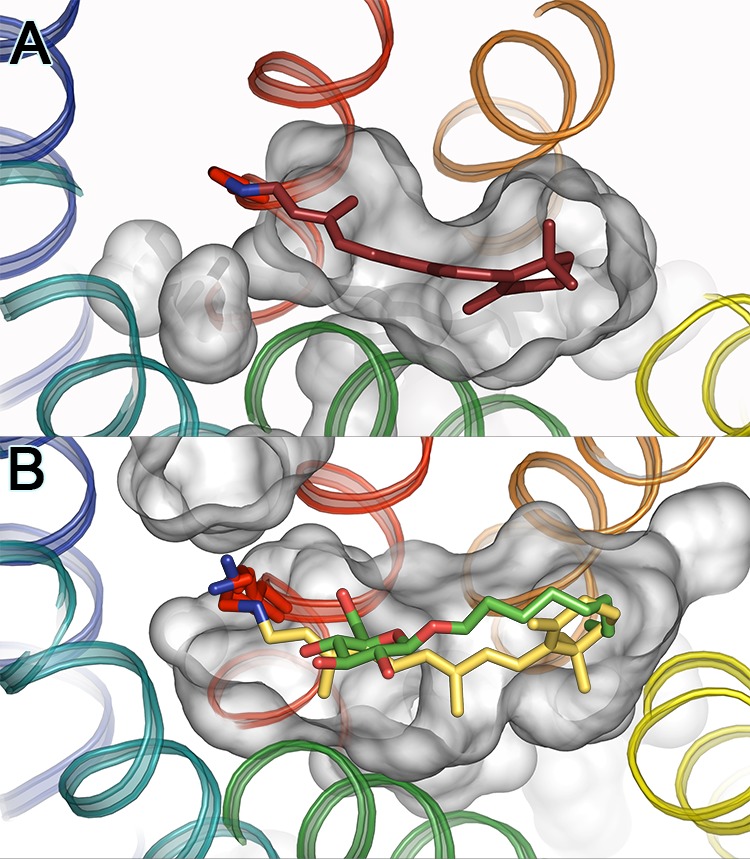
Retinal binding site of bovine rhodopsin. (A) Crystal structure
of inactive dark state (PDB ID: 1U19) where 11-cis-retinal
is tightly bound deep in the protein with no openings of the retinal
binding site toward the lipidic environment. (B) In the active Ops*
(or Meta II) conformation the retinal channel allows all-trans-retinal access and egress, and some detergents like β-d -octylglucoside, mimicking the all-trans-retinal
chromophore, to enter the retinal binding site. Shown is an overlay
of the two ligands in the retinal binding pocket as observed in the
crystal structures of Meta II (all-trans-retinal
depicted in yellow; PDB ID: 3PXO) and Ops* in complex with β-d -octylglucoside
(depicted in green/red; two rotamers of Lys296 are shown in red; PDB
ID: 4J4Q). Note
that the ring moieties of chromophore and detergent are oriented in
opposite directions. Whereas all-trans-retinal is
covalently linked by the RSB to Lys296, β-d -octylglucoside
is fixed in the ligand binding site by hydrogen bonding of its hydroxyl
groups to the opsin environment.
Similar articles
-
Light-driven ion-translocating rhodopsins in marine bacteria.Trends Microbiol. 2015 Feb;23(2):91-8. doi: 10.1016/j.tim.2014.10.009. Trends Microbiol. 2015. PMID: 25432080 Review.
-
Eubacterial rhodopsins - unique photosensors and diverse ion pumps.Biochim Biophys Acta. 2014 May;1837(5):553-61. doi: 10.1016/j.bbabio.2013.05.006. Epub 2013 Jun 6. Biochim Biophys Acta. 2014. PMID: 23748216 Review.
-
Crossing the borders: archaeal rhodopsins go bacterial.Trends Microbiol. 2003 Sep;11(9):405-7. doi: 10.1016/s0966-842x(03)00203-8. Trends Microbiol. 2003. PMID: 13678852 No abstract available.
-
Microbial Rhodopsins.Methods Mol Biol. 2022;2501:1-52. doi: 10.1007/978-1-0716-2329-9_1. Methods Mol Biol. 2022. PMID: 35857221
-
Ion-pumping microbial rhodopsin protein classification by machine learning approach.BMC Bioinformatics. 2023 Jan 27;24(1):29. doi: 10.1186/s12859-023-05138-x. BMC Bioinformatics. 2023. PMID: 36707759 Free PMC article.
Cited by
-
Optogenetic restoration of high sensitivity vision with bReaChES, a red-shifted channelrhodopsin.Sci Rep. 2022 Nov 11;12(1):19312. doi: 10.1038/s41598-022-23572-4. Sci Rep. 2022. PMID: 36369267 Free PMC article.
-
The Desensitized Channelrhodopsin-2 Photointermediate Contains 13 -cis, 15 -syn Retinal Schiff Base.Angew Chem Int Ed Engl. 2021 Jul 19;60(30):16442-16447. doi: 10.1002/anie.202015797. Epub 2021 Jun 17. Angew Chem Int Ed Engl. 2021. PMID: 33973334 Free PMC article.
-
Fluorescence of the Retinal Chromophore in Microbial and Animal Rhodopsins.Int J Mol Sci. 2023 Dec 8;24(24):17269. doi: 10.3390/ijms242417269. Int J Mol Sci. 2023. PMID: 38139098 Free PMC article. Review.
-
Characterization of an Unconventional Rhodopsin from the Freshwater Actinobacterium Rhodoluna lacicola.J Bacteriol. 2015 Aug;197(16):2704-12. doi: 10.1128/JB.00386-15. Epub 2015 Jun 8. J Bacteriol. 2015. PMID: 26055118 Free PMC article.
-
Early-stage dynamics of chloride ion-pumping rhodopsin revealed by a femtosecond X-ray laser.Proc Natl Acad Sci U S A. 2021 Mar 30;118(13):e2020486118. doi: 10.1073/pnas.2020486118. Proc Natl Acad Sci U S A. 2021. PMID: 33753488 Free PMC article.
References
Publication types
MeSH terms
Substances
Grants and funding
LinkOut - more resources
Full Text Sources
Other Literature Sources
