. 2014 Feb 21;289(8):5184-98.
doi: 10.1074/jbc.M113.518241. Epub 2013 Dec 18.

MicroRNA-339-5p down-regulates protein expression of β-site amyloid precursor protein-cleaving enzyme 1 (BACE1) in human primary brain cultures and is reduced in brain tissue specimens of Alzheimer disease subjects

Affiliations

MicroRNA-339-5p down-regulates protein expression of β-site amyloid precursor protein-cleaving enzyme 1 (BACE1) in human primary brain cultures and is reduced in brain tissue specimens of Alzheimer disease subjects

Justin M Long et al. J Biol Chem. .

Abstract

Alzheimer disease (AD) results, in part, from the excess accumulation of the amyloid-β (Aβ) peptide as neuritic plaques in the brain. The short Aβ peptide is derived from the large transmembrane Aβ precursor protein (APP). The rate-limiting step in the production of Aβ from APP is mediated by the β-site APP-cleaving enzyme 1 (BACE1). Dysregulation of BACE1 levels leading to excess Aβ deposition is implicated in sporadic AD. Thus, elucidating the full complement of regulatory pathways that control BACE1 expression is key to identifying novel drug targets central to the Aβ-generating process. MicroRNAs (miRNAs) are expected to participate in this molecular network. Here, we identified a known miRNA, miR-339-5p, as a key contributor to this regulatory network. Two distinct miR-339-5p target sites were predicted in the BACE1 3'-UTR by in silico analyses. Co-transfection of miR-339-5p with a BACE1 3'-UTR reporter construct resulted in significant reduction in reporter expression. Mutation of both target sites eliminated this effect. Delivery of the miR-339-5p mimic also significantly inhibited expression of BACE1 protein in human glioblastoma cells and human primary brain cultures. Delivery of target protectors designed against the miR-339-5p BACE1 3'-UTR target sites in primary human brain cultures significantly elevated BACE1 expression. Finally, miR-339-5p levels were found to be significantly reduced in brain specimens isolated from AD patients as compared with age-matched controls. Therefore, miR-339-5p regulates BACE1 expression in human brain cells and is most likely dysregulated in at least a subset of AD patients making this miRNA a novel drug target.

Keywords: Aging; Alzheimer Disease; Dementia; Gene Regulation; Human Brain Tissue; Human Neuron; MicroRNA; Noncoding RNA; Secretases; β-Peptide.


Figures
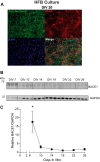
FIGURE 1.
FIGURE 1.
HFB culture morphology and time profile of BACE1 levels. A, primary HFB cultures at DIV 20 were co-labeled with a pan-neuronal antibody mixture and anti-glial fibrillary acidic protein (GFAP). Arrows point to cells only labeled with the pan-neuronal mixture. Arrowheads point to cells only labeled by anti-GFAP. This panel was originally published by the authors in Ref. . B, Western blot analysis of BACE1 and GAPDH levels across time (DIV 7 to DIV 26) in an HFB culture. C, densitometric analysis of BACE1 normalized to GAPDH demonstrated that BACE1 levels rapidly decrease from DIV 7 to DIV 14 and exhibit lowest expression levels at DIV 18 (*, p < 0.001 versus all time points by Tukey's Honestly Significant Difference test).
FIGURE 2.
FIGURE 2.
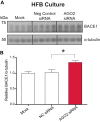
Knockdown of miRNA effector protein AGO2 enhances expression of BACE1 in primary HFB cultures. A, effect of disrupting global miRNA functionality on BACE1 expression in HFB was assessed by using siRNA-mediated knockdown of AGO2. Cultures were transfected at DIV 18 and lysates prepared 48 h post-transfection (DIV 20). Protein levels of BACE1 and α-tubulin were assayed by Western blot. B, blots were quantified by densitometric analysis and BACE1 levels normalized to α-tubulin levels and scaled relative to negative control transfection. BACE1 levels were significantly increased in primary HFB cultures transfected with an AGO2 siRNA as compared with transfection with a negative control siRNA (1.318 ± 0.051-fold change; *, p = 0.043 by two-tailed Student's t test; n = 4).
FIGURE 3.
FIGURE 3.
miR-339-5p targets human BACE1 3′-UTR via poorly conserved sites. A, schematic of the BACE1 transcript demonstrating location of two putative miR-339-5p target sites in the 3′-UTR predicted by the TargetScan, rna22, miRanda-mirSVR, and PITA algorithms. B, sequence and predicted base-pairing of human miR-339-5p with its two predicted target sites in the human BACE1 3′-UTR, including the seed sequence interactions (red boxes). To assess site conservation, multiple genome alignments for mammalian species were pulled from TargetScan. Sequences from rhesus macaque, mouse, rat, and horse from positions orthologous to the predicted miR-339-5p target sites in the human BACE1 3′-UTR are shown. Red text highlights nucleotide differences compared with the human sequence. C, schematic of the BACE1 3′-UTR reporter construct prepared from the psiCHECK-2 vector, with the 3′-UTR placed downstream of the Renilla luciferase CDS. Firefly luciferase is independently transcribed and serves as an internal control. The predicted target sites in the BACE1 3′-UTR reporter construct were mutated by site-directed mutagenesis. A double mutant containing both mutations was also constructed. Red text highlights mutations introduced in seed sequence. D, wild-type and target site mutant reporter constructs were transfected into HeLa cells either alone or along with 50 nm negative control and miR-339-5p mimic. Renilla and firefly luciferase assays were performed 48 h post-transfection and analyzed as relative ratios of Renilla to firefly luciferase activity. miR-339-5p reduced reporter expression (0.53 ± 0.025-fold change; *, p < 0.0001 by two-tailed Student's t test) as compared with negative control. Site 2 mutation did not completely eliminate the inhibitory effect of miR-339-5p on reporter expression (0.731 ± 0.011-fold change compared with negative control reporter; *, p = 0.0001 by two-tailed Student's t test), whereas mutation of both target sites completely eliminated the inhibitory effect. Compared with wild type, the difference in reporter expression following miR-339-5p transfection as compared with negative control mimic transfection was significantly attenuated in both the site 2 mutant (0.57 ± 0.09-fold) and the double site mutant (−0.22 ± 0.17-fold) as compared with wild-type construct (p < 0.01 by analysis of variance followed by post hoc Dunnett's t test). White bars indicate transfections with the WT reporter construct. Red bars indicate transfections with the site 2 mutant reporter construct. Blue bars indicate transfections with the double mutant reporter construct. CDS, coding sequence; luc, luciferase; prom, promoter. (n = 5).
FIGURE 4.
FIGURE 4.
miR-339-5p delivery down-regulates BACE1 expression and Aβ levels in U373 cells. A, human glioblastoma U373 cells were transfected with 150 nm of either miR-29b (positive control), miR-339-5p mimic, or negative control mimic, and BACE1 levels were assayed 72 h post-transfection by Western blot. B, blots from Fig. 4A were quantified by densitometric analysis and BACE1 protein levels normalized to β-actin levels and scaled relative to mock transfection. Both miR-29b (0.125 ± 0.013-fold change; *, p < 0.01 by post hoc Dunnett's t test) and miR-339-5p (0.373 ± 0.038-fold change; *, p < 0.01 by post hoc Dunnett's multiple comparison test) reduced BACE1 protein levels as compared with negative control mimic (n = 4). C, BACE1 mRNA levels were significantly decreased following miR-339-5p transfection relative to negative control mimic as measured by RT-qPCR (0.24 ± 0.01-fold change; *, p = 0.0002 by two-tailed Student's t test; n = 3). 150 nm miRNA mimic and 20 nm siRNA was transfected. RNA was extracted 48 h post-transfection as described under “Experimental Procedures.” RT-qPCR expression levels were normalized to the geometric mean of B2M, GAPDH, and TATA-binding protein expression levels and further scaled relative to mock-transfected levels. D and E, miR-339-5p reduces secretion of Aβ(1–40) and Aβ(1–42) into the conditioned media of U373 cells. U373 cells were either mock-transfected, transfected with 20 nm BACE1 siRNA, 150 nm negative control, or miR-339-5p mimic. Conditioned media were collected 48 h post-transfection. Aβ(1–40) and Aβ(1–42) levels were independently measured in conditioned media by specific sandwich ELISA as described under “Experimental Procedures.” Absolute values (picograms/ml) were normalized to the total protein yield of crude cell lysates to account for variability associated with differences in cell number and viability and scaled relative to mock transfection as described under “Experimental Procedures.” Transfection of miR-339-5p significantly reduced levels of Aβ(1–40) (0.39 ± 0.07-fold change; *, p = 0.0012 by two-tailed Student's t test) (D) and Aβ(1–42) (0.67 ± 0.05-fold change; *, p = 0.0071 by two-tailed Student's t test) (E) released in the CM of U373 cultures as compared with negative control-transfected cultures (n = 3).
FIGURE 5.
FIGURE 5.
miR-339-5p delivery reduces BACE1 protein expression and Aβ levels in primary HFB cultures. A, HFB cultures were transfected with 150 nm miR-339-5p mimic or negative control at DIV 17 and lysates prepared 48 h post-transfection (DIV 19). siRNA (20 nm) transfection was included as delivery control. Levels of BACE1 were assayed by Western blot. Ponceau stain of blotted region are also presented to demonstrate uniform transfer and equal protein loading across lanes. B, blots from A were quantified by densitometric analysis, and BACE1 levels were normalized to total protein levels in the 50-kDa region of blot and scaled relative to mock transfection (n = 3–4). miR-339-5p delivery significantly reduced BACE1 levels relative to negative control mimic (0.86 ± 0.04-fold change; *, p = 0.0224 by two-tailed Student's t test). C and D, miR-339-5p reduces secretion of Aβ(1–40) and Aβ(1–42) into the conditioned media of HFB cultures. HFB cells were either mock-transfected, transfected with 20 nm BACE1 siRNA, 150 nm negative control, or miR-339-5p mimic. Aβ levels were measured by ELISA as explained under “Experimental Procedures.” Absolute values (picograms/ml) were normalized to CTG values to account for variability attributable to differences in cell number and viability and then scaled relative to mock transfection. D, miR-339-5p significantly reduced Aβ(1–40) (0.79 ± 0.02-fold change; *, p = 0.0018) and Aβ(1–42) levels (0.79 ± 0.07-fold change; *, p = 0.0122) in CM as compared with negative control mimic. n = 4.
FIGURE 6.
FIGURE 6.
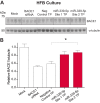
Blocking miR-339-5p interaction with each of two predicted target sites in the BACE1 mRNA 3′-UTR elevates BACE1 levels. A, Western blot analysis of BACE1 and α-tubulin levels in transfected HFB cultures. HFB cultures at DIV 17 were either mock-transfected or transfected with 1000 nm negative control target protector or custom-designed target protectors designed to inhibit interaction of miR-339-5p specifically with predicted site 1 or site 2 in the BACE1 mRNA 3′-UTR. BACE1 siRNA (20 nm) transfection was included as a delivery control. Cell lysates for proteins were prepared 48 h post-transfection. B, densitometric analysis of blots from A. BACE1 levels were elevated following transfection with site 1 target protector but not statistically significant (1.351 ± 0.139-fold change; p > 0.05 by Dunnett's multiple comparison test). BACE1 levels were significantly elevated following transfection with site 2 target protector (1.499 ± 0.101-fold change; *, p < 0.05 by Dunnett's multiple comparison test). n = 4. TP, target protector.
FIGURE 7.
FIGURE 7.
Analysis of BACE1 protein levels in control and AD human brain specimens. A, Western blot analysis of BACE1 in brain specimens (BA9 of frontal cortex) from AD and control patients. Ponceau stain of blotted region is also presented to demonstrate equal protein loading across lanes. B, blot from A was densitometrically analyzed and BACE1 levels normalized to total protein in the blotted region based on Ponceau stain and scaled relative to control BACE1 levels. BACE1 levels were significantly higher in AD specimens as compared with control specimens (*, p = 0.0046 by two-tailed Student's t test). Ponceau normalization was employed due to variable degradation of α-tubulin and β-actin across lanes despite equal protein loading. C, control group (n = 5); AD, AD group (n = 15). AD*, specimens were excluded from analysis due to uncertain medication exposure history. These specimens were excluded a priori for analyses in Fig. 7.
FIGURE 8.
FIGURE 8.
miR-339-5p levels are dysregulated in AD brain specimens. RT-qPCR analysis of expression levels for miR-124 (A) and miR-339-5p (B) in brain specimens (BA9 of frontal cortex) from AD and control patients. Expression levels were quantified in absolute terms as miRNA copy counts per 15 pg of total RNA. Copy counts were calculated from standard curves prepared by serial dilutions of miRNA oligonucleotide standards with known concentrations. miR-124 levels were somewhat lower in AD specimens as compared with control specimens but not statistically significant (p = 0.1928 by two-tailed Student's t test). miR-339-5p levels were significantly lower in AD brain specimens as compared with control brain specimens (0.55 ± 0.04-fold change; *, p = 0.0339 by two-tailed Student's t test). n = 5 for control, n = 14 for AD in A and n = 15 for AD in B. A contains one fewer AD specimens due to technical failure in the qPCR run for this specimen.

Similar articles

Cited by

References

    1. Thies W., Bleiler L., and Alzheimer's Association (2013) 2013 Alzheimer's disease facts and figures. Alzheimers Dement. 9, 208–245 - PubMed
    1. Lahiri D. K., Maloney B., Zawia N. H. (2009) The LEARn model: an epigenetic explanation for idiopathic neurobiological diseases. Mol. Psychiatry 14, 992–1003 - PMC - PubMed
    1. Lahiri D. K. (2012) Prions: a piece of the puzzle? Science 337, 1172. - PubMed
    1. Hardy J., Selkoe D. J. (2002) The amyloid hypothesis of Alzheimer's disease: progress and problems on the road to therapeutics. Science 297, 353–356 - PubMed
    1. Karran E., Mercken M., De Strooper B. (2011) The amyloid cascade hypothesis for Alzheimer's disease: an appraisal for the development of therapeutics. Nat. Rev. Drug Discov. 10, 698–712 - PubMed

Publication types

MeSH terms

LinkOut - more resources