. 2013;9(12):e1003828.
doi: 10.1371/journal.ppat.1003828. Epub 2013 Dec 12.

Nodular inflammatory foci are sites of T cell priming and control of murine cytomegalovirus infection in the neonatal lung

Affiliations

Nodular inflammatory foci are sites of T cell priming and control of murine cytomegalovirus infection in the neonatal lung

Felix R Stahl et al. PLoS Pathog. 2013.

Abstract

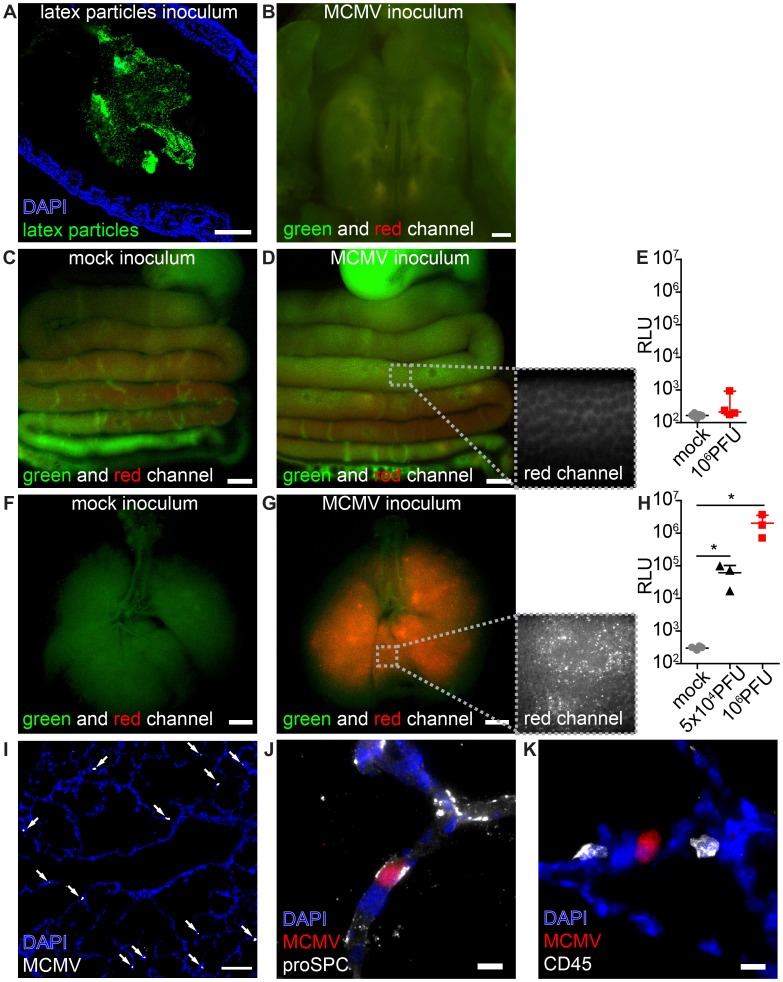
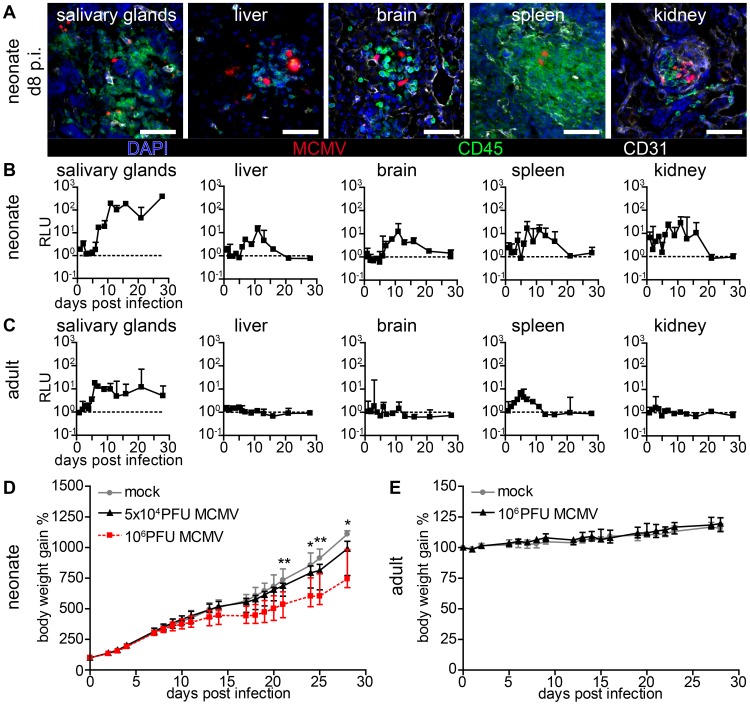
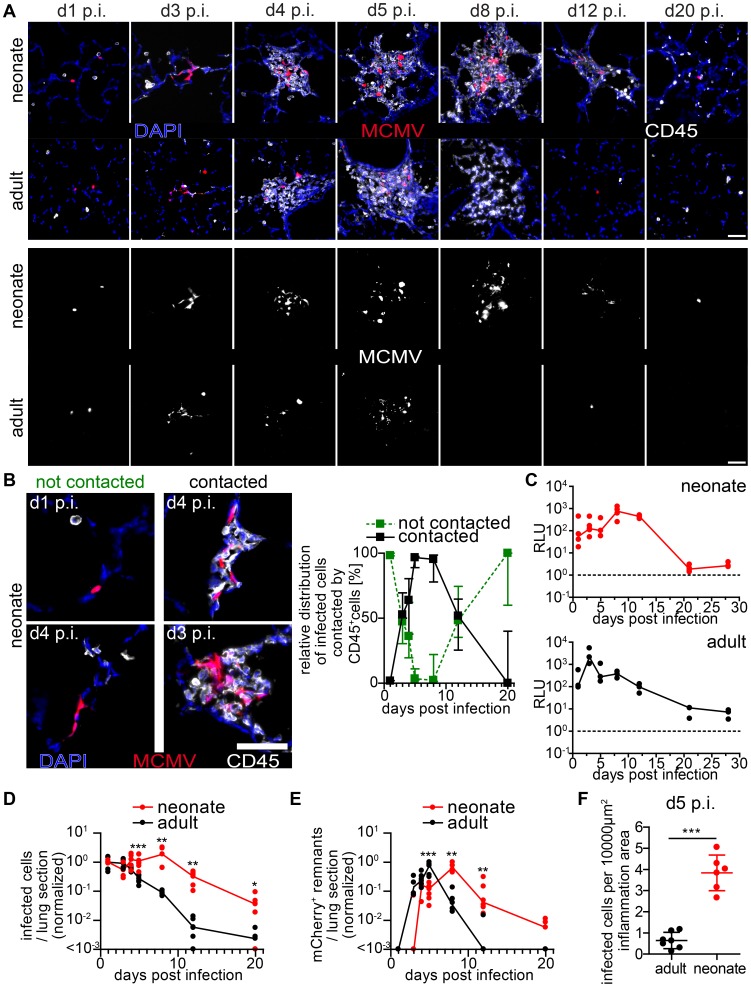
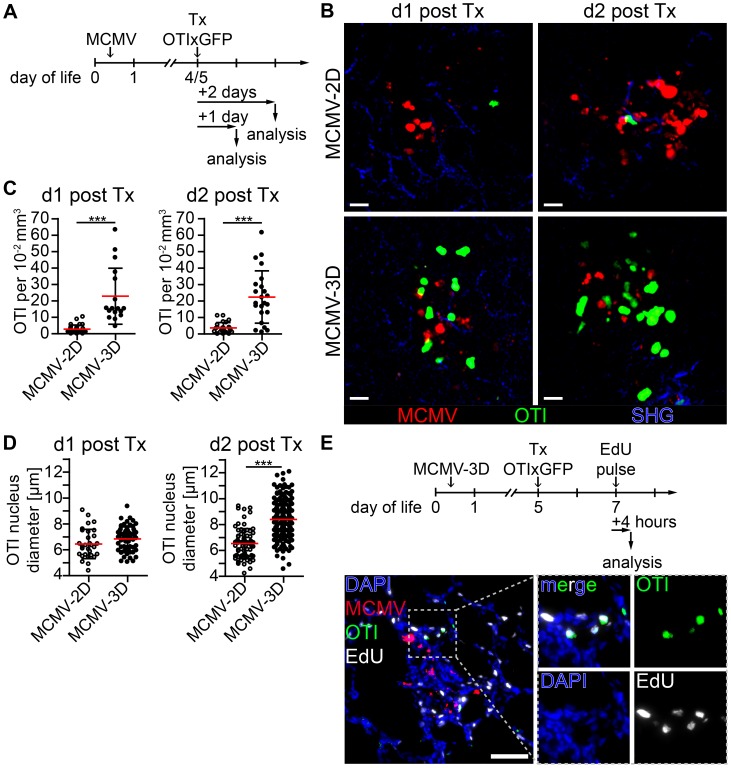
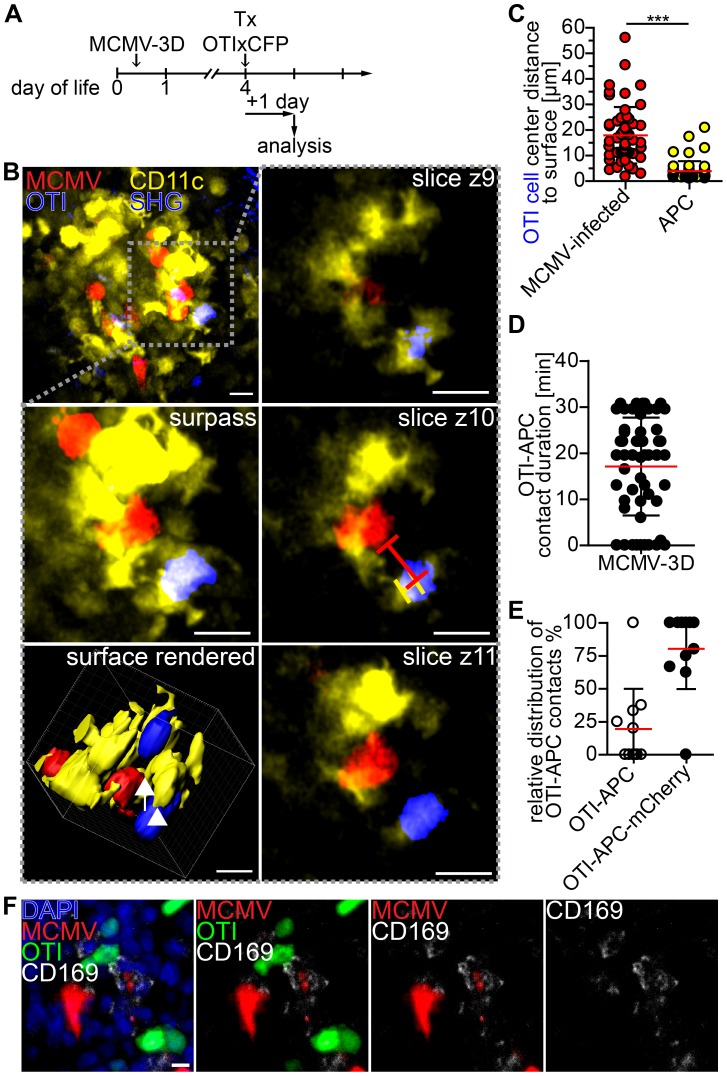
Neonates, including mice and humans, are highly susceptible to cytomegalovirus (CMV) infection. However, many aspects of neonatal CMV infections such as viral cell tropism, spatio-temporal distribution of the pathogen as well as genesis of antiviral immunity are unknown. With the use of reporter mutants of the murine cytomegalovirus (MCMV) we identified the lung as a primary target of mucosal infection in neonatal mice. Comparative analysis of neonatal and adult mice revealed a delayed control of virus replication in the neonatal lung mucosa explaining the pronounced systemic infection and disease in neonates. This phenomenon was supplemented by a delayed expansion of CD8(+) T cell clones recognizing the viral protein M45 in neonates. We detected viral infection at the single-cell level and observed myeloid cells forming "nodular inflammatory foci" (NIF) in the neonatal lung. Co-localization of infected cells within NIFs was associated with their disruption and clearance of the infection. By 2-photon microscopy, we characterized how neonatal antigen-presenting cells (APC) interacted with T cells and induced mature adaptive immune responses within such NIFs. We thus define NIFs of the neonatal lung as niches for prolonged MCMV replication and T cell priming but also as sites of infection control.


Conflict of interest statement

The authors have declared that no competing interests exist.

Figures

Figure 1
Figure 1. MCMV infects the neonatal lung but not the mucosa of the gastrointestinal tract.
Neonatal mice were (A–E) fed or (F–K) l.p. infected with either (A) latex microspheres, (C, E, F, H) mock inoculums, (H, I–K) 5×10⁴ PFU or (B, D, E, G, H) 106 PFU of MCMV-3D and analyzed one day after application. (A) Histological analysis of distal colon after inoculation of latex microspheres. (B) Oral cavity with bony palate was analyzed by epifluorescence microscopy, green and red channels show autofluorescent tissue. (C–E) Intestines were explanted from the proximal esophagus to distal colon in one piece, (F–H) respiratory tract with trachea. (C) Mock inoculum and (D) MCMV-3D inoculum show only autofluorescent tissue but no mCherry+ cells in the intestine, inlay in (D) shows autofluorescence in the red channel in high magnification. Luciferase activity from homogenates of (E) flushed intestines or (H) lungs. (F) Mice after mock inoculation show autofluorescent tissue or (G) multiple mCherry+ cells, inlay displays single mCherry+ cells in high magnification. (I–K) Frozen sections of infected neonatal lungs. (I) Overview with solitary mCherry+ infected cells (arrows). (J, K) Solitary mCherry+ infected cell with (J) pro-surfactant protein C (proSPC) or (K) CD45 staining. (A–D, F, G, I–K) Representative from >3 experiments with n = 2–3 animals per experiment. (E) Pooled from two independent experiments, n = 4–5, median & range. (H) Pooled from two independent experiments, n = 3–4, median & range. Scale bars: (B–D, F, G) 1000 µm, (A, I) 100 µm and (J, K) 10 µm.
Figure 2
Figure 2. Viral dissemination establishes infection in multiple organs in neonatal but not in adult mice.
(A–C) Neonatal or adult mice were infected as follows: neonates l.p. with 5×10⁴ PFU MCMV-3D, adults intranasal with 106 PFU MCMV-3D. (A) Frozen sections of explanted neonatal organs were performed at day 8 after infection and analyzed after indicated antibody and DAPI staining, n>2 animals from >2 independent experiments. (B, C) Animals were sacrificed at indicated time-points after infection and homogenates of single organ preparations were measured for luciferase activity, shown are median & range and connecting line of medians, n = 3 animals per indicated time-points >3 independent experiments, dashed line = detection limit. (D+E) Body weight gain after MCMV-3D infection in (D) neonatal or (E) adult mice with the virus doses as indicated, median+IQR, pooled from two independent experiments each, n = 6–8 per group. Student's t-test between (D) mock and 5×10⁴ PFU group and (E) mock and 106 PFU group.
Figure 3
Figure 3. Characterization of “nodular inflammatory foci” in the neonatal lung 5 days after MCMV-3D infection.
(A–E, G–J) Wildtype or (F) Ncr1gfp/+ neonatal mice were l.p. infected with 5×10⁴ PFU MCMV-3D, 5 days later mice were sacrificed and lungs explanted. (A, C–E, G–J) Frozen sections were stained with antibodies as indicated and DAPI nuclear staining. (B) Paraffin embedded sections were analyzed after hematoxylin and eosin staining. (C–E) Cellular composition of nodular inflammatory foci. (F) Frozen sections from Ncr1gfp/+ mice were analyzed by 2-photon microscopy. (A, B) Overview with multiple nodular inflammatory foci (frames in A and B) and solitary mCherry+ infected cells (arrowheads in A), (B) one nodular inflammatory focus is magnified. (G) Morphological discrimination between viable infected cells (arrows) and remnants (arrowheads) of infected cells. (H–J) Remnants engulfed by phagocytes are indicated by arrowheads. Scale bars: (A+B) 100 µm, (C–E, G) 50 µm, (F, H–J) 20 µm. AF = autofluorescence of tissue, (A–J) representative of n>6 from >3 independent experiments.
Figure 4
Figure 4. Delayed control of lung MCMV infection in neonatal mice.
Neonatal (A–F) or adult (A, C–F) mice were infected as follows: neonates l.p. with 5×10⁴ PFU MCMV-3D, adults intranasal with 106 PFU MCMV-3D. (A–F) Animals were sacrificed at indicated time-points after infection and frozen sections of explanted lungs were performed and analyzed after antibody and DAPI staining. (A) Upper rows show merged images of immune infiltrates associated with MCMV-infected cells (mCherry+), lower rows only mCherry signals. (B) Examples and relative distribution of infected cells that are either “contacted” or “not contacted” by neonatal immune cells. (C) Luciferase activity of homogenized lung explants from n = 3–5 animals from 1–2 experiments per time point. (D+E) Number of mCherry+ viable cells or remnants per lung slice, determined by 2 counted slices per animal, normalized to (D) mean of infected cells determined at day 1 p.i or (E) normalized to the maximal value of remnants per group; zero counts were set to <10−3 to allow logarithmic illustration, t-test between groups at indicated time-points, n = 2–4 animals per indicated time-point from >3 independent experiments. (F) Number of mCherry+ viable cells per lung slice at day 5 p.i., frozen sections of n = 6–7 animals from 2 independent experiments. (B) Median & range, (C–E) each value and a connecting line of medians, (F) mean & SD.
Figure 5
Figure 5. Delayed expansion of MCMV-specific T cells contributes to susceptibility of neonates.
(A–C) Neonatal or adult mice were infected with either 5×10⁴ PFU or 106 PFU MCMV-3D, respectively. Cell suspensions were generated from organs and time-points indicated and analyzed for the frequency of M45 tetramer-binding CD8+ T cell fraction. (A) Representative FACS plots and (B+C) quantification are depicted, median & IQR. (D) Experimental setup for E+F: neonatal mice were infected with 5×10⁴ PFU MCMV-3D, treated with anti-CD8b antibody or PBS and analyzed at the time-points indicated. (E) Luciferase activity of homogenates from organs depicted; means & SD. (F) Frozen sections of neonatal lung were analyzed with the antibodies indicated and representative images of NIFs are depicted. (G) Experimental setup for H+I: neonatal mice were infected with either 5×10⁴ PFU MCMV-3D or MCMV-3DΔvRAP; 2 days after infection none, 3×10³ or 3×10⁶ naïve OTIxGFP T cells were adoptively i.p. transferred and animals were analyzed 6 days after transfer. (H) Luciferase activity of homogenates from depicted organs, means & SD. (I) Frozen sections of neonatal lung were analyzed with antibodies indicated; representative images of NIFs or NIF residues. (A–C) Data from n = 3–5 animals per time-point from 2 independent experiments, (H+I) data from n = 5–8 animals from 5 independent experiments. (C) Scale bars, 50 µm.
Figure 6
Figure 6. Early activation and proliferation of naïve OTI T cells in nodular inflammatory foci of the neonatal lung.
(A) Experimental setup for B–D: neonatal mice were infected with either 5×10⁴ PFU control MCMV-2D or SIINFEKL-encoding MCMV-3D, 4–5 days after infection 5×10⁶ naïve OTIxGFP T cells were adoptively i.p. transferred and lungs of animals were analyzed 1–2 days after transfer. (B) Representative 2-photon microscopy images from Movie S1 and Movie S3 of either MCMV-2D or MCMV-3D-infected animals are depicted. (C) Quantification of OTIxGFP T cells per 2-photon microscopy 10−2 mm3 view field at indicated time-points, one dot represents number of OTIxGFP per view field at first time-point of Movie. (D) Maximal nuclei diameter of GFP+ cells (DAPI stain) within nodular inflammatory foci was measured in frozen histology sections, one dot represents one nucleus. (E) Experimental setup of T cell proliferation assay: neonatal mice were infected with 5×10⁴ PFU MCMV-3D. Five days after infection 5×10⁶ naïve OTIxGFP T cells were adoptively i.p. transferred, 2 days after transfer a subcutaneous pulse of EdU was applied and animals were sacrificed within four hours. Representative image of frozen sections of neonatal lung depicts EdU incorporation of OTIxGFP T cells within nodular inflammatory foci. (B–D) Data from n = 4–5 animals per group from 4 independent experiments. (E) Representative image of n = 2 animals from 2 independent experiments. (C, D) Means & SD. Scale bars (B) 20 µm and (E) 50 µm.
Figure 7
Figure 7. APCs in NIFs prime MCMV-specific CD8+ T cells.
(A) Experimental setup for B+C: neonatal mice were infected with 5×10⁴ PFU MCMV-2D or MCMV-3D, 3 days p.i. 3×10⁶ naïve eFluor® 670 Proliferation Dye labeled CD8+ GFPxOTI T cells were adoptively i.p. transferred, some animals received daily s.c. FTY720 until analysis at day 7 p.i.. (B) Frequency of GFP+ cells in leukocytes in different compartments, mean & SD. (C) Representative proliferation profiles of GFP+ cells from organs indicated. (D) Experimental setup for (E+F): neonatal mice were infected with 5×10⁴ PFU MCMV-3D and at the same time received polyclonal CD8+ T cells from CD45.1+ mice. FTY720 was given daily subcutaneously. (E) Representative FACS plot and quantification of CD45.1+CD8+ T cells from lung stained with M45 tetramers, median & IQR. (F) Frozen sections of neonatal lungs were analyzed with antibodies indicated, representative image of a NIF. (B+C) Data from n = 4–7 animals from 2–3 independent experiments, (E–F) Data from n = 4 animals from 2 independent experiments. Scale bar: 50 µm.
Figure 8
Figure 8. Visualization of cross-presentation within nodular inflammatory foci of neonatal mice.
(A) Experimental setup: neonatal CD11c-YFP transgenic mice were infected with 5×10⁴ PFU SIINFEKL-encoding MCMV-3D, 4 days after infection 5×10⁶ naïve OTIxCFP T cells were adoptively i.p. transferred, 1 day after transfer lungs were analyzed by 2-photon microscopy. (B) Representative 2-photon microscopy image from Movie S4 of nodular inflammatory foci in surpass mode and z-axis sequential images from one time-point of framed area are depicted, lines in z4 indicate distances from OTI to APC or infected cell, arrow indicates synapse between infected cell (red) and APC (yellow), arrow head indicates synapse between OTI T cell (blue) and APC (yellow). (C) Distances from OTIxCFP T cell center to surface of either mCherry+ or APCs at first time-point of Movies are depicted. (D) Contact-duration of OTIxCFP with APCs was estimated from 12–31 min Movies. (E) Percentage of OTIxCFP T cells with APC contacts where APCs are either in or not in contact with mCherry+ signal. (F) Neonatal mice were l.p. infected with 5×10⁴ PFU MCMV-3D, 5 days p.i. 5×10⁶ naïve OTIxGFP T cells were adoptively i.p. transferred and one day later mice were sacrificed and lungs explanted, frozen sections were stained with indicated antibodies and DAPI. (C–E) Means & SD. (B–E) Data from n = 4 animals from 2 independent experiments, (F) representative from n = 4 animals from 3 independent experiments. Scale bars (B) 15 µm, (F) 10 µm.

Similar articles

Cited by

References

    1. Cannon MJ, Schmid DS, Hyde TB (2010) Review of cytomegalovirus seroprevalence and demographic characteristics associated with infection. Rev Med Virol 20: 202–213. - PubMed
    1. Weller TH (1971) The cytomegaloviruses: ubiquitous agents with protean clinical manifestations. II. N Engl J Med 285: 267–274. - PubMed
    1. Britt W (2008) Manifestations of human cytomegalovirus infection: proposed mechanisms of acute and chronic disease. Curr Top Microbiol Immunol 325: 417–470. - PubMed
    1. Kenneson A, Cannon MJ (2007) Review and meta-analysis of the epidemiology of congenital cytomegalovirus (CMV) infection. Rev Med Virol 17: 253–276. - PubMed
    1. Mocarski ES, Shenk T, Pass R (2007) Cytomegalovirus. In: Knipe DM, Howley PM, editors. Fields Virology. 5th edition: Lippincott Williams & Wilkins. pp. 2702–2772.

Publication types

MeSH terms

Grants and funding

This work was supported by Deutsche Forschungsgemeinschaft (DFG) grant SFB900-B1 to RF and MM, the Hannover Biomedical Research School (HBRS) and the Center for Infection Biology (ZIB). FRS holds a stipend from the Lichtenberg-PhD-Programm “Dynamic of host-pathogen interactions.” The funders had no role in study design, data collection and analysis, decision to publish, or preparation of the manuscript.