

Causal analysis approaches in Ingenuity Pathway Analysis
- PMID: 24336805
- PMCID: PMC3928520
- DOI: 10.1093/bioinformatics/btt703
Causal analysis approaches in Ingenuity Pathway Analysis
Abstract
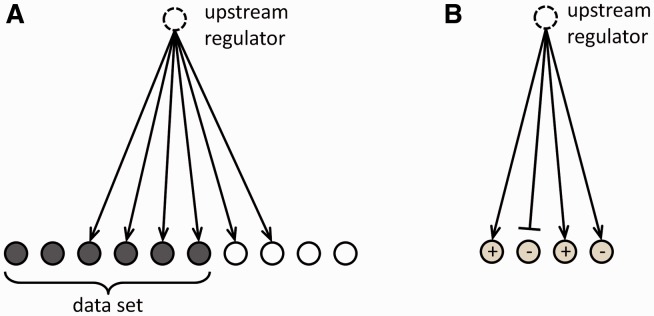
Motivation: Prior biological knowledge greatly facilitates the meaningful interpretation of gene-expression data. Causal networks constructed from individual relationships curated from the literature are particularly suited for this task, since they create mechanistic hypotheses that explain the expression changes observed in datasets.
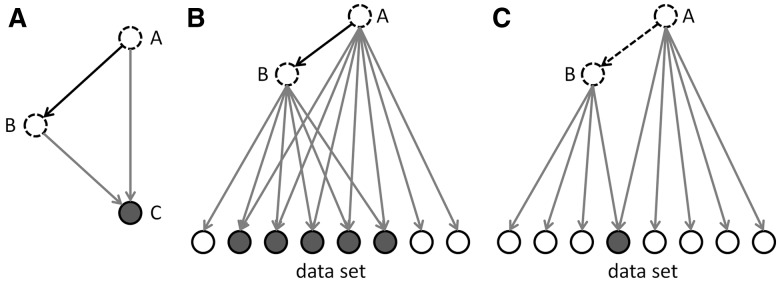
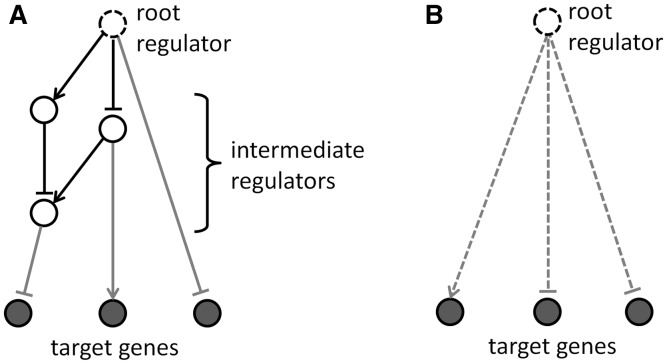
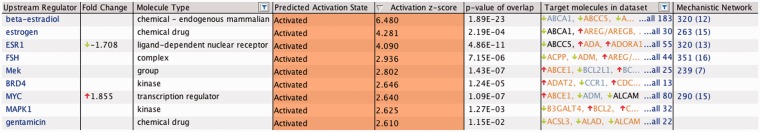
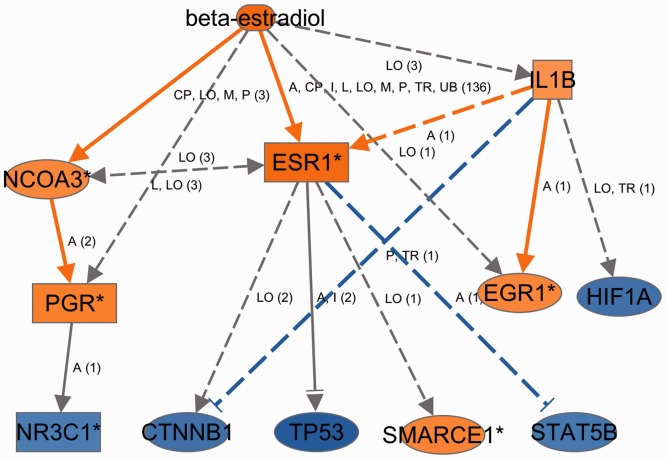
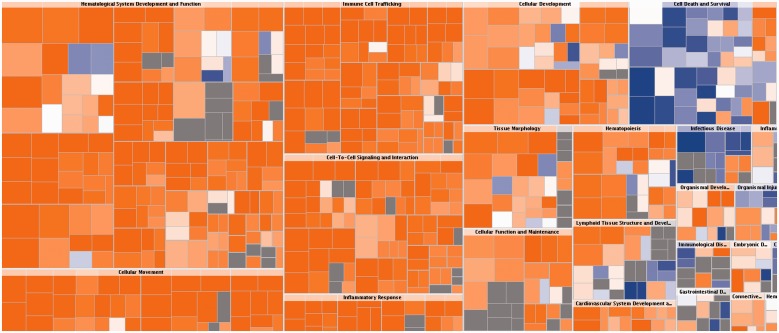
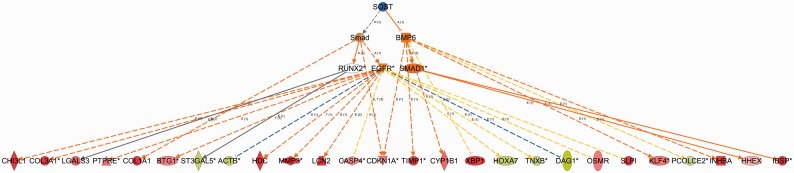
Results: We present and discuss a suite of algorithms and tools for inferring and scoring regulator networks upstream of gene-expression data based on a large-scale causal network derived from the Ingenuity Knowledge Base. We extend the method to predict downstream effects on biological functions and diseases and demonstrate the validity of our approach by applying it to example datasets.
Availability: The causal analytics tools 'Upstream Regulator Analysis', 'Mechanistic Networks', 'Causal Network Analysis' and 'Downstream Effects Analysis' are implemented and available within Ingenuity Pathway Analysis (IPA, http://www.ingenuity.com).
Supplementary information: Supplementary material is available at Bioinformatics online.
Figures
Similar articles
-
Reverse causal reasoning: applying qualitative causal knowledge to the interpretation of high-throughput data.BMC Bioinformatics. 2013 Nov 23;14:340. doi: 10.1186/1471-2105-14-340. BMC Bioinformatics. 2013. PMID: 24266983 Free PMC article.
-
Causal reasoning on biological networks: interpreting transcriptional changes.Bioinformatics. 2012 Apr 15;28(8):1114-21. doi: 10.1093/bioinformatics/bts090. Epub 2012 Feb 21. Bioinformatics. 2012. PMID: 22355083
-
Differential regulation enrichment analysis via the integration of transcriptional regulatory network and gene expression data.Bioinformatics. 2015 Feb 15;31(4):563-71. doi: 10.1093/bioinformatics/btu672. Epub 2014 Oct 15. Bioinformatics. 2015. PMID: 25322838
-
A review of causal discovery methods for molecular network analysis.Mol Genet Genomic Med. 2022 Oct;10(10):e2055. doi: 10.1002/mgg3.2055. Epub 2022 Sep 10. Mol Genet Genomic Med. 2022. PMID: 36087049 Free PMC article. Review.
-
A framework for considering prior information in network-based approaches to omics data analysis.Proteomics. 2023 Nov;23(21-22):e2200402. doi: 10.1002/pmic.202200402. Proteomics. 2023. PMID: 37986684 Review.
Cited by
-
microRNA regulation related to the protective effects of environmental enrichment against cocaine-seeking behavior.Drug Alcohol Depend. 2021 Apr 1;221:108585. doi: 10.1016/j.drugalcdep.2021.108585. Epub 2021 Feb 16. Drug Alcohol Depend. 2021. PMID: 33647589 Free PMC article.
-
Lung Microbial and Host Genomic Signatures as Predictors of Prognosis in Early-Stage Adenocarcinoma.Cancer Epidemiol Biomarkers Prev. 2024 Nov 1;33(11):1433-1444. doi: 10.1158/1055-9965.EPI-24-0661. Cancer Epidemiol Biomarkers Prev. 2024. PMID: 39225784
-
HDAC10 Regulates Cancer Stem-Like Cell Properties in KRAS-Driven Lung Adenocarcinoma.Cancer Res. 2020 Aug 15;80(16):3265-3278. doi: 10.1158/0008-5472.CAN-19-3613. Epub 2020 Jun 15. Cancer Res. 2020. PMID: 32540961 Free PMC article.
-
Targeting telomerase reverse transcriptase with the covalent inhibitor NU-1 confers immunogenic radiation sensitization.Cell Chem Biol. 2022 Oct 20;29(10):1517-1531.e7. doi: 10.1016/j.chembiol.2022.09.002. Epub 2022 Oct 6. Cell Chem Biol. 2022. PMID: 36206753 Free PMC article.
-
Identification of Key Genes and Pathways Associated with Age-Related Macular Degeneration.J Ophthalmol. 2020 Aug 21;2020:2714746. doi: 10.1155/2020/2714746. eCollection 2020. J Ophthalmol. 2020. PMID: 32904543 Free PMC article.
References
-
- Chindelevitch L, et al. Causal reasoning on biological networks: interpreting transcriptional changes. Bioinformatics. 2012a;28:1114–1121. - PubMed
-
- Felciano RM, et al. Predictive systems biology approach to broad-spectrum, host-directed drug target discovery in infectious diseases. Pac. Symp. Biocomput. 2013;2013:17–28. - PubMed
Publication types
MeSH terms
LinkOut - more resources
Full Text Sources
Other Literature Sources
