. 2013:4:2932.
doi: 10.1038/ncomms3932.

Pericyte loss influences Alzheimer-like neurodegeneration in mice

Affiliations
Free PMC article

Pericyte loss influences Alzheimer-like neurodegeneration in mice

Abhay P Sagare et al. Nat Commun. 2013.
Free PMC article

Erratum in

Retraction in

Abstract

Pericytes are cells in the blood-brain barrier that degenerate in Alzheimer's disease (AD), a neurological disorder associated with neurovascular dysfunction, abnormal elevation of amyloid β-peptide (Aβ), tau pathology and neuronal loss. Whether pericyte degeneration can influence AD-like neurodegeneration and contribute to disease pathogenesis remains, however, unknown. Here we show that in mice overexpressing Aβ-precursor protein, pericyte loss elevates brain Aβ40 and Aβ42 levels and accelerates amyloid angiopathy and cerebral β-amyloidosis by diminishing clearance of soluble Aβ40 and Aβ42 from brain interstitial fluid prior to Aβ deposition. We further show that pericyte deficiency leads to the development of tau pathology and an early neuronal loss that is normally absent in Aβ-precursor protein transgenic mice, resulting in cognitive decline. Our data suggest that pericytes control multiple steps of AD-like neurodegeneration pathogenic cascade in Aβ-precursor protein-overexpressing mice. Therefore, pericytes may represent a novel therapeutic target to modify disease progression in AD.


Figures
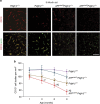
Figure 1
Figure 1. Progressive degeneration of pericytes in APPsw/0Pdgfrβ+/− mice.
(a) Confocal microscopy analysis of CD13-positive pericytes and lectin-positive capillary endothelium in the cortex of 9-month-old Pdgfrβ+/+, Pdgfrβ+/−, APPsw/0; Pdgfrβ+/+ and APPsw/0; Pdgfrβ+/− mice. Scale bar, 100 μm. (b) Quantification of CD13-positive pericytes in the cortex and hippocampus of 1-, 3-, 6- and 9-month-old Pdgfrβ+/+, Pdgfrβ+/−, APPsw/0; Pdgfrβ+/+ and APPsw/0; Pdgfrβ+/− age-matched littermates. Mean±s.e.m., n=6 mice per group. Data from the cortex and hippocampus were pooled because there were no significant differences between these two regions. *P<0.05, all other groups compared with Pdgfrβ+/+; #P<0.05, APPsw/0; Pdgfrβ+/− compared with APPsw/0; Pdgfrβ+/+; §P<0.05, APPsw/0; Pdgfrβ+/− compared with Pdgfrβ+/−. All comparisons are by analysis of variance (ANOVA) followed by Tukey’s post-hoc tests.
Figure 2
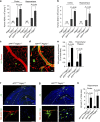
Figure 2. Pericyte deficiency accelerates Aβ pathology in APPsw/0Pdgfrβ+/− mice.
(ae) Human Aβ40 and Aβ42 levels in the cortex and hippocampus (a,b) in vivo multiphoton microscopy of cortical angiograms with Texas-Red-conjugated dextran (red) and methoxy-X04-positive amyloid (green) (c,d, scale bar, 50 μm) and quantification of cerebral amyloid angiopathy (CAA) and parenchymal methoxy-X04-positive amyloid (e) in 9-month-old APPsw/0; Pdgfrβ+/+ and APPsw/0; Pdgfrβ+/− littermates. In a,b, human Aβ40 and Aβ42 levels were determined in 9-month-old Pdgfrβ+/+ and Pdgfrβ+/− mice. (fh) Representative cortex and hippocampus sections stained with antibody against Aβ (6E10) (f,g upper panel scale bar, 400 μm; lower panel scale bar, 50 μm) and quantification of Aβ load (h) in 9-month-old APPsw/0; Pdgfrβ+/+ and APPsw/0; Pdgfrβ+/− mice. Insets in f,g: left, amyloid (green) and vascular smooth muscle cell actin (SM-actin, red) in the pial vessel on the surface of the brain; right, Aβ deposits in the hippocampus (green). In panels a,b,e,h, values are means±s.e.m., n=6 mice per group. In a,b, P<0.05 by ANOVA followed by Tukey’s post-hoc tests. NS, nonsignificant. In e,h, P<0.05 by Student’s t-test.
Figure 3
Figure 3. Pericyte deficiency leads to the accumulation of murine Aβ in APPsw/0 Pdgfrβ+/−mice.
(ad) Murine Aβ40 and Aβ42 levels in the cortex and hippocampus (a,b) and contributions of human and murine Aβ40 and Aβ42 to total Aβ levels (c,d) in 9-month-old APPsw/0; Pdgfrβ+/+ and APPsw/0; Pdgfrβ+/− littermates. In a,b, murine Aβ40 and Aβ42 levels were determined in 9-month-old Pdgfrβ+/+ and Pdgfrβ+/− mice. All values are means±s.e.m., n=6 mice per group. P<0.05 by ANOVA followed by Tukey’s post-hoc tests. Values in c,d derived from values given in Fig. 3 panels a,b and Fig. 1 panels a,b, based on n=6 mice per group. (e) Confocal microscopy analysis for the colocalization of murine endogenous Aβ (red) and human Aβ (green) in Aβ deposits in the cortex of 9-month-old APPsw/0; Pdgfrβ+/− mice. Images are representative findings from six mice per group. Scale bar, 25 μm.
Figure 4
Figure 4. ISF levels of Aβ increase in pericyte-deficient APPsw/0 Pdgfrβ+/− mice prior to Aβ deposition.
(a,b) ISF Aβ40 and Aβ42 levels monitored by in vivo hippocampal microdialysis of 3- to 4-month-old APPsw/0; Pdgfrβ+/− mice and age-matched APPsw/0; Pdgfrβ+/+ littermates. Baseline Aβ levels were monitored for 3 h. (c) The elimination half-life of ISF Aβ was determined after administration of compound E (20 mg kg−1 intraperitoneally). Values are means±s.e.m., n=6 mice per group. In (c), P<0.05 by ANOVA followed by Tukey’s post-hoc tests. (d,e) Representative cortex and hippocampus sections stained for Aβ (d) and thioflavin-S (e) in 3- to 4-month-old APPsw/0; Pdgfrβ+/+ and APPsw/0; Pdgfrβ+/− mice. Scale bar, 100 μm. (fh) APP abundance relative to β-actin (f), β-secretase activity (g) and sAPPβ levels (h) in forebrain tissue from 6-month-old APPsw/0; Pdgfrβ+/− and age-matched APPsw/0; Pdgfrβ+/+ littermates. In f, values are means±s.e.m., n=4 mice per group. Full-size blots are available in the Supplementary Fig. S5. In g,h, values are means±s.e.m., n=6 mice per group. NS, nonsignificant by Student’s t-test.
Figure 5
Figure 5. Rapid clearance of Cy3-Aβ40 by murine brain pericytes and cell death after prolonged Aβ accumulation.
(a) Colocalization of low-density LRP1 (red) and pericyte marker CD13 (Cyan) in brain microvessels in the mouse cortex tissue section (upper panels) and in freshly isolated microvessels from the mouse brain (bottom panels). *, pericyte cell bodies. Scale bar, 20 μm. (b,c) Cy3-Aβ40 uptake by cultured murine brain pericytes determined within 30 min in the presence of non-immune IgG (NI-IgG) and LRP1-specific blocking antibody (b, scale bar, 10 μm) and quantification of Cy3-Aβ40 pericyte uptake with and without NI-IgG, LRP1-, low-density LRP2-, very low-density lipoprotein receptor (VLDLR)- and low-density lipoprotein receptor (LDLR)-specific antibodies (c). Uptake in the absence of antibodies was arbitrarily taken as 100%. Mean±s.e.m., n=3 independent cultures per group. (d,e) Cy3-Aβ40 internalization and lysosomal colocalization in pericytes 48 h after siRNA silencing of Lrp1 or control siRNA (siCtrl) (d, scale bar, 10 μm) and quantification of Cy3-Aβ40 and lysotraker colocalization in pericytes after silencing of Lrp2, Vldlr, Ldlr, Apoer2 and Lrp1 and adenoviral-mediated re-expression of the LRP1 minigene (Ad.mLRP1) (e). GFP, green fluorescent protein. Mean±s.e.m., n=3 independent cultures per group. (f) Pericyte cell death after 3 and 7 days of Aβ40 accumulation. Cells were cultured with and without 5 μM Aβ40 for 3 and 7 days in the presence and absence of NI-IgG and anti-LRP1 and after siLrp1 silencing or siCtrl. Mean±s.e.m., n=3 independent cultures per group. In c,e,f, all comparisons are by ANOVA followed by Tukey’s post-hoc tests.
Figure 6
Figure 6. Accelerated Aβ pathology in APPswDI Pdgfrβ+/− mice.
(a) Representative cortex and hippocampus sections stained with antibody against Aβ (6E10; green) and nuclei (blue) in 5-month-old APPswDI; Pdgfrβ+/+ and APPswDI; Pdgfrβ+/− mouse. Scale bar, 100 μm. (b) Quantification of Aβ load in the cortex and hippocampus of 5-month-old APPswDI; Pdgfrβ+/+ and APPswDI; Pdgfrβ+/− mice. Mean+s.e.m., n=5 mice per group. P<0.05 by Student’s t-test.
Figure 7
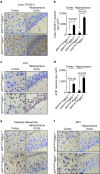
Figure 7. Tau pathology in pericyte-deficient APPsw/0 Pdgfrβ+/− mice.
(af) Representative cortex and hippocampus sections stained with antibodies against p-tau (Thr231) (a), quantification of p-tau (Thr231)-positive neurons (b), p-tau (Ser202/Thr205, AT8) (c), quantification of AT8-positive neurons (d), caspase-cleaved tau (e) and an early pathological tau marker MC1 (f) in 9-month-old APPsw/0Pdgfrβ+/− mice and age-matched APPsw/0Pdgfrβ+/+ littermates. In a,c,e,f, scale bar, 25 μm. CA1 and CA3 denote hippocampal regions. In b,d, values are means±s.e.m., n=5 mice per group. P<0.05 by ANOVA followed by Tukey’s post-hoc tests.
Figure 8
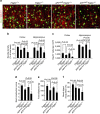
Figure 8. Neuronal degeneration in APPsw/0Pdgfrβ+/− mice.
(a,b) Representative confocal microscopy analysis of SMI311-positive neurofilaments and NeuN-positive hippocampal neurons (a) and quantification of SMI311-positive neurofilaments (b) and NeuN-positive neurons (c) in the cortex and hippocampus of 9-month-old age-matched Pdgfrβ+/+, Pdgfrβ+/−, APPsw/0; Pdgfrβ+/+ and APPsw/0; Pdgfrβ+/− littermates mice. In a, scale bar, 25 μm. In b,c, values are means±s.e.m., n=6 mice per group. P<0.05 by ANOVA followed by Tukey’s post-hoc tests. (df) Behavioural analysis of nest construction (d), burrowing (e) and novel object location (f) in 9-month-old Pdgfrβ+/+, Pdgfrβ+/−, APPsw/0; Pdgfrβ+/+ and APPsw/0; Pdgfrβ+/− age-matched littermate mice. In df, values are means±s.e.m., n=6 mice per group. P<0.05 by ANOVA followed by Tukey’s post-hoc tests.
Figure 9
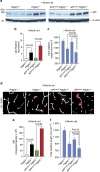
Figure 9. Accelerated blood–brain barrier breakdown and microvascular reductions in pericyte-deficient APPsw/0Pdgfrβ+/−mice.
(a,b) Western blot analysis of serum IgG in capillary-depleted cortical homogenates relative to β-actin (a) and quantification of IgG extravascular levels (b) in 1-month-old Pdgfrβ+/+, Pdgfrβ+/−, APPsw/0; Pdgfrβ+/+ and APPsw/0; Pdgfrβ+/− mice. Full-size blots can be found in Supplementary Fig. S5. (c) Total length of lectin-positive capillary profiles in 1-month-old Pdgfrβ+/+, Pdgfrβ+/−, APPsw/0; Pdgfrβ+/+ and APPsw/0; Pdgfrβ+/− mice. In b, values are means±s.e.m., n=4 mice per group. In c, values are means±s.e.m., n=6 mice per group. P<0.05 by ANOVA followed by Tukey’s post-hoc tests. (d,e) IgG extravascular leakage (d, scale bar, 100 μm) and quantification of IgG extravascular deposits (e) in 9-month-old Pdgfrβ+/+, Pdgfrβ+/−, APPsw/0; Pdgfrβ+/+ and APPsw/0; Pdgfrβ+/− mice.(f) Total length of lectin-positive capillary profiles in 9-month-old Pdgfrβ+/+, Pdgfrβ+/−, APPsw/0; Pdgfrβ+/+ and APPsw/0; Pdgfrβ+/− mice. In e,f, values are means±s.e.m., n=6 mice per group. P<0.05 by ANOVA followed by Tukey’s post-hoc tests.
Figure 10
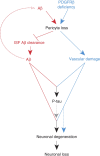
Figure 10. Pericyte loss influences multiple steps of Alzheimer’s-like pathogenic cascade in APPsw/0 mice.
Within the Aβ pathway (red), pericyte loss in APPsw/0 mice because of PDGFRβ deficiency and/or excessive accumulation of Aβ in pericytes diminishes early in the disease process clearance of soluble Aβ from brain ISF causing an early Aβ accumulation and deposition in the brain, which in turn amplifies the loss of pericytes. Within the vasculature, an Aβ-independent pathway driven by aberrant PDGFRβ signalling in pericytes (blue) leads to accelerated pericyte loss that amplifies blood–brain barrier disruption and microvascular reductions in APPsw/0 mice and the degree of vascular damage. Both pathways acting in parallel lead to an early development of a full spectrum of AD-like pathology in mice including significant Aβ pathology, tau pathology, neuronal degeneration and neuronal loss that are not observed either within the Aβ pathway alone or the vascular Aβ-independent pathway alone.

Similar articles

Cited by

References

    1. Armulik A., Genove G. & Betsholtz C. Pericytes: developmental, physiological, and pathological perspectives, problems, and promises. Dev. Cell 21, 193–215 (2011). - PubMed
    1. Zlokovic B. V. The blood-brain barrier in health and chronic neurodegenerative disorders. Neuron 57, 178–201 (2008). - PubMed
    1. Armulik A. et al.. Pericytes regulate the blood-brain barrier. Nature 468, 557–561 (2010). - PubMed
    1. Daneman R., Zhou L., Kebede A. A. & Barres B. A. Pericytes are required for blood-brain barrier integrity during embryogenesis. Nature 468, 562–566 (2010). - PMC - PubMed
    1. Bell R. D. et al.. Pericytes control key neurovascular functions and neuronal phenotype in the adult brain and during brain aging. Neuron 68, 409–427 (2010). - PMC - PubMed

Publication types