. 2014 Jan;46(1):24-32.
doi: 10.1038/ng.2847. Epub 2013 Dec 8.

Transposon mutagenesis identifies genes driving hepatocellular carcinoma in a chronic hepatitis B mouse model

Affiliations

Transposon mutagenesis identifies genes driving hepatocellular carcinoma in a chronic hepatitis B mouse model

Emilie A Bard-Chapeau et al. Nat Genet. 2014 Jan.

Abstract

The most common risk factor for developing hepatocellular carcinoma (HCC) is chronic infection with hepatitis B virus (HBV). To better understand the evolutionary forces driving HCC, we performed a near-saturating transposon mutagenesis screen in a mouse HBV model of HCC. This screen identified 21 candidate early stage drivers and a very large number (2,860) of candidate later stage drivers that were enriched for genes that are mutated, deregulated or functioning in signaling pathways important for human HCC, with a striking 1,199 genes being linked to cellular metabolic processes. Our study provides a comprehensive overview of the genetic landscape of HCC.


Figures

Figure 1
Figure 1. HBsAg/Liver-SB mice have chronic liver inflammation and accelerated formation of HCC
a, Preneoplastic hepatocellular focus (large arrow) of hyperplastic hepatocytes, with inflammatory cells (small arrows) in a 22.8 week-old Liver-SB/HBsAg male mouse. b, Hepatocytes with endoplasmic reticulum inclusions, so called ground glass hepatocytes, as seen in human HBV-induced hepatitis. Sample from a 20.4 week-old Liver-SB/HBsAg male mouse. c, Kaplan-Meier survival curves for male and female mice of all four combinations of genotypes. Liver-SB/HBsAg (SB/HBV), Liver-SB (SB), HBsAg transgene (HBV) and littermate control mice carrying an inactive transposon (no transposase) and no HBsAg transgene (control). Female median survival was 79.1 weeks for Liver-SB/HBsAg and 103.7 weeks for Liver-SB (Logrank test p<10−4). Male median survival was 70.4 weeks for Liver-SB/HBsAg, 94.9 weeks for Liver-SB, and 88.4 for HBsAg mice (Logrank test p<10−4). d, Summary of histopathology performed on livers of moribund male mice of various phenotypes. We observe more of “HCC and HCA” in class “Liver-SB/HBsAg”, than in classes “Liver-SB” and “HBsAg” combined. Although a trend is visible, it was not significant (p=0.086, one–sided Fisher’s exact test on a contingency table). The overall penetrance for hepatic tumorigenesis in Liver-SB/HBV was 77%. HCC : hepatocellular carcinoma, HCA: hepatocellular adenoma.
Figure 2
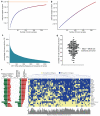
Figure 2. Identification of driver genes for HCC in the Liver-SB/HBV screen
a,b, CISs were called using the Gaussian Kernel Convolution (GKC) method from the indicated numbers of randomly chosen Liver-SB/HBV tumors. The resulting CIS genomic loci were overlapped with the CIS loci from the 228 tumors. The numbers of tumor samples used were plotted against the genomic bases covered. For each combination of tumors the median values and 25th and 75th percentiles were plotted. a, Near saturation of the screen is seen with a theoretical asymptote ( in orange) at 248,023,943 bases with an increasing number of samples. The percentage saturation obtained with 100 samples is 75.4%. b, This plot shows the data generated from randomized samples; the straightness of the line indicates no saturation. c, Distribution of all 2871 CISs according to the percent of time they are mutated in tumors. When a CIS gene was identified using both gCIS and GKC, the average percent was used. Only 79 CISs were mutated in more than 50% of the tumors, while 638 CISs were mutated in more than 25% of the tumors. d, Number of transposon insertions found in CIS loci in each tumor (represented as dots). The mean is 387 ± 118 CISs targeted per tumor. e, Clustering in all 228 tumors of the 21 HCC driver genes with highest sequencing read counts and frequency of occurrence in tumors. No statistically significant genetic correlations were found among the 21 driver genes.
Figure 3
Figure 3. Many Liver-SB/HBV CIS genes are deregulated or mutated in human cancer
Repartition of the 42.5% Liver-SB/HBV CIS genes found to be either mutated or misexpressed in human HCC. A total of 1224 CISs from the Liver-SB/HBV screen were associated with a gene mutated or misexpressed in human HCC.
Figure 4
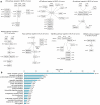
Figure 4. Liver-SB/HBV CIS genes drive tumorigenesis through conserved cancer signaling pathways
a, HCC CIS genes are enriched for genes in major oncogenic canonical signalling pathways. The percentages represent the fraction of tumors with a transposon insertion at the gene locus. Most tumors displayed insertions in genes in these canonical pathways. b, Gene ontology analysis performed with DAVID bioinformatics, biological processes. P values for enrichment are represented on a –log scale. The percentages indicate the proportion of HCC CIS genes found associated with a specific biological process.
Figure 5
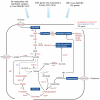
Figure 5. Mapping of genomic and metabonomic data to metabolic pathways disrupted in HCC
To understand the metabolic pathways disrupted in HCC at the genetic, mRNA, and metabolite levels, we used data from the Liver-SB/HBV screen (Supplementary Table 1c), human expression data, and metabolomic results (Supplementary Table 7). Metabolites are written with larger font size, and genes with smaller font size. Red or green fonts mean the gene expression or metabolite amount is increased or decreased, respectively, in HCC tissue versus adjacent non-tumor tissue. CIS genes listed in Supplementary Table 1c are labeled with *. This map focuses on glycolysis, TCA cycle, glutaminolysis, and the pentose phosphate (PP) pathway. Despite the increased glucose uptake (Glut1/2) and consumption, the tumor cells predominantly expressed the pyruvate kinase M2 isoform (Pkm2), which converts phosphoenolpyruvate (PEP) to pyruvate less efficiently than Pkm1 . This promotes the accumulation and shuttling of glycolytic intermediates such as glucose-6-phosphate (G6P), fructose-6-phosphate (F6P), and fructose-1,6-biphosphate 2 (FBP) to the pentose phosphate (PP) pathway and macromolecular synthesis. Thus, this termination of the glycolysis metabolic pathway together with dysregulation of Pcx and Pdk1/2, would prevent pyruvate from entering the TCA cycle. This would also lead to a truncated TCA cycle and insufficient glucose-dependent citrate production. However, most of the TCA cycle genes (Idh1/2, Sdha, Fh, Odgh) and corresponding intermediates are up-regulated in tumor cells, except for the down-regulation of the aconitase gene family (Aco1/2), suggesting the TCA cycle is at least partially activated. Our results imply an activation of glutaminolysis (Cat2, Gls, Glud1/2) converting glutamine to α-ketoglutarate to replenish TCA cycle intermediates. Effective maintenance of citrate synthesis is possible through reductive carboxylation of glutamine-derived α-ketoglutarate by Idh1/2. These adaptations around glycolysis and the TCA cycle could allow rapid generation of both ATP for bioenergetics and important metabolites for biosynthesis. In addition, the breakdown of citrate by Acly could constitute a primary source of acetyl-CoA for fatty acid and lipid synthesis. Moreover, up-regulation of Ldha, could convert glutamine-derived pyruvate to lactate that is excreted by Mct4 transporter outside the cells.
Figure 6
Figure 6. Quantitative changes in pyruvate metabolism can be detected by hyperpolarized carbon-13 magnetic resonance spectroscopy
in vivo. a, T2-weighted MRI illustrates the development of HCC at different stages in Liver-SB/HBsAg animals. The anatomy appears normal in the pre-tumor stage (NT), at 2-5 months of age. However, at approximately 8 months of age, tumors (white arrows) began to appear within the normal liver (white arrow head). This is referred to as the developing tumor (DT) stage. Massive tumors (MT) were detected by MRI approximately two months later (black arrows). b, Live in vivo imaging provided the mapping of lactate and alanine production in HCC after hyperpolarized pyruvate injection (blue -> green -> yellow -> red represent amounts of molecules lowest to largest). c, Representation of the in vivo measured hyperpolarized carbon-13 spectra in the liver. Metabolites that were detected include [1-13C]lactate (183.0 ppm), [1-13C]malate (181.5 ppm), [1-13C]pyruvate hydrate (179.1 ppm), [4-13C]aspartate (177.8 ppm), [1-13C]alanine (176.4 ppm), [4-13C]oxaloacetate (175.6 ppm), [1-13C]aspartate (175.0 ppm), [1-13C]pyruvate (170.8 ppm) and [1-13C]bicarbonate (160.8 ppm). The pyruvate peak was truncated to better illustrate the downstream metabolite peaks. d, Representative time course depicting the simultaneous production of downstream metabolites upon infusion of hyperpolarized [1-13C]pyruvate in a mouse bearing a large liver tumor. e, Quantitative changes in pyruvate metabolism can be detected by hyperpolarized carbon-13 magnetic resonance spectroscopy in live mice in vivo. Rate of exchange of 13C label from [1-13C]pyruvate (pyr) to [[1-13C]lactate (lac), [1-13C]malate (mal), [1-13C]alanine (ala), [1-13C]aspartate (asp), and [1-13C]bicarbonate (bic) after [1-13C]pyruvate infusion into mice at different tumor development stages. ANOVA tests were performed for each metabolic flux result. At the FDR-corrected significance level of 0.05, no differences between group means were found. However, explicitly testing for a trend by computing Spearman correlation showed that the metabolic flux pyr->ala significantly increased with tumor size (rho = 0.51; FDR-corrected p=0.022). Although a strong trend was also observed for the metabolic flux pyr->lac, this did not reach statistical significance (rho = 0.43; FDR-corrected p = 0.052). The number of animals in groups is indicated above each bar. Error bars represent the standard error of the mean (SEM).

Similar articles

Cited by

References

    1. Chen X, et al. Gene expression patterns in human liver cancers. Mol Biol Cell. 2002;13:1929–1939. - PMC - PubMed
    1. Imbeaud S, Ladeiro Y, Zucman-Rossi J. Identification of novel oncogenes and tumor suppressors in hepatocellular carcinoma. Semin Liver Dis. 2010;30:75–86. - PubMed
    1. Mas VR, et al. Genes involved in viral carcinogenesis and tumor initiation in hepatitis C virus-induced hepatocellular carcinoma. Mol Med. 2009;15:85–94. - PMC - PubMed
    1. Roessler S, et al. A unique metastasis gene signature enables prediction of tumor relapse in early-stage hepatocellular carcinoma patients. Cancer Res. 2010;70:10202–10212. - PMC - PubMed
    1. Wurmbach E, et al. Genome-wide molecular profiles of HCV-induced dysplasia and hepatocellular carcinoma. Hepatology. 2007;45:938–947. - PubMed

Publication types

MeSH terms