. 2014 Jan;17(1):131-43.
doi: 10.1038/nn.3599. Epub 2013 Dec 8.

Identification of a unique TGF-β-dependent molecular and functional signature in microglia

Affiliations

Identification of a unique TGF-β-dependent molecular and functional signature in microglia

Oleg Butovsky et al. Nat Neurosci. 2014 Jan.

Erratum in

  • Nat Neurosci. 2014 Sep;17(9):1286

Abstract

Microglia are myeloid cells of the CNS that participate both in normal CNS function and in disease. We investigated the molecular signature of microglia and identified 239 genes and 8 microRNAs that were uniquely or highly expressed in microglia versus myeloid and other immune cells. Of the 239 genes, 106 were enriched in microglia as compared with astrocytes, oligodendrocytes and neurons. This microglia signature was not observed in microglial lines or in monocytes recruited to the CNS, and was also observed in human microglia. We found that TGF-β was required for the in vitro development of microglia that express the microglial molecular signature characteristic of adult microglia and that microglia were absent in the CNS of TGF-β1-deficient mice. Our results identify a unique microglial signature that is dependent on TGF-β signaling and provide insights into microglial biology and the possibility of targeting microglia for the treatment of CNS disease.


Conflict of interest statement

Competing financial interests

The authors declare no competing financial interests.

Figures
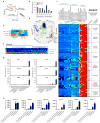
Figure 1
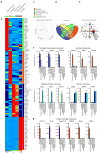
Figure 1. Identification of a microglia signature by gene expression and quantitative mass spectrometry
(a) AffyExon1 genearray expression profile of adult mouse microglia and splenic Ly6C monocytes (biological triplicates) identified 399 genes in microglia vs. 611 genes in monocytes (>5 fold, P<0.001, Student’s t test, 2-tailed) (see Source data – Figure 1). (b) Gene expression of microglial molecules. Bars show mean normalized intensity ± s.e.m. (n = 3). (c) Heatmap of 1,381 mass spectrometry identified proteins differentially expressed between microglia and Ly6C subsets (ANOVA, P<0.05) (biological duplicates) (see Source data – Figure 1). 455 of these proteins were enriched in microglia and 926 proteins in Ly6C monocytes (see Source data – Figure 1). (d) 3D-scatter plot based on the 1,381 differentially expressed proteins in microglia and monocytes. (e) Heatmap of microglia vs. F4/80+CD11b+ macrophages and immune cells using the MG400 chip. MG, microglia; MΦ, macrophages (see Source data – Figure 1). (f) Heatmap and hierarchical clustering of microglia, macrophages and immune cells analyzed with the MG400 chip (see Source data – Figure 1). Results were log-transformed, normalized and centered, and populations and genes were clustered by Pearson correlation. Data are representative of three different experiments with microglia pooled from 15 mice, macrophages from 10 mice and immune cells pooled from 5 mice. (g) qPCR analysis of identified microglial genes in different cells. Expression levels were normalized to Gapdh (n = 2). Bars show mean ±s.e.m. Shown is one representative of three individual experiments. (h) qPCR validation of the selected 6 microglial genes in both fetal and adult human microglia and human blood-derived monocytes. Expression levels were normalized to Gapdh (n = 2). Bars show mean ± s.e.m.
Figure 2
Figure 2. MG400 profile in microglia vs. astrocytes, oligodendrocytes and neurons
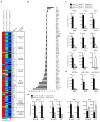
(a) Dendogram of unsupervised hierarchical clustering (Pearson correlation; average linkage) of biological duplicates for FCRLS+ adult microglia (n = 5 mice), Glt-EGFP+ adult astrocytes (n = 9 mice), adult oligodendrocytes (n = 5 mice) and primary postnatal hippocampal and cortical neurons (see Source data – Figure 2). Individual cell types are identified as follows: green, oligodendrocytes; orange, astrocytes; cyan, cortical neurons; dark-blue, hippocampal neurons and red, microglia. (b) Heatmap of top 25 enriched genes in each cell type based on hierarchical clustering. Each lane represents the average expression value of two biological duplicates per cell type. (c) Principle component analysis based on MG400 expression for CNS cells. (d) MG400 profile of detected genes (>100 mRNA transcripts) in microglia, astrocytes, oligodendrocytes and neurons. Venn diagram displays unique and intersecting genes among cell types. (e) Correspondence analysis of samples (large spheres) and genes (small spheres). (f) qPCR analysis of CNS cell type specific genes for each population. (g) qPCR analysis of microglial unique genes (P2ry12, Fcrls, Tmem119, Olfml3, Hexb and Tgfbr1) as compared to spleen red pulp macrophages and CNS cell types. Expression levels were normalized to Gapdh (n = 3). Bars show mean ± s.e.m. Shown is one of two individual experiments.
Figure 3
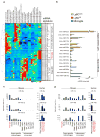
Figure 3. Identification of a miRNA microglia signature
(a) Heatmap and hierarchical clustering of differentially expressed miRNAs in microglia, organ specific macrophages and immune cell populations based on 600 miRNA nCounter chip (see Source data – Figure 3). (b) miRNA transcript copies of highly expressed microRNAs in microglia and Ly6C monocyte subsets. Bars show mean normalized intensity ± s.e.m. of miRNA transcripts per 100 ng of total RNA (n = 2). (c) qPCR validation of microglial miRNAs (miR-99a, miR-342-3p miR-125b-5p) and (d) inflammatory Ly6C+ miRNAs (miR-15b, miR-148a, miR-223) in Ly6C monocytes, organ-specific macrophages and human fetal and adult microglia. Bars show mean normalized intensity ± s.e.m. (n = 3). miRNA expression level was normalized against U6 miRNA using ΔCt. One representative of two individual experiments is shown.
Figure 4
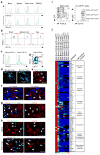
Figure 4. Surface expression of microglial molecules and molecular signature of recruited monocytes during EAE
(a) FACS analysis of CD11b-gated cells stained with FCRLS and P2ry12 Abs. Black line represents isotype control. Data are representative of three or more replicates. (b) Surface expression of FCRLS in murine brain (n = 6), spinal cord (n = 5) and eye (n = 4) CD11b-gated cells. (c) FACS analysis of P2ry12 expression in human peripheral blood and brain isolated mononuclear cells (n = 3). (d) Immunohistochemistry of cells with microglial morphology stained with anti-P2ry12 Ab in murine (n = 6) and human brain (n = 2). (e) GFP+ microglia in CX3CR1GFP transgenic mouse co-stained with anti-P2ry12 Ab (arrows). (f) Left panel shows staining with P2ry12 and GFAP (astrocyte marker); right panel shows staining with P2ry12 and NeuN (neuronal marker). Yellow arrows point to P2ry12+ microglia. (g) Rat anti-P2ry12 antibody stained Iba-1+GFP microglia in naïve CX3CR1GFP/+ chimeric mouse but not recruited Iba-1+GFP+ monocytes (arrows). (h) Confocal images of spinal cord from naïve and EAE onset. Resident GFP microglia are P2ry12 positive. Recruited GFP+ monocytes are P2ry12 negative. Scale bar, 50 μm. (i) FACS sorting of FCRLS+ microglia from EAE chimeric mice at disease onset. Ly6C is expressed by FCRLSGFP+CD11b+ recruited monocytes (G1). Ly6C is not expressed by FCRLS+GFPCD11b+ microglia (G2). FACS histogram represents a pool of 5 mice. (j) Heatmap of top microglial genes in sorted microglia, recruited monocytes from brain (n = 6) and splenic monocyte (n = 6) subsets from EAE chimeric mice at disease onset as analyzed by MG400 chip (see Source data – Figure 4). Data represent two independent experiments.
Figure 5
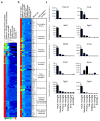
Figure 5. Microglia signature is not present in microglial cell lines
(a) MG400 expression profile of adult microglia (n = 10), newborn microglia (P1) (n = 30), primary cultured newborn microglia (P1-P2), microglial cell lines (N9, BV2), embryonic stem cell microglia (ESdMs) and RAW264.7 macrophages (see Source data – Figure 5). Data are representative of two different experiments. (b) Heatmap of top microglial genes. One representative of two individual experiments is shown. (c) qPCR analysis of 10 selected microglia genes. Gene expression level was normalized against Gapdh using ΔCt (n = 2). Bars show mean ± s.e.m. Shown is one representative of three individual experiments.
Figure 6
Figure 6. Role of TGF-β in the development of microglia in vitro.
(a and b) MG400 analysis of (a) upregulated microglial genes and (b) downregulated microglial genes in cultured adult microglia in the presence of MCSF and TGF-β1 in comparison to adult microglia cultured in the presence of GM-CSF or MCSF alone (see Source data – Figure 6). One representative of three individual experiments is shown. (c) qPCR analysis of 6 selected microglial genes in cultured adult microglia in the presence of MCSF and TGF-β1. Gene expression level was normalized against Gapdh using ΔCt (n = 6, each biological triplicate consisted of two wells per treatment). Bars show mean normalized intensity ± s.e.m. *P<0.05, **P<0.01, ***P<0.001, F2,15=5.829; 1-Way ANOVA followed by Dunnett’s multiple-comparison post-hoc test. (d) Principal component analysis (PCA) of different cell populations based on MG400 expression profile. (e and f) qPCR analysis of Fcrls, Sall1 and Gpr-34 gene expression (e) and miR-99a, miR-125b-5p and miR-342-3p expression (f) in RAW264.7 macrophages, N9 microglia cell line and adult microglia cultures. Cells were untreated or cultured in the presence of MCSF, GM-CSF, or polarized for 48h to M0 (MCSF+TGF-β1), M1 (GM-CSF+IFNγ+LPS) or M2 (MCSF+IL4) phenotypes. RAW264.7 macrophages and N9 cells survive without MCSF or GM-CFS, whereas adult microglia require either MCSF or GM-CSF. Gene expression level was normalized against Gapdh using ΔCt (n = 3). miRNA expression level was normalized against U6 miRNA using ΔCt (n = 3). Bars show mean ± s.e.m. Shown is one of two individual experiments.
Figure 7
Figure 7. Loss of microglia in CNS-TGF-β1−/− mice
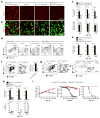
(a and b) Immunohistochemistry of brain stained with (a) anti-P2ry12 (microglia) and (b) anti-Iba-1 (myeloid cells) and anti-NeuN (neurons) at 20 and 90 days of age (IL2TGF-β1-Tg-TGF-β1+/− and IL2TGF-β1-Tg-TGF-β1−/−) (n = 6) and 20d (TGF-β1−/−) (n = 5) mice. Scale bar, 50 μm. (c) Quantification of Iba-1+ and NeuN+ cells. Data represent mean ± s.e.m. at 20 days **P<0.01, t=13.51; 90 days **P<0.01, t=4.41; and 160 days ***P<0.001, t=11.29. Student’s t test, 2-tailed. (d) Representative FACS analysis of brain-derived mononuclear cells stained for CD11b and FCRLS among CD45+ cells at 20 (n = 5) and 90 (n = 6) days. (e) Quantification of FCRLS+CD11b+ cells at 20 (n = 6), 90 (n = 5) and 160 (n = 5) days. Data represent mean ± s.e.m. (f and g) FACS plots show the percentage and total cell number ± s.e.m. of (f) F4/80+CD11b+ cells (***P<0.001, t=15.60 Student’s t test, 2-tailed) and (g) the percentage of CD39+CD11b+ cells among CD45+ cells at 90 days of age in IL2TGF-β1-Tg-TGF-β1+/− (n = 5) and IL2TGF-β1-Tg-TGF-β1−/− (n = 6) mice. (h) Quantification of CD39+CD11b+ cells among CD45+ cells and Ly6C+ cells as percentage of CD11b+ cells at 20 (n = 6), 90 (n = 5) and 160 (n = 5) days. Data represent mean ± s.e.m. For CD39+CD11b+ cells ***P<0.001, F2,13=12.34; 1-Way ANOVA followed by Dunnett’s multiple-comparison post-hoc test for comparison at 20d and ***P<0.001, t= 20.20 and ***P<0.001, t=26.36 Student’s t test, 2-tailed for comparison at 90d and 160d, respectively. (i) Body mass, rotorod performance and survival in IL2TGF-β1-Tg-TGF-β1+/− and IL2TGF-β1-Tg-TGF-β1−/− mice (n = 10/group).
Figure 8
Figure 8. Molecular microglial signature in CNS-TGF-β1 deficient mice
(a) MG400 profile of brain CD39+CD11b+ cells in IL2TGF-β1-Tg-TGF-β1+/− (n = 3) and IL2TGF-β1-Tg-TGF-β1−/− mice at 60d of age (n = 3) (see Source data – Figure 8). Heatmap of top microglial genes is shown. Results were log-transformed, normalized (to the mean expression of zero across samples) and centered. (b) Affected microglial genes in CD39+CD11b+ cells from and IL2TGF-β1-Tg-TGF-β1−/− mice as compared to IL2TGF-β1-Tg-TGF-β1+/− mice showing at least >5-fold difference. (c and d) qPCR validation of (c) 9 selected microglial genes and (d) 3 miRNAs at 60 days of age. Expression levels were normalized to Gapdh. Data represent mean ± s.e.m. (n = 3 mice per group) for P2ry12, ****P<0.0001, F2,9=335.5; Fcrls, ****P<0.0001, F2,9=221.5; Sall1, ****P<0.0001, F2,9=69.4; Itgb5, ****P<0.0001, F2,9=102.0; Mertk, ****P<0.0001, F2,9=234.8; Gpr34, ****P<0.0001, F2,9=71.5; Pros1, ***P=0.002, F2,9=24.2; C1qa, ****P<0.0001, F2,9=93.4; Apoe, ****P<0.0001, F2,9=110.8; 1-Way ANOVA followed by Dunnett’s multiple-comparison post-hoc test. (e) qPCR validation of 4 selected microglial genes at E14.5 (n = 4) and P1 (n = 5) mice. Data represent mean ± s.e.m. For P2ry12 at E14.5 ****P<0.0001, t=11.91; at P1 ****P<0.0001, t=18.48; For Fcrls at E14.5 *P=0.035, t=3.66; at P1 **P<0.006, t=5.26; For Sall1 at E14.5 ****P<0.0001, t=18.38; at P1 **P=0.0034, t=6.24; For Apoe at E14.5 *P=0.0221, t=2.97; at P1 **P=0.0088, t=3.62; (Student’s t test, unpaired).

Similar articles

Cited by

References

    1. Prinz M, Priller J, Sisodia SS, Ransohoff RM. Heterogeneity of CNS myeloid cells and their roles in neurodegeneration. Nat Neurosci. 2011;14:1227–1235. doi: 10.1038/nn.2923. - DOI - PubMed
    1. Ransohoff RM, Cardona AE. The myeloid cells of the central nervous system parenchyma. Nature. 2010;468:253–262. doi: 10.1038/nature09615. - DOI - PubMed
    1. Saijo K, Glass CK. Microglial cell origin and phenotypes in health and disease. Nat Rev Immunol. 2011;11:775–787. doi: 10.1038/nri3086. - DOI - PubMed
    1. Ginhoux F, et al. Fate mapping analysis reveals that adult microglia derive from primitive macrophages. Science. 2010;330:841–845. doi: 10.1126/science.1194637. - DOI - PMC - PubMed
    1. Schulz C, et al. A lineage of myeloid cells independent of Myb and hematopoietic stem cells. Science. 2012;336:86–90. doi: 10.1126/science.1219179. - DOI - PubMed

Publication types

MeSH terms

Associated data