. 2014 Feb 7;289(6):3571-90.
doi: 10.1074/jbc.M113.513366. Epub 2013 Dec 5.

Asymmetrical Fc engineering greatly enhances antibody-dependent cellular cytotoxicity (ADCC) effector function and stability of the modified antibodies

Affiliations

Asymmetrical Fc engineering greatly enhances antibody-dependent cellular cytotoxicity (ADCC) effector function and stability of the modified antibodies

Zhi Liu et al. J Biol Chem. .

Abstract

Antibody-dependent cellular cytotoxicity (ADCC) is mediated through the engagement of the Fc segment of antibodies with Fcγ receptors (FcγRs) on immune cells upon binding of tumor or viral antigen. The co-crystal structure of FcγRIII in complex with Fc revealed that Fc binds to FcγRIII asymmetrically with two Fc chains contacting separate regions of the FcγRIII by utilizing different residues. To fully explore this asymmetrical nature of the Fc-FcγR interaction, we screened more than 9,000 individual clones in Fc heterodimer format in which different mutations were introduced at the same position of two Fc chains using a high throughput competition AlphaLISA® assay. To this end, we have identified a panel of novel Fc variants with significant binding improvement to FcγRIIIA (both Phe-158 and Val-158 allotypes), increased ADCC activity in vitro, and strong tumor growth inhibition in mice xenograft human tumor models. Compared with previously identified Fc variants in conventional IgG format, Fc heterodimers with asymmetrical mutations can achieve similar or superior potency in ADCC-mediated tumor cell killing and demonstrate improved stability in the CH2 domain. Fc heterodimers also allow more selectivity toward activating FcγRIIA than inhibitory FcγRIIB. Afucosylation of Fc variants further increases the affinity of Fc to FcγRIIIA, leading to much higher ADCC activity. The discovery of these Fc variants will potentially open up new opportunities of building the next generation of therapeutic antibodies with enhanced ADCC effector function for the treatment of cancers and infectious diseases.

Keywords: Antibody Engineering; Cancer Therapy; Cell Death; FCγ Receptors; NK Cells.


Figures
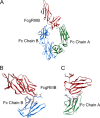
FIGURE 1.
FIGURE 1.
Fc of human IgG1 interacts asymmetrically with FcγRIII. A, representation of the x-ray co-crystal structure of the Fc-FcγRIIIB (Protein Data Bank code 1T83) complex. The FcγRIIIB structure is shown in red; the Fc chain B is shown in blue, and the Fc chain A is shown in green. B, zoomed-in interface between the FcγRIII and left Fc chain B. Contacting residues Leu-235, Ser-239, Asp-265, Leu-328, Pro-329, Ala-330, and Ile-332 are in proximity to the FcγRIII. C, zoomed-in interface between the FcγRIII and right Fc chain A. Contacting residues Leu-235, Gly-236, Pro-238, Ser-239, Asp-265, Ser-267, Asp-270, Tyr-296, Asn-297, Ser-298, Thr-299, and Ala-327 are in proximity to the FcγRIII.
FIGURE 2.
FIGURE 2.
Asymmetrically engineered Fc variants in the context of anti-TuAg (clone H158) IgG1 antibodies have enhanced ADCC effector function. A, interface between the Fc chains (left chain (B) and right chain (A)) and FcγRIII based on x-ray crystal structure of the Fc-FcγRIIIB complex (Protein Data Bank code 1T83). On chain B, Ala-330 is within 4 Å of receptor residue Ile-88 of FcγRIII; Ile-332 is close to Lys-161 of FcγRIII, and Ser-239 and Ser-298 are not engaged. On chain A, Ser-239 interacts with Lys-120 of FcγRIII; Ser-298 is in proximity to residue Tyr-132 of FcγRIII; Ala-330 and Ile-332 is far away from any residues of FcγRIII. B, DSC analysis to measure the domain melting temperature of anti-TuAg (clone H158) IgG1 antibodies in heterodimer format. The sequence alternations in each antibody variant are indicated in Table 1. C, ADCC activity of anti-TuAg (clone H158) IgG1 antibody variants with OVCAR-8 cells in the presence of purified human NK cells (FcγRIIIA F/F genotype). D, ADCC activity of anti-TuAg (clone H158) IgG1 antibody variants with CAPAN-2 cells in the presence of purified human NK cells (FcγRIIIA F/F genotype). Irrelevant human IgG1 was used as isotype control, and anti-TuAg (clone H158) WT IgG1 was used as a base line. Effects of concentrations at 50% of maximal killing (EC50, pm) are shown beside the designated Fc variants. Ab, antibody.
FIGURE 3.
FIGURE 3.
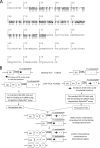
Targeted residues in Fc region and screening process of Fc libraries. A, amino acid sequence of a human IgG1 Fc polypeptide to be targeted for the construction of Fc libraries. The amino acid sequence of a human IgG1 Fc region, starting from the hinge region and ending with the carboxyl terminus of the CH3 domain, is shown in single letter notation and is numbered according to the EU system of Edelman et al. (35). The amino acids underlined and in boldface type were randomized in constructing the libraries as described under “Experimental Procedures.” Below each of these amino acids is a 1, a 2, or a 3, which indicates that DNAs encoding variants at the corresponding site were included in a Tier 1, 2, or 3 library as described under “Experimental Procedures.” B, diagram to show the primary screening and initial combinatorial screening for substitutions that enhance binding to FcγRIIIA. The rectangle labeled SIG represents a polynucleotide encoding a signal sequence, which facilitates protein secretion from mammalian cells. A region encoding a hinge region is represented by a horizontal line labeled hinge. A rectangle labeled Fc polypeptide represents a polynucleotide encoding an Fc polypeptide chain. The five-pointed and four-pointed stars mean that the polynucleotides encoding the Fc polypeptide chains contain randomized codons at selected positions as explained under “Experimental Procedures.” The circles labeled with VH and VL represent the regions encoding a heavy chain variable region and a light chain variable region, respectively. The + + and − − in the rectangles labeled Fc polypeptide mean that these regions include mutations such that the encoded Fc polypeptide chain will have the substitutions E356K + D399K and K392D + K409D, respectively.
FIGURE 4.
FIGURE 4.
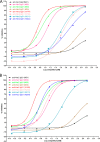
Percent inhibition of AlphaLISA® signal by full-length IgG1 antibodies containing variant Fc regions. A, percent inhibition of IgG1 containing the designated Fc variants to the interaction of IgG1 containing regular Fc and FcγRIIIA (Phe-158). B, percent inhibition of IgG1 containing the designated Fc variants to the interaction of IgG1 containing regular Fc and FcγRIIIA (Val-158). C, percent inhibition of IgG1 containing the designated regular and afucosylated Fc variants to the interaction of IgG1 containing regular Fc and FcγRIIIA (Phe-158). D, percent inhibition of IgG1 containing the designated regular or afucosylated Fc variants to the interaction of IgG1 containing regular Fc and FcγRIIIA (Val-158). The graphs show the percent inhibition of an AlphaLISA® signal as a function of concentration of competitor. The various competitors, which are human IgG1 antibodies, are indicated by alias in the graph, and the substitutions contained in each competitor and effect concentrations at 50% maximal inhibition (EC50) are indicated in Table 3.
FIGURE 5.
FIGURE 5.
Biacore analysis of humanized anti-Her2 human IgG1 antibody variants binding to human and mouse FcγRs. A, sensorgram of humanized anti-Her2 IgG1 antibody variants binding to monomeric human FcγRIIIA (Phe-158 allotype) aligned before association. Note that all variants have improved on-rate with the afuco-W117 variant being the top one when compared with wild type IgG1. B, sensorgram of humanized anti-Her2 IgG1 antibody variants binding to monomeric human FcγRIIIA (Val-158 allotype) aligned before association. Note that all variants have improved on-rate with the afuco-W117 variant being the top one when compared with wild type IgG1. C, sensorgram of humanized anti-Her2 IgG1 antibody variants binding to monomeric mouse FcγRIV aligned before association. Note that all variants have improved on-rate with the S239D/I332E variant being the top one when compared with wild type IgG1. D, sensorgram of humanized anti-Her2 IgG1 antibody variants binding to monomeric human FcγRIIB aligned before association. Note that homodimeric S239D/I332E variant has significant increase of on-rate when compared with wild type IgG1; W187 variant has some increase of on-rate; other heterodimeric variants have comparable binding to human FcγRIIB as wild type IgG1. E, sensorgram of humanized anti-Her2 IgG1 antibody variants binding to monomeric human FcγRIIA (H131 allotype) aligned before association. Note that all heterodimeric variants have improved on-rate with the W23 variant being the top one when compared with wild type IgG1. F, sensorgram of humanized anti-Her2 IgG1 antibody variants binding to monomeric human FcγRIIA (R131 allotype) aligned before association. Note that homodimeric S239D/I332E variant is the only one having improved on-rate when compared with wild type IgG1. G, percent of free human FcRn when the binding of 10 nm of human FcRn to regular human IgG1 was competed by different concentrations of humanized anti-Her2 IgG1 containing the Fc variants. Note all variants have comparable competition to FcRn as wild type IgG1. The various human IgG1 antibodies used in the Biacore analysis are indicated by alias in parentheses, and their substitutions contained in each variant are shown in Table 3. RU, response units.
FIGURE 6.
FIGURE 6.
Percent inhibition of AlphaLISA® signal by full-length anti-Her2 IgG1 antibodies containing variant Fc regions as homodimer or heterodimer. A, percent inhibition of AlphaLISA® signal by anti-Her2 IgG1 variants M01, M02, M03, M04, W144, W190, W211, and W202 to the interaction between wild type human IgG1 and monomeric human FcγRIIIA (Phe-158). B, percent inhibition of AlphaLISA® signal by anti-Her2 IgG1 variants M01, M02, M03, M04, W188, W203, W211, and W204 to the interaction between wild type human IgG1 and monomeric human FcγRIIIA (Phe-158). The graphs show the percent inhibition of AlphaLISA® signal as a function of competitor concentration. The various competitors, which are humanized anti-Her2 IgG1 antibody containing the Fc variants, are indicated by alias in the graph; the substitutions contained in each competitor and 50% of maximal effective concentration (EC50) are indicated in Table 3. Note that variants M04, W144, and W188 are heterodimeric IgG1s, and others are homodimeric IgG1s.
FIGURE 7.
FIGURE 7.
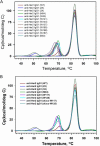
DSC profile of full-length IgG1 antibodies containing variant Fc regions. A, anti-Her2 IgG1 containing the wild type Fc (WT); S239D/I332E mutations (2X); S239D/I332E/A330L mutations (3X); heterodimerization mutations K392D and K409D in one Fc chain and E356K and D399K in the other Fc chain (M04); ADCC-enhanced variants W23, W141, W144, W157, W165, W168, W187, and B50. B, anti-Her2 IgG1 containing the wild type Fc (WT), S239D/I332E mutations (2X), S239D/I332E/A330L mutations (3X), heterodimerization mutations K392D and K409D in one Fc chain and E356K and D399K in the other Fc chain (M04); ADCC-enhanced variants W117, W125, afucosylated W117, and afucosylated W125. The various anti-Her2 human IgG1 antibodies used in these assays are indicated by alias in the graph, and the substitutions contained in each antibody are shown in Table 3. The transition peak at the lowest temperature for each profile typically corresponds to CH2 domain.
FIGURE 8.
FIGURE 8.
ADCC activity of anti-Her2 IgG1 antibodies containing Fc variants. The graph shows the percent of cells killed in an assay for antibody-dependent cellular cytotoxicity (% specific lysis) versus log10 of antibody concentration. A, percent of SK-BR-3 cells killed with anti-Her2 IgG1 containing the Fc variants of M01, M04, W23, W117, W125, and W141. B, percent of SK-BR-3 cells killed with anti-Her2 IgG1 containing the Fc variants of. M01, M04, W144, W165, W168, and W187. C, percent of JIMT-1 cells killed with anti-Her2 IgG1 containing the wild type Fc (wt), afucosylated wild type Fc (afuco-wt), variant W117 and afucosylated W117 (afuco-W117). D, percent of JIMT-1 cells killed with anti-Her2 IgG1 containing the wild type Fc (wt), afucosylated wild type Fc (afuco-wt), and variant W125 and afucosylated W125 (afuco-W125). The designation afuco preceding an alias means that the antibody lacks fucose on the glycan at Asn-297 of Fc region. The various human IgG1 antibodies used in these assays are indicated by aliases in the graph, and the substitutions contained in each antibody are indicated in Table 3. Effect concentrations at 50% of maximal killing (EC50, pm) are shown beside the designated Fc variants in the figure.
FIGURE 9.
FIGURE 9.
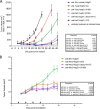
Antitumor activity of anti-TuAg and anti-Her2 HuIgG1 antibodies containing variant Fc regions in NCI-N87 and JIMT-1 xenograft human tumor models. A, NCI N87-tumor bearing CB-17/SCID mice were treated with the indicated antibodies at a dose of 10 mg/kg twice per week for 3 weeks via intraperitoneal administration with anti-SAv huIgG1, anti-TuAg clone H158 huIgG1 (S239D/I332E/A330L), anti-TuAg clone H158 huIgG1 (W165), anti-Her2 huIgG1 (WT), anti-Her2 huIgG1 (W165), and anti-Her2 huIgG1 (afuco-W117). The results are represented as mean tumor volume (mm3) (n = 10 mice/group); bars, ± S.E. The graph shows tumor volume measurement over time in days post-tumor implantation. At study end, 3/10, 5/10, and 5/10 mice did not exhibit measureable tumor following treatment with anti-Her2 IgG1 W165, wild type (WT), afuco-W117, respectively. B, JIMT-1-tumor xenograft bearing CB-17/SCID mice were treated once per week for 4 weeks via intraperitoneal administration with 10 mg/kg human IgG1 isotype control antibody, anti-Her2 huIgG1 (WT), anti-Her2 huIgG1 (W165), and anti-Her2 huIgG1 (afuco-W117). The various human IgG1 antibodies used in these assays are indicated by the alias in the graph, and the substitutions contained in each antibody are indicated in Table 3.

Similar articles

Cited by

References

    1. Reichert J. M., Valge-Archer V. E. (2007) Development trends for monoclonal antibody cancer therapeutics. Nat. Rev. Drug Discov. 6, 349–356 - PubMed
    1. Nimmerjahn F., Ravetch J. V. (2008) Fcγ receptors as regulators of immune responses. Nat. Rev. Immunol. 8, 34–47 - PubMed
    1. Gessner J. E., Heiken H., Tamm A., Schmidt R. E. (1998) The IgG Fc receptor family. Ann. Hematol. 76, 231–248 - PubMed
    1. Cartron G., Dacheux L., Salles G., Solal-Celigny P., Bardos P., Colombat P., Watier H. (2002) Therapeutic activity of humanized ant-CD20 monoclonal antibody and polymorphism in IgG Fc receptor FcγRIIIa gene. Blood 99, 754–758 - PubMed
    1. Musolino A., Naldi N., Bortesi B., Pezzuolo D., Capelletti M., Missale G., Laccabue D., Zerbini A., Camisa R., Bisagni G., Neri T. M., Ardizzoni A. (2008) Immunoglobin G fragment C receptor polymorphisms and clinical efficacy of trastuzumab-based therapy in patients with Her-2/neu-positive metastatic breast cancer. J. Clin. Oncol. 26, 1789–1796 - PubMed

MeSH terms