. 2014 Jan;15(1):54-62.
doi: 10.1038/ni.2767. Epub 2013 Nov 24.

The miR-126-VEGFR2 axis controls the innate response to pathogen-associated nucleic acids

Affiliations

The miR-126-VEGFR2 axis controls the innate response to pathogen-associated nucleic acids

Judith Agudo et al. Nat Immunol. 2014 Jan.

Abstract

miR-126 is a microRNA expressed predominately by endothelial cells and controls angiogenesis. We found miR-126 was required for the innate response to pathogen-associated nucleic acids and that miR-126-deficient mice had greater susceptibility to infection with pseudotyped HIV. Profiling of miRNA indicated that miR-126 had high and specific expression by plasmacytoid dendritic cells (pDCs). Moreover, miR-126 controlled the survival and function of pDCs and regulated the expression of genes encoding molecules involved in the innate response, including Tlr7, Tlr9 and Nfkb1, as well as Kdr, which encodes the growth factor receptor VEGFR2. Deletion of Kdr in DCs resulted in reduced production of type I interferon, which supports the proposal of a role for VEGFR2 in miR-126 regulation of pDCs. Our studies identify the miR-126-VEGFR2 axis as an important regulator of the innate response that operates through multiscale control of pDCs.


Figures
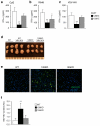
Figure 1
Figure 1. The IFN-α/β response is impaired in mice deficient in miR-126
(a) Measurement of serum IFN-α concentrations in response to TLR9 stimulation. CpG-A 2216 (2 μg) + DOTAP was injected into Mir155−/−, Mir126−/− and wild-type (WT) mice. Serum was collected 3 h, and IFN-α was measured by ELISA. Results are the mean ± s.d. (n = 3-5). (b) Measurement of serum IFN-α concentrations in response to TLR7 stimulation. R848 (2 μg) was injected into Mir155−/−, Mir126−/− and WT mice and 2 h later serum was collected for quantitation of IFN-α concentrations. Results are the mean ± s.d. (n = 3-5). (c) Measurement of serum IFN-α concentrations in response to HIV injection. VSV-pseudotyped, non-replicating HIV (VSV-HIV) was injected into Mir155−/−, Mir126−/− and WT mice and blood was collected 3 h later for quantitation of IFN-α. All results are shown as mean ± s.d. (n = 3-5). (d) Images of the brachial and inguinal lymph nodes taken from mice 3 h after injection of VSV-HIV. (e) Fluorescent microscopy images of the liver taken from mice 5 days after injection of VSV-HIV (encoding GFP). Representative image of 4 sections per mouse (n = 3-7). GFP (green), DAPI stained nuclei (blue). GFP+ cells are mostly macrophages and DCs. The liver was analyzed because it is the main site of infection following intravenous injection. (f) Quantitation of integrated HIV genomes in the liver 5 days after virus injection. Data are the mean ± s.d.; arbitrary units (AU) after normalization for 3-5 mice per group. AU was calculated by comparing CT values to a standard curve made from the HIV genome. *P < 0.05 vs WT, **P < 0.01 vs WT. Data is representative of at least 2 independent experiments.
Figure 2
Figure 2. miR-126 is highly and specifically expressed by plasmacytoid DCs
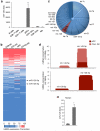
(a) Measurement of miR-126 expression in TLR7 and TLR9 expressing immune cells. Splenic B cells, CD8+ T cells, CD4+ T cells, macrophages, CD4+ DCs, CD8+ DCs and plasmacytoid DCs (pDCs) were sorted by flow cytometry. Small RNA was extracted and miR-126-3p, miR-21 and miR-16 were measured by quantitative PCR (qPCR). miR-126 abundance was normalized to miR-16 and miR-21, and calibrated across samples relative to expression in B cells (lowest value). Results are shown as mean ± s.d. (n = 4). **P < 0.01. (b) Profile of 365 miRNAs in mouse DCs. CD4+ DCs, CD8+ DCs and pDCs from the spleen and CD103+ DCs from the lungs were sorted by flow cytometry, small RNA was extracted, and the expression of 365 miRNAs was measured by qPCR (n = 3-5 replicates per cell type). The data was normalized using array means, and plotted in decreasing order according to the miRNA expression average across the groups. The color scale denotes the relative abundance of each miRNA. (c,d) miR-126 abundance in pDCs and CD4+ DCs. Small RNA was extracted from sorted splenic CD4+ DCs and pDCs and subjected to deep-sequencing. The relative frequency of each miRNA in pDCs is shown (c), as well as the read density across the miR-126 gene for pDCs and CD4+ DCs, and across the Mir142 gene, as a comparison. (e) miR-126 expression in human DCs. Human pDCs and conventional DCs (cDCs) were isolated from blood, small RNA was extracted, and qPCR analysis was performed to measure expression of miR-126 and miR-21. miR-126 abundance was normalized to miR-21 and calibrated relative to that expressed in cDCs. Results are shown as the mean ± s.d. (n = 3). *P <0.05 vs cDCs.
Figure 3
Figure 3. Loss of miR-126 impairs plasmacytoid DC homeostasis
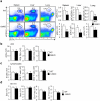
Eight-week old Mir126−/− mice and WT littermates were analyzed to determine the frequency and absolute number of pDCs (CD11cint, B220+, PDCA1+ cells) (a); splenic CD4+ DCs and CD8+ DCs (b); B cells and CD4+ and CD8+ T cells (c); eosinophils (Eos), neutrophils (Neut) and monocytes (mo) (d). Representative flow cytometry plots are shown. All graphs present the mean ± s.d. of the frequency and number of cells (n = 5-6). Data is representative of at least 5 independent analyses of mouse cohorts over a 18 month period.
Figure 4
Figure 4. miR-126 controls plasmacytoid DC survival
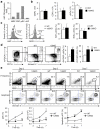
(a) Measurement of miR-126 during DC differentiation. CMPs, CDPs, pre-conventional DCs, and pDCs were isolated from the bone marrow (BM) and sorted by flow cytometry, and miR-126 was measured by qPCR. The data was normalized on miR-16 and miR-21 and calibrated relative to that expressed by cDCs. (b) CMPs, CDPs, and pDCs were quantified in the BM of Mir126−/− mice and WT littermates by flow cytometry. Results are shown as the mean ± s.d. (n = 4-6). (c) Measurement of pDC proliferation was performed by Ki67 staining or BrdU incorporation analysis of pDCs from Mir126−/− mice or WT littermates. Graphs present the mean ± s.d. (n = 3-4). Representative histograms are shown. Results of one out of three independent experiments are shown. (d) Apoptosis of pDCs was analyzed by quantification of Annexin V+ and DAPI+ pDCs in the BM of Mir126−/− mice and WT littermates. Results are mean ± s.d. (n = 4). (e) The number and frequency of pDCs, and their apoptotic status, in Flt3L cultures was determined by flow cytometry analysis of CD11c+ B220+ PDCA1+ cells stained with Annexin V and DAPI. Representative flow cytometry plots of the cultures at the indicated time points during differentiation are shown. The graphs present the mean ± s.d. (n = 4). *P < 0.05 vs WT, **P < 0.01 vs WT. Results of one out of two independent experiments are shown.
Figure 5
Figure 5. pDCs are functionally impaired in the absence of miR-126
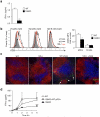
(a) Measurement of IFN-α from freshly isolated pDCs stimulated with CpG-A. pDCs were isolated from the spleen and lymph nodes of Mir126−/− mice and littermate controls (WT) by bead selection. 2.5 × 10⁴ cells were seeded and stimulated with ODN 2216 (5 μM) in a 96-round bottom well plate, and IFN-α was measured in the supernatant after 12 h by ELISA. The graph presents the mean ± s.d. (n = 4). **P < 0.01 vs WT. (b) In vivo activation of pDCs following TLR9 stimulation was assessed by measuring surface CD69 on pDCs in the spleen (Spl) and lymph nodes (LN) of Mir126−/− mice and WT littermates following injection of ODN 2216 (1.5 μg). CD69 expression on B cells from the same mice is shown for comparison. Representative histograms are shown. Graphs present the mean ± s.d. (n = 4) of the mean fluorescence intensity (MFI) of CD69. *P<0.05 vs WT. Results of one out of two independent experiments are shown. (c) Florescence microscopy analysis of pDC biodistribution in vivo. Splenic frozen tissue sections from the mice treated in (b), then stained for SiglecH (green), B220 (red) and CD3 (blue) to label pDCs, B cells and T cells, respectively. Arrows point to pDC clusters that form after activation. Scale bar is 50 μm. Representative images are shown from n = 4 animals. (d) Measurement of serum IFN-α concentrations in Mir126−/− mice following adoptive transfer of WT pDCs. Mir126−/− mice or Mir126−/− mice in which we transferred WT pDCs were injected with VSV-HIV. Serum was collected at the indicated times, and IFN-α was measured by ELISA. Results are the mean ± s.d. (n = 3-4).
Figure 6
Figure 6. miR-126 regulates key innate response genes in pDCs and directly targets the mTOR pathway
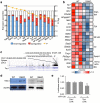
(a) pDCs were isolated from the spleen of Mir126−/− mice and WT littermates, sorted by flow cytometry, and gene expression was measured by microarray. Analysis of molecular pathways altered in Mir126−/− pDCs was performed by Ingenuity® by using Fisher’s exact test, Benjamini-Hochberg correction for multiple testing. Yellow line is the −log(P-value). (b) Heat-map representation of genes that were significantly changed in Mir126−/− pDCs compared to WT pDCs, and known to be involved in the innate response. Each column is an individual mouse. Data is color coded to reflect gene expression z-scores. Genes are grouped as: Pat det (pathogen detection related genes), Cyt (cytokines), NF-κB (NF-ΚB family genes), TF (transcription factors), Apopt (apoptosis related genes), Immu active (immune activation related genes), EC (endothelial cell-specific genes). (c) RNA-seq analysis of Tsc1 mRNA expression in flow-sorted WT splenic pDCs. The miR-126 recognition site in the Tsc1 3′UTR is shown. (d) TSC1 protein expressed in splenic pDCs of Mir126−/− and WT littermates, isolated by flow cytometry and measured by immunoblot. Two independent biological replicates are shown. (e) Analysis of miR-126 regulation of Tsc1 by 3′UTR assay. Plasmids encoding luciferase upstream of the Tsc1 3′UTR sequence, or the 3′UTR of a gene with no putative miR-126 binding site were co-transfected into HEK293T cells with either a control plasmid or a plasmid expressing miR-126. Results are shown as mean ± s.d. (n = 3). *P < 0.05 vs control plasmid.
Figure 7
Figure 7. VEGFR2 is important for pDC function and its expression is regulated by miR-126
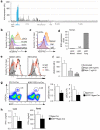
(a) VEGFR2 (Kdr) expression pattern across the murine immune system as determined by the Immgen Consortium. Expression of each gene was measured by Affymetrix gene array on 234 different populations of immune cells that were flow sorted to high purity. Shown is the mean ± s.d. (n ≥ 3). (b) VEGFR2 surface expression was determined on conventional DCs (cDC), B cells and pDCs from the spleen by flow cytometry. (c) The expression of VEGFR2 on pDCs from the spleen and bone marrow (BM). (d) KDR expression in human DCs. Human pDCs and conventional DCs (cDCs) were isolated from blood, and pDCs were isolated from the lungs of a human donor. qPCR analysis was performed to measure expression of KDR. (e) VEGFR2 surface expression was measured on pDCs taken from the spleen and mesenteric lymph nodes (MLN) of Mir126−/− mice and controls. Shown is a representative histogram (n = 5) of one representative experiment out of two. (f) VEGFR2 surface expression was measured on pDCs after treatment with the mTOR inhibitor Rapamycin. Splenocytes were cultured from wild-type mice with the indicated dose of rapamycin for 16 h, and VEGFR2 was measured on pDCs (PDCA+SiglecH+B220+CD11cint) by flow cytometry. Shown is the mean ± s.d. (n = 3). (g) Analysis of pDC frequency in the spleen of 2-month old Itgax-Cre Kdrfl/fl mice and WT littermates (Kdrfl/fl and Itgax-Cre). pDCs were defined as CD11cint B220+ SiglecH+ PDCA1+ cells. Shown is a representative flow cytometry plot (top) and a graph of the mean ± s.d. (n ≥ 3). (h) Measurement of serum IFN-α concentrations in Itgax-Cre Kdrfl/fl mice and WT littermates after injection of CpG-A or R848. Shown is the mean ± s.d. (n =3-8). Results of one of two independent experiments are shown.

Comment in

Similar articles

Cited by

References

    1. McCartney SA, Colonna M. Viral sensors: diversity in pathogen recognition. Immunol. Rev. 2009;227:87–94. - PMC - PubMed
    1. Kawai T, Akira S. Toll-like receptors and their crosstalk with other innate receptors in infection and immunity. Immunity. 2011;34:637–650. - PubMed
    1. Chevrier N, et al. Systematic discovery of TLR signaling components delineates viral-sensing circuits. Cell. 2011;147:853–867. - PMC - PubMed
    1. Yang K, et al. Human TLR-7-, -8-, and -9-mediated induction of IFN-alpha/beta and -lambda Is IRAK-4 dependent and redundant for protective immunity to viruses. Immunity. 2005;23:465–478. - PMC - PubMed
    1. Kumar H, Kawai T, Akira S. Toll-like receptors and innate immunity. Biochem. Biophys. Res. Commun. 2009;388:621–625. - PubMed

Publication types

MeSH terms

Associated data