. 2013 Nov 21;155(5):1008-21.
doi: 10.1016/j.cell.2013.10.031.

Integrative functional genomic analyses implicate specific molecular pathways and circuits in autism

Affiliations

Integrative functional genomic analyses implicate specific molecular pathways and circuits in autism

Neelroop N Parikshak et al. Cell. .

Abstract

Genetic studies have identified dozens of autism spectrum disorder (ASD) susceptibility genes, raising two critical questions: (1) do these genetic loci converge on specific biological processes, and (2) where does the phenotypic specificity of ASD arise, given its genetic overlap with intellectual disability (ID)? To address this, we mapped ASD and ID risk genes onto coexpression networks representing developmental trajectories and transcriptional profiles representing fetal and adult cortical laminae. ASD genes tightly coalesce in modules that implicate distinct biological functions during human cortical development, including early transcriptional regulation and synaptic development. Bioinformatic analyses suggest that translational regulation by FMRP and transcriptional coregulation by common transcription factors connect these processes. At a circuit level, ASD genes are enriched in superficial cortical layers and glutamatergic projection neurons. Furthermore, we show that the patterns of ASD and ID risk genes are distinct, providing a biological framework for further investigating the pathophysiology of ASD.


Figures

Figure 1
Figure 1. Methodological overview and co-expression network analysis
(A) Flowchart of the overall approach. (B) Network analysis dendrogram showing modules based on the co-expression topological overlap of genes throughout development. Color bars below give information on module membership, gene biotype, cortical region specificity, age trajectory, and robustness of module assignment. (C) Module characterization including GO enrichment and trajectory throughout development. The fit line represents locally weighted scatterplot smoothing (Extended Experimental Methods). GO enrichments are adjusted for multiple comparisons (FDR < 0.01), and reported Z-scores represent relative enrichment, with the red line at Z = 2. See also Table S1 and Figure S1.
Figure 2
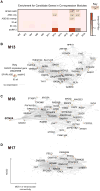
Figure 2. Enrichment of SFARI ASD, asdM12 and ID genes in developmental networks
(A) Module-level enrichment for gene sets from a curated set of ASD risk genes (SFARI ASD), a curated set of ID genes (“ID all”), and an unbiased set of ASD risk genes (asdM12). Overlapping (ASD/ID overlap) and non-overlapping sets (“ASD only”, “ID only”) are also shown. All enrichment values for over-represented lists with p < 0.05, OR > 1 are shown to demonstrate enrichment trends (*p < 0.05, **FDR < 0.05). (B), (C) and (D) show network plots for M13, M16, and M17 respectively. Most hub genes overlapping with SFARI ASD and asdM12 enrichment are not the same, showing that enrichment of these two sets is not driven by a narrow shared subset of genes. Network plots comprise the top 200 connected genes (based on kME, a measure of intramodular connectivity) and their top 1000 connections in the sub-network. Genes with membership in SFARI ASD, asdM12, or the “ID all” list are labeled and plotted according to multidimensional scaling (MDS) of gene expression correlations, which graphs genes with similar expression patterns closer to each other. See also Table S2.
Figure 3
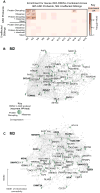
Figure 3. Enrichment of genes affected by RDNVs in developmental networks
(A) Module-level enrichment for multiple categories of RDNV in ASD affected probands and unaffected siblings combined across four studies. All enrichment values for over represented lists with p < 0.05, OR > 1 are shown to demonstrate enrichment trends (*p < 0.05, **validated in replication set) marked. M2 and M3 are strongly enriched for protein disrupting and missense RDNV affected genes in probands. Enrichment for genes affected by silent RDNVs in probands and RDNV gene sets affected in siblings represent control gene sets and do not show enrichment. (B) and C) show network plots for M2 and M3, with all genes plotted and all genes carrying RDNVs displayed. Network plots show all genes in the module with protein disrupting or missense RDNV-affected genes highlighted. Those with high intramodular connectivity (kME > 0.75) are labeled in black, with the rest in grey. The top 1000 connections are shown, and genes are plotted according to the multidimensional scaling (MDS) of co-expression as in Figure 2. See also Figure S2-3 and Table S2.
Figure 4
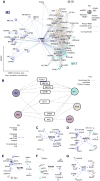
Figure 4. Translational and transcriptional co-regulation connects developmentally distinct ASD-affected modules
(A) Co-expression based network plot of FMRP interactions with genes in M2, M16, and M17 that are either affected by RDNVs or in an ASD candidate list. Genes are plotted as in Figure 2 and 3, but now across modules, with FMRP placed at the center. (B) Summary of TF binding site (TFBS) enrichment in modules for TFs that have evidence for function in a neurodevelopmental context. Dashed lines indicate enrichment in the module for predicted binding sites. (C-G) MEF2A, MEF2C, SATB1, FOXO1, and ELF1 are all enriched for their binding motifs in the upstream regions of ASD gene-enriched modules following anti-correlated developmental patterns. Network plots highlight genes with a predicted binding site (light dashed arrow) contributing to this enrichment that are also affected by RDNVs or in an ASD candidate list. Arrows representing a TFBS found in a ChIP experiment are marked in dark blue. For network plots, the top 1000 positive connections between genes are plotted and node size is proportional to connectivity within the genes' assigned module, therefore larger nodes are more central hubs. See also Table S3.
Figure 5
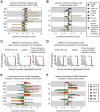
Figure 5. Enrichment for laminar differential expression of gene sets and associated developmental co-expression modules in fetal human and adult primate cortex
(A) In fetal cortex, ASD sets (SFARI, asdM12, and RDNV-affected) are enriched for differential expression in laminae containing post mitotic neurons, whereas genes implicated in ID are weakly enriched in germinal layers. A high Z-score for a gene set in a layer corresponds to differential expression across the gene set in that layer. (B) In adult cortex, asdM12sets show strong enrichment in layer 3, where as ID genes are weakly enriched in layer 5. (C) and (D) Summing the Z-score across layers in A) and B) and comparing to randomly permuted sets of genes of similar size demonstrates that, in both fetal and adult cortex, the laminar distribution of multiple ASD implicated gene sets is significantly distinct from that of genes implicated only in ID. (E) SFARI/asdM12 associated developmental co-expression modules M13, M16, and M17 follow enrichment trends similar to the SFARI/asdM12 gene set in fetal brain. However, the modules strongly associated with the RDNV affected genes, M2 and M3, show distinct enrichment patterns. (F) ASD-associated modules are predominantly enriched in superficial layers 2-4 of adult cortex. Additionally, M16 shows weak enrichment in L5. In contrast to fetal cortex, M2 and M3 are in enriched in the same laminae in adult suggesting they serve distinct functions during cortical development that contribute to superficial cortical layers 2-4. Dashed lines in bar plots indicate Z = 2.7 (equivalent to FDR = 0.01), error bars indicate 95% bootstrapped CIs. Laminae: Marginal Zone (MZ), Outer/Inner Cortical Plate (CPo/CPi), Subplate (SP), Intermediate Zone (IZ), Outer/Inner Subventricular Zone (SZo/SZi), Ventricular Zone (VZ), and adult cortical layers 2-6 (L2-6). See also Figure S4.
Figure 6
Figure 6. Laminar patterns for genes implicated in ASD
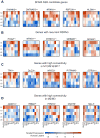
(A) SFARI candidate genes for ASD. (C) Genes with strong recurrent RDNV evidence across studies. Genes not displayed include TBR1 (lower layer enriched), CHD8 (no layer enrichment detected), CUL3 (no layer enrichment detected), and KATNAL2 (not detected in these data). (B) Genes with high connectivity in M13, M16, and M17. (C) RDNV genes with high connectivity in M2 and M3. a indicates membership in SFARI ASD, b indicates membership in asdM12, c indicates the gene is affected by a RDNV, *indicates recurrent RDNVs Color bar values represent scaled expression (standard deviation of the mean-centered expression value across layers). All genes shown have t > 2 for enrichment in an upper layer (L2 or L3) over background, and t < 2 for lower layers (L5 or L6). Regions: dorsolateral prefrontal (DLPFC), orbitofrontal (OFC), anterior central gyrus (ACG), primary motor (M1), primary somatosensory (S1), primary auditory (A1), higher-order visual area TE (TE), higher-order visual area MT/5 (MT), secondary visual cortex (V2), primary visual cortex (V1).
Figure 7
Figure 7. Summary of findings and model for effects of ASD implicated gene sets
(A) ASD risk genes from multiple sources were enriched in five co-expression modules throughout development, M2, M3, M13, M16, and M17. (B) Early transcriptional regulators in M2/M3 are enriched for RDNVs, while the later expressed synaptic genes are associated with previously studied ASD genes (Biological processes time periods adopted from Andersen, 2003). (C) ASD genes are most consistently associated with laminae containing post-mitotic neurons during early fetal development (broadly in IZ, SP, CPo/CPi, and MZ) and superficial layers in adult (L2-4). Multiple modules are also strongly associated with markers of upper layer glutamatergic neurons in adult cortex, suggesting many ASD genes preferentially affect these cell types. B) and C) also summarize that ID genes are largely distinct from ASD genes in both developmental trajectory and neocortical layer enrichment. Both figures A and B correspond to the same time scale as marked by the axis on the plot in (A). We summarize the strongly enriched findings, but note that weaker enrichment for other patterns exists that may be important for subsets of ASD. Individual genes can be prioritized for biological validation using a combination of network position, bioinformatic scores, and the biological context highlighted here, as discussed in the text and shown in Table S4.

Similar articles

Cited by

References

    1. Amaral DG, Schumann CM, Nordahl CW. Neuroanatomy of autism. Trends Neurosci. 2008;31:137–145. - PubMed
    1. Andersen SL. Trajectories of brain development: point of vulnerability or window of opportunity? Neuroscience & Biobehavioral Reviews. 2003;27:3–18. - PubMed
    1. Anney R, Klei L, Pinto D, Almeida J, Bacchelli E, Baird G, Bolshakova N, Bölte S, Bolton PF, Bourgeron T, et al. Individual common variants exert weak effects on the risk for autism spectrum disorderspi. Human Molecular Genetics. 2012;21:4781–4792. - PMC - PubMed
    1. Basu SN, Kollu R, Banerjee-Basu S. AutDB: a gene reference resource for autism research. Nucleic Acids Res. 2009;37:D832–D836. - PMC - PubMed
    1. Belmonte MK, Allen G, Beckel-Mitchener A, Boulanger LM, Carper RA, Webb SJ. Autism and abnormal development of brain connectivity. Journal of Neuroscience. 2004;24:9228–9231. - PMC - PubMed

Publication types

MeSH terms