Comparative Study
. 2013 Nov;10(11):e1001549.
doi: 10.1371/journal.pmed.1001549. Epub 2013 Nov 12.

Whole blood gene expression profiles to assess pathogenesis and disease severity in infants with respiratory syncytial virus infection

Affiliations
Comparative Study

Whole blood gene expression profiles to assess pathogenesis and disease severity in infants with respiratory syncytial virus infection

Asuncion Mejias et al. PLoS Med. 2013 Nov.

Abstract

Background: Respiratory syncytial virus (RSV) is the leading cause of viral lower respiratory tract infection (LRTI) and hospitalization in infants. Mostly because of the incomplete understanding of the disease pathogenesis, there is no licensed vaccine, and treatment remains symptomatic. We analyzed whole blood transcriptional profiles to characterize the global host immune response to acute RSV LRTI in infants, to characterize its specificity compared with influenza and human rhinovirus (HRV) LRTI, and to identify biomarkers that can objectively assess RSV disease severity.

Methods and findings: This was a prospective observational study over six respiratory seasons including a cohort of infants hospitalized with RSV (n = 135), HRV (n = 30), and influenza (n = 16) LRTI, and healthy age- and sex-matched controls (n = 39). A specific RSV transcriptional profile was identified in whole blood (training cohort, n = 45 infants; Dallas, Texas, US) and validated in three different cohorts (test cohort, n = 46, Dallas, Texas, US; validation cohort A, n = 16, Turku, Finland; validation cohort B, n = 28, Columbus, Ohio, US) with high sensitivity (94% [95% CI 87%-98%]) and specificity (98% [95% CI 88%-99%]). It classified infants with RSV LRTI versus HRV or influenza LRTI with 95% accuracy. The immune dysregulation induced by RSV (overexpression of neutrophil, inflammation, and interferon genes, and suppression of T and B cell genes) persisted beyond the acute disease, and immune dysregulation was greatly impaired in younger infants (<6 mo). We identified a genomic score that significantly correlated with outcomes of care including a clinical disease severity score and, more importantly, length of hospitalization and duration of supplemental O2.

Conclusions: Blood RNA profiles of infants with RSV LRTI allow specific diagnosis, better understanding of disease pathogenesis, and assessment of disease severity. This study opens new avenues for biomarker discovery and identification of potential therapeutic or preventive targets, and demonstrates that large microarray datasets can be translated into a biologically meaningful context and applied to the clinical setting. Please see later in the article for the Editors' Summary.


Conflict of interest statement

In the last 3 years, OR has had financial relations with companies that are involved with respiratory viruses research or product as follows: Advisory boards: Gilead, Abbvie, Alios, Quidel; Honoraria for Lectures and Co-Chair Medical Conferences: Abbvie; Cover part of travel expenses to present clinical study at a scientific conference: MedImmune; Research Grant: Abbott Molecular. In the last 3 years, AM has had relations with companies that are involved with respiratory viruses research or product as follows: Advisory Boards: Alios, Janssen Infectious Diseases BVBA; Honoraria for Lectures at CME Conferences: Abbvie; Research Grant: Gilead. All other authors have declared that no competing interest exist.

Figures

Figure 1
Figure 1. Flow diagram of study patients.
Patient allocation and analyses performed throughout the study are depicted in Figure 1: RSV signature analysis (A), discrimination and modular analyses (B), follow-up analysis (C), age analyses (D), and disease severity analysis (E). Patients included in the different sub-analyses were matched for age, gender, and race/ethnicity with controls. In addition, for the age analyses (D), children greater or younger than 6 mo were matched for disease severity. Asterisk indicates that RSV patients used for viral discrimination analysis (B) were previously used in the RSV signature analysis (A). Ctrl, control; FU, follow-up.
Figure 2
Figure 2. Microarray processing and statistical analyses.
(A) Extracted and processed RNA was hybridized into Illumina human beadchips (205 samples into Human WG-6 v3 beadchips and 36 in to Human HT-12 v4) and scanned on the Illumina Beadstation 500, and fluorescent hybridization signals were assessed and scaled using Illumina BeadStudio. (B) For analysis we used GeneSpring software, IPA, modular analyses, and MDTH analysis. Depending on the type of analysis, either normalized, non-normalized, or raw data were used. FDR, false discovery rate; KW, Kruskal-Wallis test; MW, Mann-Whitney test.
Figure 3
Figure 3. RSV transcriptional signature is characterized by overexpression of innate immunity and suppression of adaptive immunity.
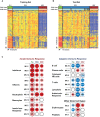
(A) Statistical group comparisons between children <2 y of age with RSV LRTI and healthy matched controls (Ctl) (Mann-Whitney test p<0.01, Benjamini-Hochberg multiple test correction and 1.25-fold change) yielded 2,317 significantly differentially expressed transcripts (training set; Dallas, Texas). Transcripts were organized by hierarchical clustering, where each row represents a single transcript and each column an individual participant. Normalized expression levels are indicated as overexpressed (red) or underexpressed (blue) compared to the median expression of healthy controls (yellow). (B) The same 2,317-transcript list applied to an independent set (test set; Dallas, Texas) of 46 children with RSV LRTI and 13 matched controls. (C) A third cohort of children with RSV LRTI was used as validation set A (Turku, Finland). Unsupervised hierarchical clustering of the 2,317 transcripts grouped all RSV patients together (red bar) except for the only patient who was diagnosed in the outpatient setting, who clustered with the controls. Dotted line indicates the cluster separation. (D) A fourth cohort of 28 infants with RSV and eight matched controls was used as validation set B (Columbus, Ohio) and was analyzed in a different gene chip (Illumina Human HT-12 v4). Unsupervised clustering of the 2,194 transcripts (123 transcripts were not present in this new gene chip) segregated patients and controls with high accuracy. Dotted line indicates the cluster separation. (E and F) Average modular transcriptional fingerprint for RSV LRTI in the training (E) and test (F) sets. Colored spots represent the percentage of significantly overexpressed (red) or underexpressed (blue) transcripts within a module in patients with RSV infection compared to controls (see [G] for module map key). Blank modules indicate no significant differences between patients and controls. Patients with RSV LRTI demonstrated significant overexpression of modules related to erythrocytes (M2.3, M3.1), platelets (M1.1), and cell cycle (M3.3, M4.7, M6.11, M6.16), and to innate immunity including interferon (M1.2, M3.4, M5.12), monocytes (M4.14), neutrophils (M5.15), innate immune responses (M3.2, M4.2), and inflammation (M4.6, M5.1, M6.13). Conversely, genes related to adaptive immunity: T cells (M4.1, M4.15), B cells (M4.10), lymphoid lineage (M6.19), cytotoxicity/NK cells (M3.6), and antimicrobial response (M2.1) were significantly underexpressed. (G) Key to the functional interpretation of each transcriptional module (M): module sets 1 to 6 are indicated on the y-axis, and module numbers within each set are indicated on the x-axis. (H) Scatter plot correlating (Spearman's r) percentage of modular expression between the training (x-axis) and the test (y-axis) sets. The interferon module (M1.2) and the antimicrobial response module (M2.1) were the most highly correlated between the training and the test sets.
Figure 4
Figure 4. Top canonical pathways expressed in children with RSV LRTI.
IPA showed that the interferon-signaling pathway followed by genes related to cell cycle and hematopoietic precursors (ATM) were the most upregulated pathways, while the B cell and T cell signaling pathways were the most downregulated pathways, confirming our previous results using modular-level analyses. iCOS-SL in Th cells, inducible costimulator signaling in T helper cells.
Figure 5
Figure 5. Transcriptional profiles from children with influenza, RSV, and HRV LRTI.
(A) A supervised learning K-NN algorithm with seven neighbors and a p-value ratio cutoff of 0.5 was used to identify the 70 top-ranked genes that best discriminated RSV from HRV and influenza LRTI. Using the 70 classifier genes, leave-one-out cross-validation of the training set correctly classified 67 of the 68 samples (influenza [n = 9; green]; RSV [n = 44, blue]; HRV [n = 15, burgundy]) (98% accuracy). The patient sample that was not classified correctly belonged to an infant <6 mo old with mild influenza A LRTI (#207). Predicted class is indicated by light-colored rectangles. (B) The 70 classifier genes were cross-validated on an independent set of 69 new patients (test set; influenza n = 7; RSV n = 47; HRV n = 15). The algorithm correctly categorized 63 of the 69 new patient samples (91% accuracy). Five samples (#22, #38, #45, #46, #49) from infants with RSV were misclassified as influenza. These five RSV patients demonstrated overexpression of the 18 top overexpressed influenza classifier genes, which was not demonstrated in the rest of the RSV cohort (Table 2). One patient with mild RSV LRTI (#47) was not predicted. (C) Mean modular transcriptional fingerprint for influenza (n = 16 and 10 matched controls), RSV (n = 44 and 14 matched controls), and HRV LRTI (n = 30 and 14 matched controls). Overall, children with HRV infection demonstrated a milder activation of the innate and adaptive immune responses, compared with children with influenza or RSV infection. Children with influenza displayed a stronger activation of genes related to interferon (M1.2, M3.4, M5.12), inflammation (M4.6, M5.1, M6.13), monocytes (M4.14), and innate immune response (M3.2, M4.2, M4.13) compared with children with RSV or HRV. Several type I interferon (IFIH1, IFIT1–5, STAT2, MX1) and type II interferon (IFI16, CXCL10, CCL8, GBP1–5, STAT1, SOCS1) genes were expressed only in influenza and RSV infection (Table S3). In addition, the magnitude of the type I interferon (IFI44, IFI44L, OAS2, IRF7) and type II interferon (IFI35, IFITM1–3) response present was 2- to 22-fold higher in children with influenza compared with children with RSV or HRV. Similarly, genes related to inflammation, monocytes, and innate immune response were greatly overexpressed in children with influenza compared to children with RSV or HRV LRTI. Neutrophil-related genes (M5.15) such as CEACAM6, DEFA4, MPO, and MMP8 were significantly overexpressed in RSV infection, followed by HRV infection and, at a lower level, influenza infection. DEFA1, DEFA3, ELA2, CEACAM8, and AZU1 were expressed only in RSV and HRV infection. Three genes were solely and significantly expressed in RSV infection but not in influenza or HRV infection: LTF, RETN, which binds to DEFA1, and the scavenger receptor OLR1. On the other hand, the suppression of genes related to B cells (M4.10), T cells (M4.1, M4.15), lymphoid lineage (M6.19), and antimicrobial response (M2.1) observed in RSV infection was significantly milder or not present in children with influenza or HRV LRTI. The outer dark circles highlight the disease group (influenza, RSV, or HRV) with greater (red) or lower (blue) modular activation.
Figure 6
Figure 6. Blood host immune profiles remain altered 1 mo after acute RSV LRTI.
(A) Samples from 21 infants with RSV LRTI were obtained 1 mo after the acute hospitalization. Hierarchical clustering of control (Ctrl), acute, and follow-up samples reflected the heterogeneity observed during the acute disease. (B) MDTH scores per patient are represented by bars (yellow: healthy controls; orange: acute RSV LRTI; green: RSV follow-up) underneath the expression profile for that specific sample in (A). Wilcoxon rank paired t-test demonstrated significantly lower MDTH scores at follow-up compared with during the acute disease. (C and D) Average modular transcriptional fingerprint for acute RSV LRTI (C) and follow-up (D). Colored spots represent the percentage of significantly overexpressed (red) or underexpressed (blue) transcripts within a module in patients with RSV infection compared to controls (see Figure 3G for module map key). Circle rings highlight modules with greater changes from the acute to the follow-up visit. (E) Analysis of modular activation during acute RSV LRTI and follow-up revealed overexpression of interferon-related genes (M1.2, M3.4, M5.12) at a greater level at follow-up than during acute disease (54% in acute RSV versus 78% at follow-up; p<0.001). This effect was specifically observed in type-I interferon (TRIM25) but mostly in interferon-γ-related genes (BTN3A1, TAP2, SP100, SP110, NUB1). Genes related to neutrophils (M5.15), monocytes (M4.14), and innate immunity (M3.2, M4.2) that were overexpressed during acute disease showed decreased expression at follow-up. Cytotoxic/NK cell (M3.6) genes were significantly overexpressed at follow-up compared with the acute disease. B cell (M4.10) genes remained underexpressed over time, but genes related to T cells (M4.1, M4.15), lymphoid lineage (M6.19), and antimicrobial response (M2.1), which were underexpressed during acute RSV, reached expression levels comparable to those observed in healthy controls (grey circles) at follow-up.
Figure 7
Figure 7. Age at the time of infection influences the host immune response to RSV.
(A) Statistical group comparisons between 20 patients <6 mo of age and nine healthy matched controls (Ctl) yielded 1,212 significantly differentially expressed transcripts between the two groups. Of those, 952 (79%) transcripts were underexpressed. (B) The same type of analysis using 17 children with RSV LRTI at age 6–24 mo and nine healthy matched controls yielded 2,176 significantly differentially expressed transcripts, with 1,075 (49%) transcripts underexpressed. (C) Venn diagram displaying the overlap between the global RSV signature described in Figure 3A and the age-specific RSV gene expression profiles. (D) Modular analysis in the two age groups revealed a similar trend in the overexpression of neutrophil-related genes (M5.15) and the suppression of genes related to T cells (M4.1, M4.15), lymphoid lineage (M6.19), and antimicrobial response (M2.1). On the other hand, the overall activation of the innate immunity, interferon, and inflammatory response was decreased in infants <6 mo, and the adaptive immune response (B cells [M4.10], plasma cells [M4.11], and cytotoxic/NK cells [M3.6]) was further suppressed compared with children 6–24 mo of age. Circle rings indicate the modules within each group with greater over- or underexpression. (E) Horizontal bars illustrating the proportion of over- and underexpressed modules in infants <6 mo and children 6–24 mo of age in relation to the global RSV signature. (F) These differences are further illustrated in a spider graph representing the per-module median expression values of the significantly differentially expressed modules between the two age groups.
Figure 8
Figure 8. RSV disease severity is driven by greater suppression of the host immune response.
(A) Modular fingerprints were independently derived from children with mild (n = 20), moderate (n = 17), or severe (n = 16) disease based on a CDSS, and from ten healthy controls. All RSV patients and controls were age and gender matched. Median (IQR) CDSS indicated for each disease severity group. (B) Horizontal bars illustrating the percentage of overexpressed, underexpressed, and unchanged modules compared to healthy controls for children with mild, moderate, and severe RSV LRTI (Chi square test p = 0.0025). (C and D) Significantly overexpressed (C) and underexpressed (D) modules in children with different degrees of clinical severity. Dots represent the median expression value for each individual transcript in all three disease severity groups (mild, moderate, and severe) per module or module aggregate sharing the same function. Genes related to interferon (M1.2, M3.4, M5.12) and innate immunity (M3.2, M4.2, M4.13) were significantly overexpressed in children with either moderate or severe RSV LRTI compared with children with mild disease. Overexpression of genes related to neutrophils (M5.15), inflammation (M4.6, M5.1, M6.13), and erythrocytes (M2.3, M3.1) significantly increased with disease severity. Children with severe RSV LRTI had significantly greater underexpression of genes related to T cells (M4.1, M4.15), cytotoxic/NK cells (M3.6), plasma cells (M4.11), cell cycle (M2.2, M3.3–5, M6.11–16), and mitochondrial metabolism (M5.10, M6.2, M6.12). Except for plasma cells, where adjusted (single asterisk) and unadjusted (double asterisk, in parentheses) p-values are displayed, all other p-values represent adjusted p-values (single asterisk) after applying the Bonferroni correction for multiple comparisons. N/S, not significant.
Figure 9
Figure 9. MDTH scores correlate with clinical disease severity in children with RSV LRTI.
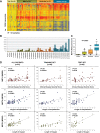
(A) Hierarchical clustering of 1,536 significantly differentially expressed transcripts (Kruskal-Wallis p<0.01, Benjamini-Hochberg multiple test correction) between 53 RSV patients classified as having mild (n = 20), moderate (n = 17), or severe (n = 16) RSV LRTI and ten healthy matched controls (Ctrl). (B) This gene list was used to calculate the MDTH score, or molecular disease severity score (MDSS). Each bar represents the MDTH score for a given sample (yellow bars represent the scores for healthy controls, green for mild RSV, orange for moderate RSV, and blue for severe RSV). (C) Children with severe RSV LRTI, and thus higher CDSSs, also had significantly greater MDTH scores (severe: median 1,769 [IQR 1,268–3,870] versus moderate: median 607 [IQR 350–1,396] and mild: median 596 [IQR 194–836]; Kruskal-Wallis test p<0.0001). (D) MDTH scores significantly correlated with CDSS, total length of hospitalization, and total duration of supplemental O2 in the overall RSV cohort (n = 91), and in the training set (n = 45) and test (n = 46) sets when calculated separately (Spearman's r).

Similar articles

Cited by

References

    1. Bryce J, Boschi-Pinto C, Shibuya K, Black RE (2005) WHO estimates of the causes of death in children. Lancet 365: 1147–1152. - PubMed
    1. Mulholland K, Hilton S, Adegbola R, Usen S, Oparaugo A, et al. (1997) Randomised trial of Haemophilus influenzae type-b tetanus protein conjugate vaccine [corrected] for prevention of pneumonia and meningitis in Gambian infants. Lancet 349: 1191–1197. - PubMed
    1. Klugman KP, Madhi SA, Huebner RE, Kohberger R, Mbelle N, et al. (2003) A trial of a 9-valent pneumococcal conjugate vaccine in children with and those without HIV infection. N Engl J Med 349: 1341–1348. - PubMed
    1. Madhi SA, Klugman KP (2004) A role for Streptococcus pneumoniae in virus-associated pneumonia. Nat Med 10: 811–813. - PMC - PubMed
    1. Berkley JA, Munywoki P, Ngama M, Kazungu S, Abwao J, et al. (2010) Viral etiology of severe pneumonia among Kenyan infants and children. JAMA 303: 2051–2057. - PMC - PubMed

Publication types

MeSH terms