. 2013:4:2823.
doi: 10.1038/ncomms3823.

Fate tracing reveals hepatic stellate cells as dominant contributors to liver fibrosis independent of its aetiology

Affiliations

Fate tracing reveals hepatic stellate cells as dominant contributors to liver fibrosis independent of its aetiology

Ingmar Mederacke et al. Nat Commun. 2013.

Abstract

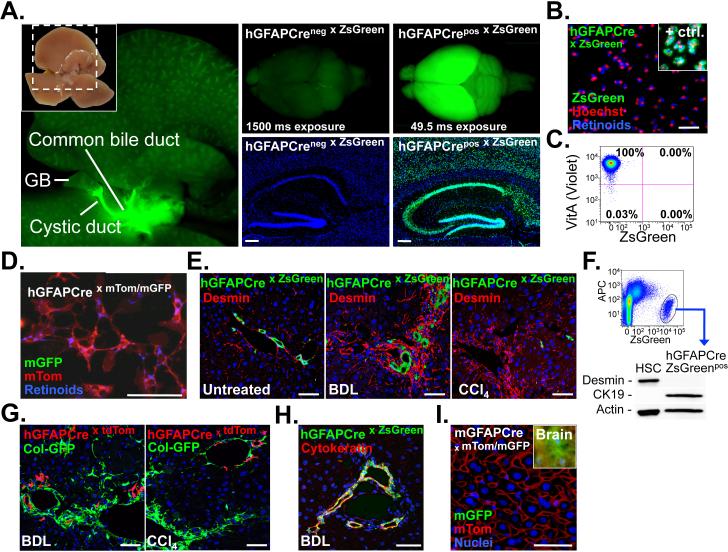
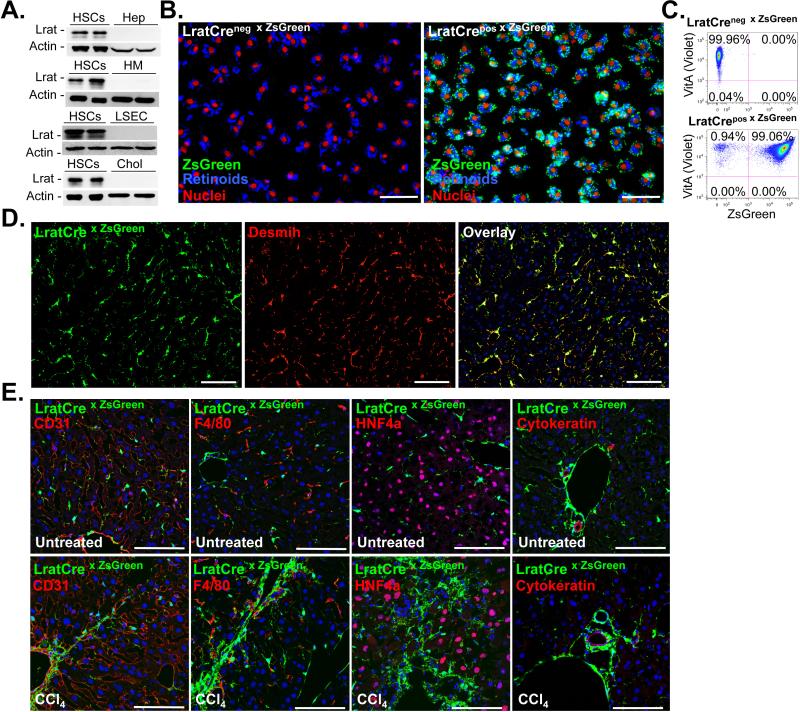
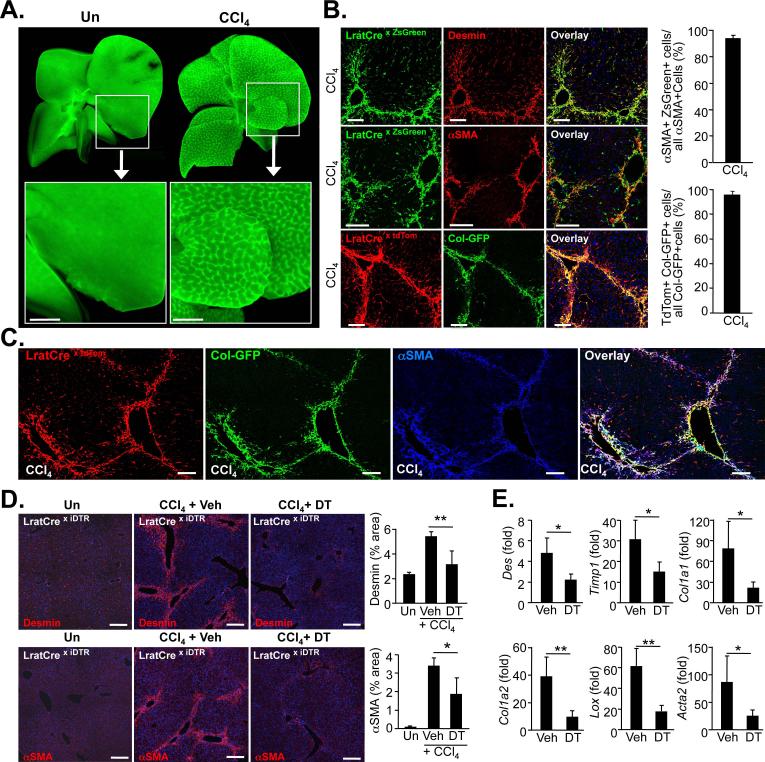
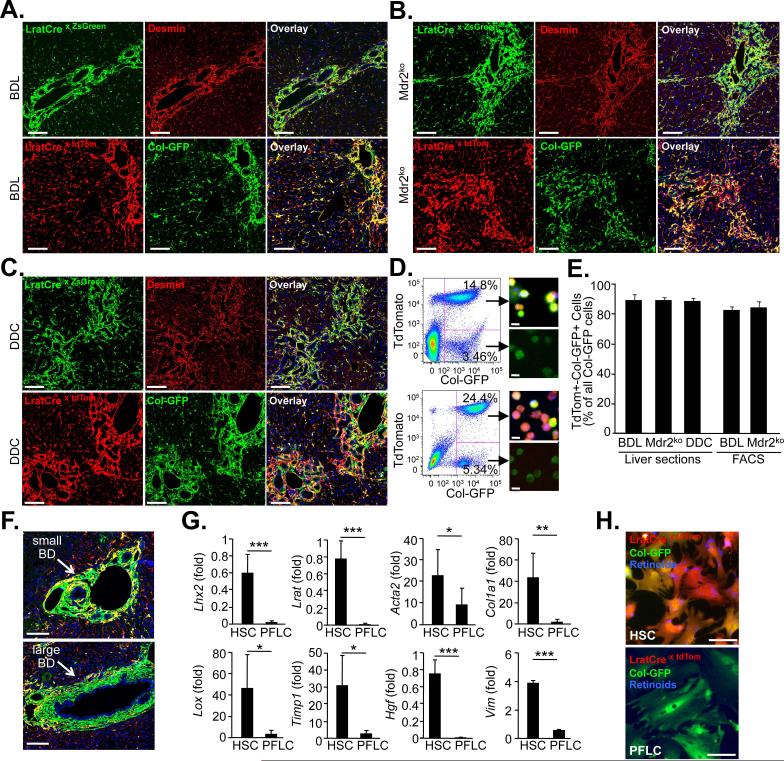
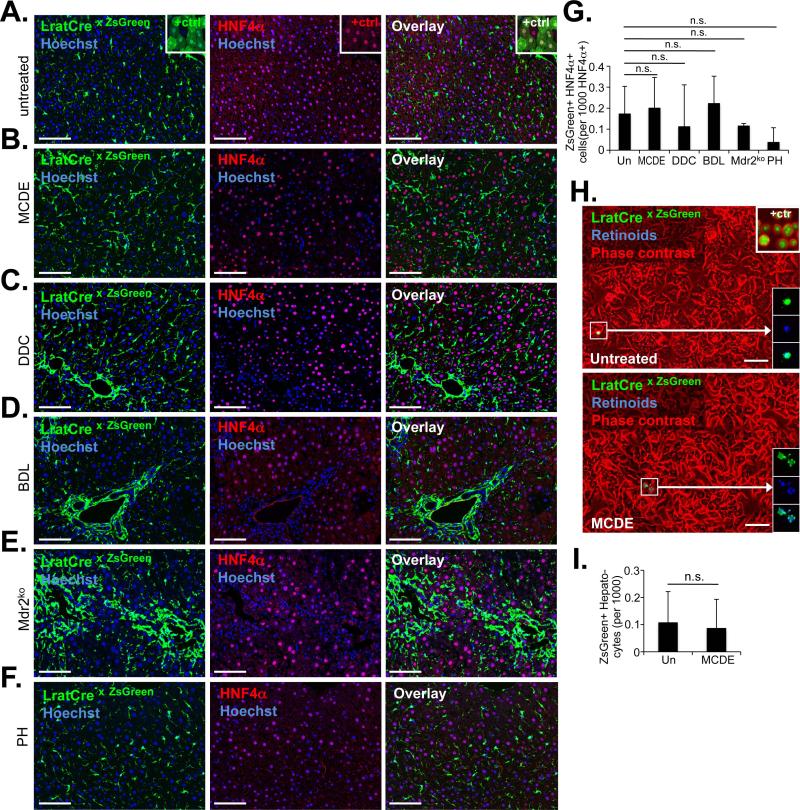
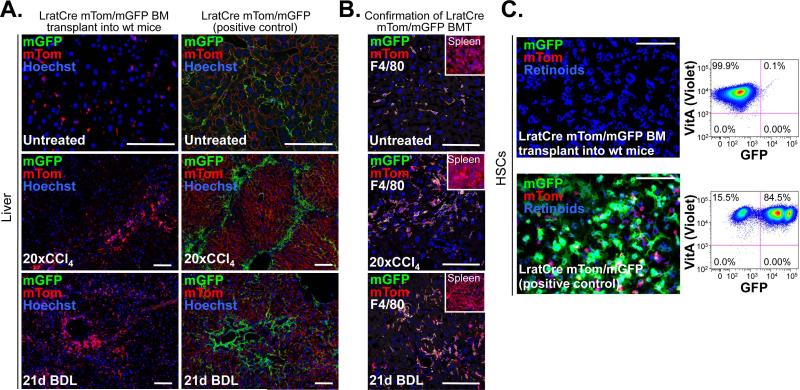
Although organ fibrosis causes significant morbidity and mortality in chronic diseases, the lack of detailed knowledge about specific cellular contributors mediating fibrogenesis hampers the design of effective antifibrotic therapies. Different cellular sources, including tissue-resident and bone marrow-derived fibroblasts, pericytes and epithelial cells, have been suggested to give rise to myofibroblasts, but their relative contributions remain controversial, with profound differences between organs and different diseases. Here we employ a novel Cre-transgenic mouse that marks 99% of hepatic stellate cells (HSCs), a liver-specific pericyte population, to demonstrate that HSCs give rise to 82-96% of myofibroblasts in models of toxic, cholestatic and fatty liver disease. Moreover, we exclude that HSCs function as facultative epithelial progenitor cells in the injured liver. On the basis these findings, HSCs should be considered the primary cellular target for antifibrotic therapies across all types of liver disease.


Figures

Figure 1
Figure 1. GFAPCre marks extra- and intrahepatic bile ducts but not HSCs
A. Macroscopic images demonstrate hGFAPCre-induced ZsGreen Cre reporter fluorescence in extrahepatic bile ducts, the brain and brain sections (n=1). B-C. HSCs were isolated from hGFAPCre mice expressing ZsGreen (n=2), and either plated (B), or analyzed by flow-cytometry (C). LratCre mice served as positive control (n=3). D. HSCs were isolated from hGFAPCre mice expressing mTom/mGFP Cre reporter, and plated (n=1). E. Sections from untreated (n=1), bile duct-ligated (n=1) and CCl4-treated livers (n=2) were stained for desmin, showing no co-localization of ZsGreen and HSC marker desmin by confocal microscopy. F. Representative western blot (out of n=3) showing cytokeratin 19 expression but no desmin expression in FACS-sorted hGFAP-Cre labeled ZsGreen positive cells. G. hGFAPCre mice undergoing either BDL (n=1) or CCl4 treatment (n=1) show no overlap between tdTomato Cre reporter and Col-GFP reporter, thus excluding a contribution of hGFAPCre-labeled cells to ECM-producing myofibroblasts. H. Cytokeratin staining of bile duct-ligated hGFAPCre mice shows almost complete overlap of cytokeratin, marking the bile duct proliferates, and hGFAPCre-induced ZsGreen expression (n=1). I. Sections from untreated mice expressing Cre under the murine Gfap promoter and mTom/mGFP Cre reporter show no GFP expression in the liver. Brain served as positive control (Inlet). Scale bars, 4 mm (A, left panel), 2 mm (A, upper middle and right panel) 200 μm (A, lower middle and right panel) and 50 μm (B, D, E, G-I).
Figure 2
Figure 2. LratCre efficiently labels hepatic stellate cells
A. Lrat expression was determined by western blot in pure and never-plated primary murine HSCs (n=8), hepatocytes (n=2), Kupffer cells (n=2), endothelial cells (n=2), and cholangiocytes (n=2). B-C. HSCs were isolated from LratCre negative (n=2) and LratCre-positive mice (n=3) expressing ZsGreen Cre reporter and either plated for 24h (B), or analyzed by flow cytometry (C), using vitamin A (“VitA”, determined in the violet FACS channel) fluorescence as HSC marker in both approaches. D. Co-localization of LratCre-induced ZsGreen expression and desmin was determined in untreated livers using confocal microscopy (n=4) E. Co-localization of LratCre-induced ZsGreen expression and CD31 (marking endothelial cells), F4/80 (marking macrophages), HNF4α (marking hepatocytes) and cytokeratin (marking cholangiocytes) was determined by confocal microscopy in untreated and CCl4-treated mice. Scale bars 100 μm (B, D-E).
Figure 3
Figure 3. Hepatic stellate cells are the principal source of myofibroblasts in CCl4-induced liver fibrosis
A. Representative fluorescent images of whole livers from untreated and CCl4-treated (n=3) show LratCre-labeled ZsGreen-positive macroscopic fibrotic septa in CCl4-treated liver. B. Frozen liver sections from CCl4-treated LratCre-positive mice were stained with desmin (upper panel) or αSMA (middle panel) to demonstrate co-localization of HSC marker desmin or αSMA and LratCre-induced ZsGreen by confocal microscopy. Confocal microscopy was employed to show co-localization of Col-GFP reporter, marking activated myofibroblasts, and LratCre-induced tdTomato expression (lower panel). Quantification of αSMA-expressing cells that are derived from LratCre-labeled ZsGreen-positive HSCs in fibrosis induced by 9x CCl4 (n=4, upper graph) or Col-GFP-expressing cells that are derived from LratCre-labeled tdTomato-positive HSCs in fibrosis induced by 9xCCl4 treatment (n=4, lower graph). C. Co-localization of αSMA with tdTomato and Col-GFP in 9xCCl4-induced liver fibrosis was determined by confocal microscopy employing far-red secondary antibody for αSMA detection. D-E. LratCre mice, expressing Cre-inducible diphteria toxin receptor (iDTR) received either vehicle (n=4) or dipheria toxin (DT, n=4) during CCl4-induced liver fibrosis induction. Expression of αSMA and desmin was determined by immunohistochemstry and quantified (D), expression of fibrogenic genes was determined by qPCR (E). Scale bars 1 mm (A), 100 μm (B-C), 200 μm (D). Data are shown as means ± SD. * p<0.05; ** p<0.01 (determined by Student t-test).
Figure 4
Figure 4. Hepatic stellate cells are the principal source of myofibroblasts in cholestatic liver fibrosis
A-C. Liver sections of 14 day bile duct-ligated (BDL) mice (A, ZsGreen n=3, tdTom/ColGFP n=4), 9 week old Mdr2ko mice (B, ZsGreen n=4, tdTom/ColGFP n=5), or 0.1% DDC-diet treated mice (C, ZsGreen n=4, tdTom/ColGFP n=3) were stained with desmin to demonstrate co-localization of HSC marker desmin and LratCre-induced ZsGreen by confocal microscopy (upper panel). Confocal microscopy was employed to show co-localization of Col-GFP reporter, marking activated myofibroblasts, and LratCre-induced tdTomato expression (lower panel). D. Flow-cytometric images from two week BDL mice (upper panel) and nine-week old Mdr2ko (lower panel) mice, co-expressing LratCre, tdTomato and Col-GFP. Images next to FACS plots show sorted cells freshly after plating. E. Quantification of Col-GFP-expressing cells, derived from LratCre-labeled tdTomato-positive HSCs, was performed in liver sections (14d BDL: n=4; Mdr2ko n=5; 0.1% DDC diet: n=3) or in non-parenchymal cell fractions using flow cytometry (14d BDL: n=4, Mdr2ko n=6). F. Images demonstrating small and large bile ducts surrounded by Col-GFP-positive and LratCre-negative portal fibroblasts. G. qPCR of FACS-sorted unplated LratCre-labeled tdTom-positive and Col-GFP-positive cells (HSC, n=5 isolates) and tdTom-negative and Col-GFP-positive cells (portal fibroblast-like cells, PFLC, n=5 isolates). H. Representative images of HSCs and PFLC show morphologically distinct cell populations. Scale bars 100 μm (A-C), 10 μm (D), 100 μm (F), 50 μm (H). Data are shown as means ± SD. * p<0.05; ** p<0.01; *** p<0.001 (determined by Student t-test).
Figure 5
Figure 5. HSCs do not contribute to the generation of newly formed hepatocytes
A-G. Determination of possible co-localization of hepatocyte marker HNF4α and LratCre-induced ZsGreen was performed by confocal microscopy in untreated mice (n=4) (A), mice receiving MCDE diet for three weeks followed by three weeks recovery on regular chow (n=4) (B), mice receiving DDC diet for four weeks followed by three weeks recovery (n=3) (C), mice undergoing BDL for two weeks (n=3) (D), 9-15 week old Mdr2ko mice (n=3) (E), or two weeks after partial hepatectomy (n=3) (F). The number of HNF4α-expressing hepatocytes, positive for ZsGreen, was quantified from confocal microscope images (G). H-I. Representative images of primary hepatocytes, isolated from control mice (n=3) and mice that received MCDE diet for three weeks (n=4), followed by three weeks recovery (H). Positive control (“+ ctrl”) from AAV8-TBG-Cre infected mice showing ZsGreen-positive hepatocytes (n=1) (H, upper right insert). The rare ZsGreen-positive small-size cells were identified as HSCs by their characteristic fluorescent retinoid-containing lipid droplets (H, lower right inserts). ZsGreen-positive hepatocytes were quantified (I). Scale bars, 100 μm. Data are shown as means ± SD. n.s., non-significant (one-way ANOVA).
Figure 6
Figure 6. LratCre-labeled HSCs are not bone marrow-derived
A-C. Bone marrow from mice expressing LratCre and mTom/mGFP-Cre reporter was transplanted into lethally irradiated wild-type recipients. Untreated (n=2), 20× CCl4 (n=1) and 3 weeks BDL (n=1) treated mice were sacrificed 5-6 months after BMT, and showed no LratCre-induced mGFP expression, thus excluding a contribution of the BM to generation of LratCre-expressing HSCs. In contrast, LratCre-positive mice expressing mTom/mGFP, serving as positive control, showed abundant mGFP signal (A). Successful BMT was confirmed by the presence mTom-positive cells in spleen (see inserts) and demonstration of F4/80-positive mGFP-expressing liver macrophages (B). HSCs isolated from BM-transplanted mice (n=1) showed no mGFP signal or by flow-cytometric analysis, whereas controls showed abundant mGFP signal (n=4) (C). Scale bars 100 μm.

Comment in

Similar articles

Cited by

References

    1. Mehal WZ, Iredale J, Friedman SL. Scraping fibrosis: expressway to the core of fibrosis. Nat Med. 2011;17:552–553. - PMC - PubMed
    1. Gabbiani G. The myofibroblast in wound healing and fibrocontractive diseases. J Pathol. 2003;200:500–503. - PubMed
    1. Wynn TA, Ramalingam TR. Mechanisms of fibrosis: therapeutic translation for fibrotic disease. Nat Med. 2012;18:1028–1040. - PMC - PubMed
    1. Bataller R, Brenner DA. Liver fibrosis. J Clin Invest. 2005;115:209–218. - PMC - PubMed
    1. Dranoff JA, Wells RG. Portal fibroblasts: Underappreciated mediators of biliary fibrosis. Hepatology. 2010;51:1438–1444. - PMC - PubMed

Publication types