. 2014 Feb;88(3):1617-35.
doi: 10.1128/JVI.02071-13. Epub 2013 Nov 20.

Evolutionary conservation of primate lymphocryptovirus microRNA targets

Affiliations

Evolutionary conservation of primate lymphocryptovirus microRNA targets

Rebecca L Skalsky et al. J Virol. 2014 Feb.

Abstract

Epstein-Barr virus (EBV) and rhesus lymphocryptovirus (rLCV) are closely related gammaherpesviruses in the lymphocryptovirus subgroup that express viral microRNAs (miRNAs) during latent infection. In addition to many host mRNAs, EBV miRNAs are known to target latent viral transcripts, specifically those encoding LMP1, BHRF1, and EBNA2. The mRNA targets of rLCV miRNAs have not been investigated. Using luciferase reporter assays, photoactivatable cross-linking and immunoprecipitation (PAR-CLIP), and deep sequencing, we demonstrate that posttranscriptional regulation of LMP1 expression is a conserved function of lymphocryptovirus miRNAs. Furthermore, the mRNAs encoding the rLCV EBNA2 and BHRF1 homologs are regulated by miRNAs in rLCV-infected B cells. Homologous to sites in the EBV LMP1 and BHRF1 3'-untranslated regions (UTRs), we also identified evolutionarily conserved binding sites for the cellular miR-17/20/106 family in the LMP1 and BHRF1 3'UTRs of several primate LCVs. Finally, we investigated the functional consequences of LMP1 targeting by individual EBV BART miRNAs and show that select viral miRNAs play a role in the previously observed modulation of NF-κB activation.


Figures
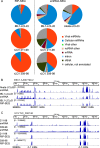
FIG 1
FIG 1
Deep sequencing analysis of lymphocryptovirus miRNAs. (A) Distribution of aligned, deep sequencing reads from RISC-immunoprecipitations (RIP-SEQ) or size-selected total RNA (smRNA). Reads from IBL-LCLd3 and Akata-LCLd3 (human LCLs infected with wild-type EBV) were aligned to the human genome (HG19) and EBV1, while reads from 211-98 and 309-98 rLCLs were aligned to the rhesus macaque genome (Macaca mulatta; Mmu1_051212) and rLCV (NC_006146.1). (B) Whole-genome view of deep sequencing reads from EBV LCLs aligned to EBV1. Seg files (containing start position, end position, and read count for each unique read) were generated for each deep sequencing library and visualized using the Integrative Genomics Viewer (IGV). Read counts are normalized for each library and shown on a log scale. (C) Same as panel B, except reads from the rLCL libraries are shown aligned to the rLCV genome.
FIG 2
FIG 2
BHRF1 miRNAs are encoded by primate lymphocryptoviruses. (A and B) Predicted hairpin structures for novel herpesvirus papio and herpesvirus pan BHRF1 precursor miRNAs generated using RNAfold (52). The predicted mature miRNA sequences, based on homology to known EBV and rLCV BHRF1 miRNAs, are shaded. (C) Clustal2.1 multiple sequence alignment of predicted and known BHRF1 pre-miRNA hairpin and flanking sequences from EBV, rLCV, herpesvirus papio, and herpesvirus pan.
FIG 3
FIG 3
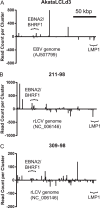
PAR-CLIP analysis of LCLs. Whole-genome view of PAR-CLIP/PARalyzer clusters aligning to EBV1 for AkataLCLd3 (A) or rLCV for 211-98 and 309-98 rLCLs (B and C). The y axis shows the read count per cluster. Read counts below the x axis (negative y axis values) indicate reads aligned to the complementary strand. Nucleotide positions in the viral genome are shown on the x axis. Clusters mapping to noncoding RNAs (i.e., miRNAs and EBERs) are not shown. Scale, 50 kbp.
FIG 4
FIG 4
BHRF1 mRNA is targeted by miRNAs. (A) PAR-CLIP/PARalyzer clusters (black bars) from Akata-LCLd3 aligned with the EBV BHRF1 region (nt 41471 to 43235; EBV1). Light gray bars indicate clusters mapping to the EBV BHRF1 miRNAs. Highlighted are clusters in the BHRF1 3′UTR containing seed matches to miR-BART10-3p and miR-142-3p. (B) Clusters from rLCV 211-98 and 309-98 PAR-CLIP/PARalyzer analysis (black bars) that align to the rLCV BHRF1 region. Light gray bars indicate clusters mapping to the rLCV BHRF1 miRNA homologs. Highlighted are clusters with seed matches to viral and cellular miRNAs. Of note, the miR-rL1-5-3p and miR-rL1-34-5p binding sites occur in clusters that presumably map to a lytic BHRF1 mRNA. For panels A and B, the y axis indicates the read count per cluster on a log scale. (C) 293T cells were cotransfected with 1 μg miRNA expression vector, 10 ng pLSR, and 10 ng pLSG-EBV-BHRF1 3′UTR reporter or pLSG-rLCV-BHRF1 3′UTR reporter. Luciferase activity was measured 48 to 72 h posttransfection. Shown are the averages from three independent experiments performed in triplicate; error bars indicate standard deviations. All firefly luciferase units are normalized to Renilla activity (RLU, relative light units) and are reported relative to the empty vector. *, P < 0.0 relative to empty vector (Student's t test). (D and E) EBV BHRF1 mRNA is RISC associated. RISC-associated RNAs were immunoprecipitated from EF3D-Ago2 LCLs using anti-FLAG or anti-GFP (negative-control) antibody. EF3D-MigW (expressing only GFP) cells were used as an additional negative control. RISC-associated RNAs were purified and reverse transcribed using random hexamers (D) or oligo(dT) (E) as the primer. BHRF1 cDNA was detected by quantitative PCR using primers against the BHRF1 5′ intron, ORF, or 3′UTR. Shown are the levels of BHRF1 RNA or mRNA relative to EF3D-MigW (control) and pcDNA3-BHRF1 standards (see Materials and Methods) (n = 2). Error bars indicate standard deviations.
FIG 5
FIG 5
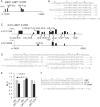
LMP1 transcript is a conserved target of viral and cellular miRNAs. (A) The EBV LMP1 3′UTR (nt 166483 to 167702; EBV1) contains multiple RISC-associated sites. Highlighted are clusters (black bars) with seed matches to miR-BART5-5p and the cellular miR-17/20/106 family. (B) miR-BART5-5p targets EBV LMP1 3′UTR. Shown is the cluster containing the miR-BART5-5p seed match site and associated reads with read counts. Individual T→C conversions are marked. (C) The rLCV LMP1 3′UTR (nt 162903 to 164303; rLCV) contains multiple RISC-associated sites (black bars). Highlighted are rLCV miRNAs with seed matches (minimally 7mer1A) to individual clusters. Two asterisks indicate a miRNA with a 6mer (nt 2 to 7) match. For panels A and C, the y axis indicates read count per cluster on a log scale. (D) miR-rL1-8-5p (miR-BART5 homolog) and miR-rL1-5-3p (miR-BART3 homolog) target the rLCV LMP1 3′UTR. Shown is a cluster containing rLCV miRNA seed matches and associated reads; individual T→C conversions are marked. (E) 293T cells were cotransfected with 1 μg hsa-miR-17 expression vector, 10 ng pLSR, and 10 ng pLSG-LMP1, pLSG-LMP1d17/20 (contains a mutation in the miR-17/20/106 binding site), or pLSG-rLMP1 3′UTR reporter. Luciferase activity was measured 48 to 72 h posttransfection. Shown are the averages from three independent experiments performed in triplicate; error bars indicate standard deviations. All firefly luciferase units are normalized to Renilla activity (RLU, relative light units) and are reported relative to the empty vector. *, P < 0.05 relative to empty vector (Student's t test). (F) The miR-17 binding site in the LMP1 3′UTR is conserved in primate lymphocryptoviruses. Clustal2.0 multiple sequence alignment of the miR-17 binding region in EBV, rLCV, and herpesvirus papio LMP1 mRNAs.
FIG 6
FIG 6
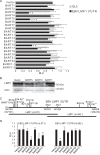
Multiple EBV BART miRNAs target the LMP1 3′UTR. (A) 293T cells were cotransfected with 1 μg of the indicated miRNA expression vector (BART or BHRF1 miRNA), 10 ng pLSR (Renilla internal control plasmid), and 10 ng either pLSG control luciferase (GL3) or pLSG-LMP1 luciferase reporter containing the full EBV LMP1 3′UTR cloned from EBV B95-8 LCLs. For all luciferase assays (A and D), luciferase activity was measured 48 to 72 h posttransfection. Shown are the averages from 2 to 4 independent experiments performed in triplicate; error bars indicate standard deviations. All firefly luciferase units are normalized to Renilla activity (RLU, relative light units) and are reported relative to empty vector. *, P < 0.05 relative to empty vector (Student's t test). (B) Western blot analysis of LMP1 levels in the presence of BART miRNAs. 293T cells were transfected with 1 μg individual BART miRNA expression vectors. Twenty-four h later, cells were transfected again with 5 ng pLMP1 and 1 μg filler DNA (pK-GST). Lysates were harvested for Western blotting after 20 h. LMP1 and beta-actin were detected using monoclonal antibodies. (C) The EBV LMP1 3′UTR contains seed match sites (minimally, 7mer1A) to seven BART miRNAs. The double asterisks indicate positions of predicted, noncanonical sites for miR-BART16-5p and miR-BART3-5p. Numbers below indicate genomic coordinates relative to EBV B95-8 or, in parentheses, wild-type EBV1. Two truncated LMP1 3′UTR luciferase reporters were generated in pLSG and contain either the first 5′ 671 nt (nt 1 to 671) or the last 3′ 694 nt (nt 563 to the end) of the EBV LMP1 3′UTR. (D) Same as panel A, except 293T cells were cotransfected with 1 μg miRNA expression vector, 10 ng pLSR (Renilla internal control plasmid), and 10 ng truncated LMP1 3′UTR luciferase reporter. Lysates were analyzed after 72 h.
FIG 7
FIG 7
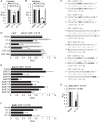
Conserved targeting of LCV LMP1 by viral miRNAs. (A and B) 293T cells were cotransfected with 1 μg rLCV miRNA expression vector, 10 ng pLCR (Renilla internal control plasmid), and 10 ng EBV BART miRNA indicator. EBV BART miRNA indicators contain two perfect, complementary binding sites for a BART miRNA in the firefly luciferase 3′UTR of pLCG. (C) Sequence comparison of the mature miRNA sequences for select EBV and rLCV miRNAs that bear seed matches to lymphocryptovirus LMP1 3′UTRs. Nucleotide differences are noted in boldface. (D to G) 293T cells were cotransfected with 1 μg of the indicated miRNA expression vector, 10 ng pLSR (Renilla internal control plasmid), and 10 ng either pLSG control luciferase (GL3) (D), pLSG-rLMP1 3′UTR reporter containing 1,347 nt of the rLCV LMP1 3′UTR (D and E), pLSG-LMP1 3′UTR reporter containing the full EBV LMP1 3′UTR (F), or pLSG-LMP1nt671 or pLSG-LMP1nt692 containing truncated EBV LMP1 3′UTRs (G). hsa-miR-146a and hsa-miR-128 are shown as negative controls for panels D and E. For all luciferase assays, luciferase activity was measured 48 to 72 h posttransfection. Shown are the averages from 2 to 4 independent experiments performed in triplicate; error bars indicate standard deviations. All firefly luciferase units are normalized to Renilla activity (RLU, relative light units) and are reported relative to empty vector. *, P < 0.05 relative to empty vector (Student's t test).
FIG 8
FIG 8
EBV BART miRNAs attenuate LMP1-mediated NF-κB activation. (A) 293T cells were cotransfected with 25 ng NF-κB luciferase reporter, 10 ng Renilla internal control, 5 ng pcDNA3-LMP1-FL, and 1 μg the indicated miRNA expression vector. Lysates were harvested 48 h posttransfection and assayed for luciferase activity. (B) 293T cells were cotransfected with 10 ng either pcDNA3-LMP1-FL or pcDNA3-LMP1d3UTR and 1 μg the indicated miRNA expression vector. After 48 h, cells were cotransfected with 25 ng NF-κB luciferase reporter and 10 ng Renilla internal control. Lysates were harvested 18 h later and assayed for luciferase activity. (C and D) Same as panel B, except the indicated amounts of EBV LMP1 expression vectors were used. For panels A to D, shown are the averages from 2 to 4 independent experiments performed in triplicate; error bars indicate standard deviations. All firefly luciferase units are normalized to Renilla activity (RLU, relative light units) and are reported relative to empty vector. *, P < 0.05 relative to empty vector (Student's t test). (E) EBV BART miRNAs do not attenuate TNF-α-induced NF-κB activation. 293T cells were cotransfected with 1 μg of the indicated miRNA expression vector, 15 ng NF-κB luciferase reporter, and Renilla internal control. Forty-eight h posttransfection, 10 ng/ml TNF-α was added for 3 h and lysates were assayed for luciferase activity.
FIG 9
FIG 9
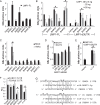
LCV miRNAs regulate IκBα stability. (A) 293T-IκBα cells (stably expressing IκBα-photinus luciferase fusion protein) were cotransfected with 12.5 ng pcDNA3-LMP1-FL and 1 μg BART miRNA expression vector. Luciferase activity was measured 48 h posttransfection. (B) 293T-IκBα cells were cotransfected with 1 μg miRNA expression vector and the indicated amounts of pcDNA3-LMP1-FL or pcDNA3-LMP1-d3UTR (without the 3′UTR). Luciferase activity was measured 48 h posttransfection. (C and D) 293T-IκBα cells were transfected with 1 μg the indicated miRNA expression vector (C) or increasing amounts of miRNA expression vector (D), using empty vector as a filler. In both panels C and D, at 48 h posttransfection cells were treated with 20 ng/ml TNF-α for 3 h, and lysates were assayed for IκBα-photinus luciferase activity. (E) 293T-IκBα cells were cotransfected with 1 μg rLCV miR-rL1-5 expression vector and 12.5 ng pcDNA3-LMP1-FL or pcDNA3-LMP1-d3UTR. Luciferase activity was measured 48 h posttransfection. For panels A to E, shown are the averages from two or more experiments; error bars indicate standard deviations. (F) EBV miR-BART3 and rLCV rL1-5 target the 3′UTRs of CAND1 and FBXW9. 293T cells were cotransfected with 1 μg the indicated miRNA expression vector (BART or rLCV miRNA), 10 ng pLSR (Renilla internal control plasmid), and 10 ng either pLSG-CAND1 or pLSG-FBXW9 3′UTR luciferase reporter. Luciferase activity was measured 48 to 72 h posttransfection, and all firefly luciferase units are normalized to Renilla activity (RLU, relative light units). Shown are averages from 2 to 4 independent experiments performed in triplicate; error bars indicate standard deviations. *, P < 0.05 relative to empty vector (Student's t test). (G) PAR-CLIP/PARalyzer-identified clusters mapping to the CAND1 and FBXW9 3′UTRs with seed matches to miR-BART3-3p (top) or miR-rL1-5-3p (bottom); individual T→C conversions are marked. Rh, rhesus macaque.

Similar articles

Cited by

References

    1. Bartel DP. 2004. MicroRNAs: genomics, biogenesis, mechanism, and function. Cell 116:281–297. 10.1016/S0092-8674(04)00045-5 - DOI - PubMed
    1. Yi R, Qin Y, Macara IG, Cullen BR. 2003. Exportin-5 mediates the nuclear export of pre-microRNAs and short hairpin RNAs. Genes Dev. 17:3011–3016. 10.1101/gad.1158803 - DOI - PMC - PubMed
    1. Jinek M, Doudna JA. 2009. A three-dimensional view of the molecular machinery of RNA interference. Nature 457:405–412. 10.1038/nature07755 - DOI - PubMed
    1. Lewis BP, Burge CB, Bartel DP. 2005. Conserved seed pairing, often flanked by adenosines, indicates that thousands of human genes are microRNA targets. Cell 120:15–20. 10.1016/j.cell.2004.12.035 - DOI - PubMed
    1. Bartel DP. 2009. MicroRNAs: target recognition and regulatory functions. Cell 136:215–233. 10.1016/j.cell.2009.01.002 - DOI - PMC - PubMed

Publication types

MeSH terms

LinkOut - more resources