Macrophage activation and skeletal muscle healing following traumatic injury
- PMID: 24255005
- PMCID: PMC4019602
- DOI: 10.1002/path.4301
Macrophage activation and skeletal muscle healing following traumatic injury
Erratum in
- J Pathol. 2014Jul;233(3):319
Abstract
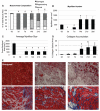
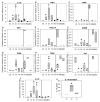
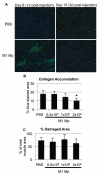
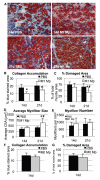
Following injury to different tissues, macrophages can contribute to both regenerative and fibrotic healing. These seemingly contradictory roles of macrophages may be related to the markedly different phenotypes that macrophages can assume upon exposure to different stimuli. We hypothesized that fibrotic healing after traumatic muscle injury would be dominated by a pro-fibrotic M2a macrophage phenotype, with M1 activation limited to the very early stages of repair. We found that macrophages accumulated in lacerated mouse muscle for at least 21 days, accompanied by limited myofibre regeneration and persistent collagen deposition. However, muscle macrophages did not exhibit either of the canonical M1 or M2a phenotypes, but instead up-regulated both M1- and M2a-associated genes early after injury, followed by down-regulation of most markers examined. Particularly, IL-10 mRNA and protein were markedly elevated in macrophages from 3-day injured muscle. Additionally, though flow cytometry identified distinct subpopulations of macrophages based on high or low expression of TNFα, these subpopulations did not clearly correspond to M1 or M2a phenotypes. Importantly, cell therapy with exogenous M1 macrophages but not non-activated macrophages reduced fibrosis and enhanced muscle fibre regeneration in lacerated muscles. These data indicate that manipulation of macrophage function has potential to improve healing following traumatic injury.
Keywords: inflammation; injury; macrophage; skeletal muscle; tissue repair.
Copyright © 2013 Pathological Society of Great Britain and Ireland. Published by John Wiley & Sons, Ltd.
Figures


Similar articles
-
Skeletal muscle healing by M1-like macrophages produced by transient expression of exogenous GM-CSF.Stem Cell Res Ther. 2020 Nov 6;11(1):473. doi: 10.1186/s13287-020-01992-1. Stem Cell Res Ther. 2020. PMID: 33158459 Free PMC article.
-
Infiltrating macrophages are broadly activated at the early stage to support acute skeletal muscle injury repair.J Neuroimmunol. 2018 Apr 15;317:55-66. doi: 10.1016/j.jneuroim.2018.01.004. Epub 2018 Jan 4. J Neuroimmunol. 2018. PMID: 29325905 Free PMC article.
-
Shifts in macrophage phenotypes and macrophage competition for arginine metabolism affect the severity of muscle pathology in muscular dystrophy.Hum Mol Genet. 2009 Feb 1;18(3):482-96. doi: 10.1093/hmg/ddn376. Epub 2008 Nov 7. Hum Mol Genet. 2009. PMID: 18996917 Free PMC article.
-
Macrophage phenotypes during tissue repair.J Leukoc Biol. 2013 Jun;93(6):875-81. doi: 10.1189/jlb.1012512. Epub 2013 Mar 15. J Leukoc Biol. 2013. PMID: 23505314 Free PMC article. Review.
-
Macrophage plasticity in skeletal muscle repair.Biomed Res Int. 2014;2014:560629. doi: 10.1155/2014/560629. Epub 2014 Apr 17. Biomed Res Int. 2014. PMID: 24860823 Free PMC article. Review.
Cited by
-
Macrophage SREBP1 regulates skeletal muscle regeneration.Front Immunol. 2024 Jan 8;14:1251784. doi: 10.3389/fimmu.2023.1251784. eCollection 2023. Front Immunol. 2024. PMID: 38259495 Free PMC article.
-
KLF2 in Myeloid Lineage Cells Regulates the Innate Immune Response during Skeletal Muscle Injury and Regeneration.iScience. 2019 Jul 26;17:334-346. doi: 10.1016/j.isci.2019.07.009. Epub 2019 Jul 8. iScience. 2019. PMID: 31326700 Free PMC article.
-
Immunology Guides Skeletal Muscle Regeneration.Int J Mol Sci. 2018 Mar 13;19(3):835. doi: 10.3390/ijms19030835. Int J Mol Sci. 2018. PMID: 29534011 Free PMC article. Review.
-
Monocytes are recruited from venules during arteriogenesis in the murine spinotrapezius ligation model.Arterioscler Thromb Vasc Biol. 2014 Sep;34(9):2012-22. doi: 10.1161/ATVBAHA.114.303399. Epub 2014 Jun 26. Arterioscler Thromb Vasc Biol. 2014. PMID: 24969773 Free PMC article.
-
A Coupled Mechanobiological Model of Muscle Regeneration In Cerebral Palsy.Front Bioeng Biotechnol. 2021 Aug 27;9:689714. doi: 10.3389/fbioe.2021.689714. eCollection 2021. Front Bioeng Biotechnol. 2021. PMID: 34513808 Free PMC article.
References
-
- Copland ST, Tipton JS, Fields KB. Evidence-based treatment of hamstring tears. Curr Sports Med Rep. 2009;8:308–314. - PubMed
-
- Bryer SC, Fantuzzi G, Van Rooijen N, et al. Urokinase-type plasminogen activator plays essential roles in macrophage chemotaxis and skeletal muscle regeneration. J Immunol. 2008;180:1179–1188. - PubMed
-
- Summan M, Warren GL, Mercer RR, et al. Macrophages and skeletal muscle regeneration: a clodronate-containing liposome depletion study. Am J Physiol Regul Integr Comp Physiol. 2006;290:R1488–R1495. - PubMed
Publication types
MeSH terms
Grants and funding
LinkOut - more resources
Full Text Sources
Other Literature Sources
Molecular Biology Databases

