

β-cell dysfunction due to increased ER stress in a stem cell model of Wolfram syndrome
- PMID: 24227685
- PMCID: PMC3931392
- DOI: 10.2337/db13-0717
β-cell dysfunction due to increased ER stress in a stem cell model of Wolfram syndrome
Abstract
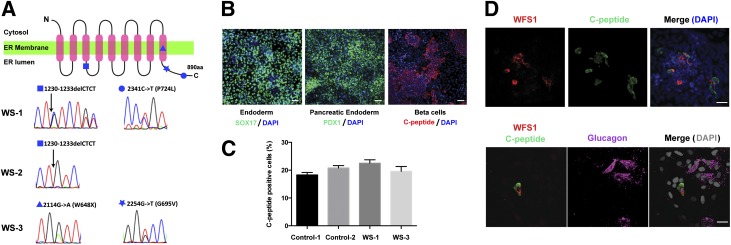
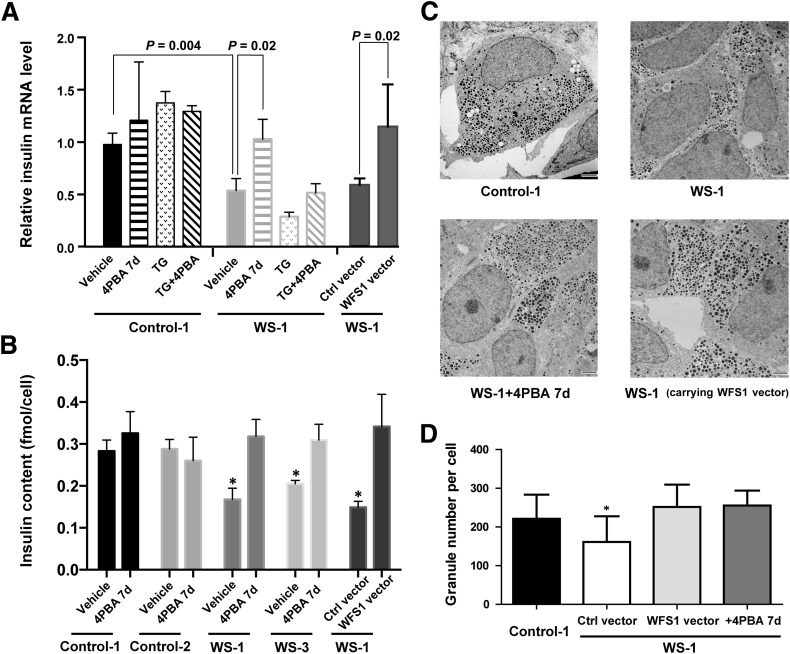
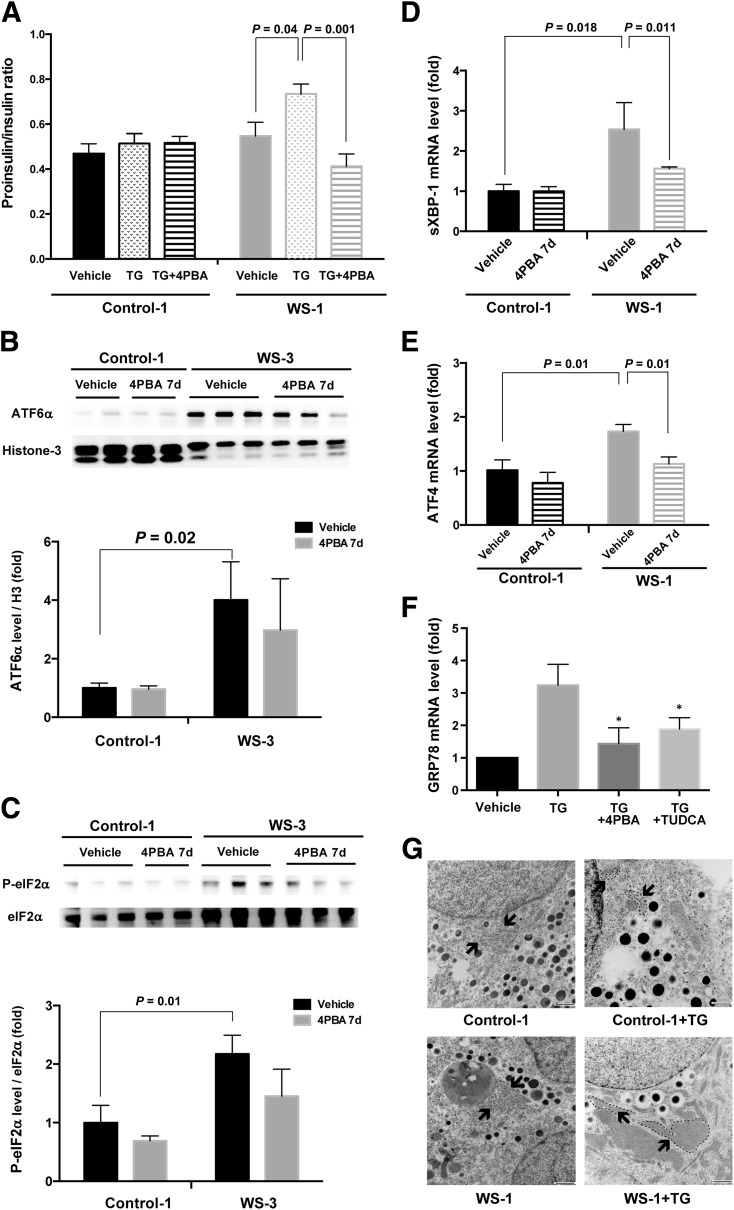
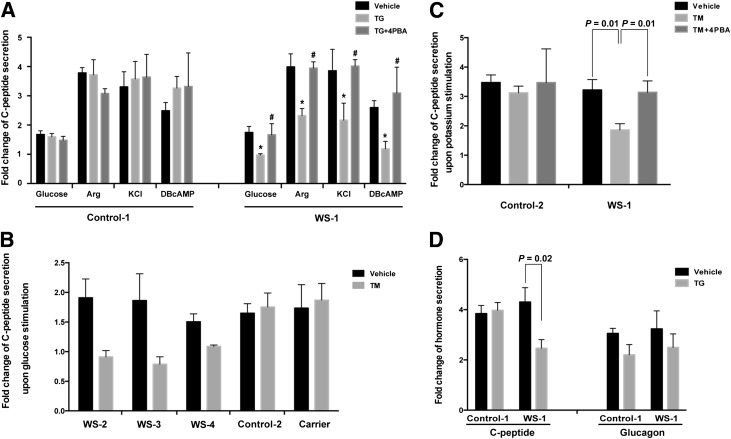
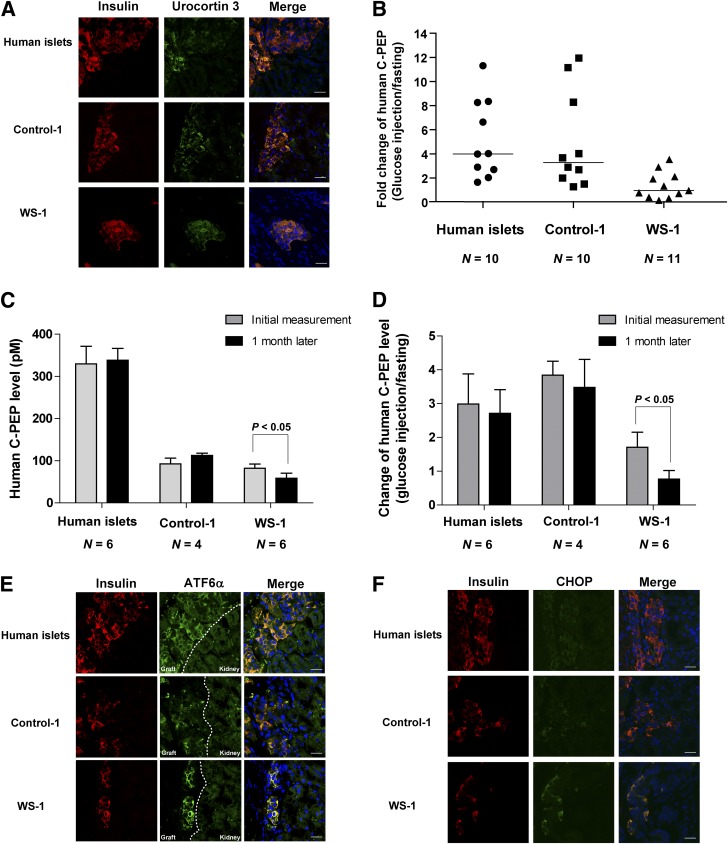
Wolfram syndrome is an autosomal recessive disorder caused by mutations in WFS1 and is characterized by insulin-dependent diabetes mellitus, optic atrophy, and deafness. To investigate the cause of β-cell failure, we used induced pluripotent stem cells to create insulin-producing cells from individuals with Wolfram syndrome. WFS1-deficient β-cells showed increased levels of endoplasmic reticulum (ER) stress molecules and decreased insulin content. Upon exposure to experimental ER stress, Wolfram β-cells showed impaired insulin processing and failed to increase insulin secretion in response to glucose and other secretagogues. Importantly, 4-phenyl butyric acid, a chemical protein folding and trafficking chaperone, restored normal insulin synthesis and the ability to upregulate insulin secretion. These studies show that ER stress plays a central role in β-cell failure in Wolfram syndrome and indicate that chemical chaperones might have therapeutic relevance under conditions of ER stress in Wolfram syndrome and other forms of diabetes.
Figures
Comment in
-
Diabetes: Targeting endoplasmic reticulum to combat juvenile diabetes.Nat Rev Endocrinol. 2014 Mar;10(3):129-30. doi: 10.1038/nrendo.2013.261. Epub 2014 Jan 7. Nat Rev Endocrinol. 2014. PMID: 24393784 Free PMC article.
-
Wolfram syndrome iPS cells: the first human cell model of endoplasmic reticulum disease.Diabetes. 2014 Mar;63(3):844-6. doi: 10.2337/db13-1809. Diabetes. 2014. PMID: 24556864 Free PMC article. No abstract available.
Similar articles
-
Loss of Function of WFS1 Causes ER Stress-Mediated Inflammation in Pancreatic Beta-Cells.Front Endocrinol (Lausanne). 2022 Mar 25;13:849204. doi: 10.3389/fendo.2022.849204. eCollection 2022. Front Endocrinol (Lausanne). 2022. PMID: 35399956 Free PMC article.
-
Effect of 4-phenylbutyrate and valproate on dominant mutations of WFS1 gene in Wolfram syndrome.J Endocrinol Invest. 2020 Sep;43(9):1317-1325. doi: 10.1007/s40618-020-01228-2. Epub 2020 Mar 26. J Endocrinol Invest. 2020. PMID: 32219690
-
Wolfram syndrome 1 gene negatively regulates ER stress signaling in rodent and human cells.J Clin Invest. 2010 Mar;120(3):744-55. doi: 10.1172/JCI39678. Epub 2010 Feb 15. J Clin Invest. 2010. PMID: 20160352 Free PMC article.
-
The Role of ER Stress in Diabetes: Exploring Pathological Mechanisms Using Wolfram Syndrome.Int J Mol Sci. 2022 Dec 23;24(1):230. doi: 10.3390/ijms24010230. Int J Mol Sci. 2022. PMID: 36613674 Free PMC article. Review.
-
Wolfram syndrome and WFS1 gene.Clin Genet. 2011 Feb;79(2):103-17. doi: 10.1111/j.1399-0004.2010.01522.x. Epub 2010 Aug 26. Clin Genet. 2011. PMID: 20738327 Review.
Cited by
-
When is it MODY? Challenges in the Interpretation of Sequence Variants in MODY Genes.Rev Diabet Stud. 2015 Fall-Winter;12(3-4):330-48. doi: 10.1900/RDS.2015.12.330. Epub 2016 Feb 10. Rev Diabet Stud. 2015. PMID: 27111119 Free PMC article. Review.
-
The Mitochondria-Endoplasmic Reticulum Contacts and Their Critical Role in Aging and Age-Associated Diseases.Front Cell Dev Biol. 2019 Aug 21;7:172. doi: 10.3389/fcell.2019.00172. eCollection 2019. Front Cell Dev Biol. 2019. PMID: 31497601 Free PMC article. Review.
-
A calcium-dependent protease as a potential therapeutic target for Wolfram syndrome.Proc Natl Acad Sci U S A. 2014 Dec 9;111(49):E5292-301. doi: 10.1073/pnas.1421055111. Epub 2014 Nov 24. Proc Natl Acad Sci U S A. 2014. PMID: 25422446 Free PMC article.
-
Human oocytes reprogram adult somatic nuclei of a type 1 diabetic to diploid pluripotent stem cells.Nature. 2014 Jun 26;510(7506):533-6. doi: 10.1038/nature13287. Epub 2014 Apr 28. Nature. 2014. PMID: 24776804
-
NCS1 overexpression restored mitochondrial activity and behavioral alterations in a zebrafish model of Wolfram syndrome.Mol Ther Methods Clin Dev. 2022 Oct 7;27:295-308. doi: 10.1016/j.omtm.2022.10.003. eCollection 2022 Dec 8. Mol Ther Methods Clin Dev. 2022. PMID: 36320410 Free PMC article.
References
-
- Inoue H, Tanizawa Y, Wasson J, et al. A gene encoding a transmembrane protein is mutated in patients with diabetes mellitus and optic atrophy (Wolfram syndrome). Nat Genet 1998;20:143–148 - PubMed
-
- Karasik A, O’Hara C, Srikanta S, et al. Genetically programmed selective islet beta-cell loss in diabetic subjects with Wolfram’s syndrome. Diabetes Care 1989;12:135–138 - PubMed
-
- Riggs AC, Bernal-Mizrachi E, Ohsugi M, et al. Mice conditionally lacking the Wolfram gene in pancreatic islet beta cells exhibit diabetes as a result of enhanced endoplasmic reticulum stress and apoptosis. Diabetologia 2005;48:2313–2321 - PubMed
-
- Ishihara H, Takeda S, Tamura A, et al. Disruption of the WFS1 gene in mice causes progressive beta-cell loss and impaired stimulus-secretion coupling in insulin secretion. Hum Mol Genet 2004;13:1159–1170 - PubMed
Publication types
MeSH terms
Substances
Grants and funding
LinkOut - more resources
Full Text Sources
Other Literature Sources
Molecular Biology Databases
Research Materials
