Organization of the mitotic chromosome
- PMID: 24200812
- PMCID: PMC4040465
- DOI: 10.1126/science.1236083
Organization of the mitotic chromosome
Abstract
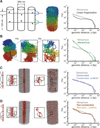
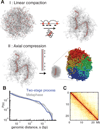
Mitotic chromosomes are among the most recognizable structures in the cell, yet for over a century their internal organization remains largely unsolved. We applied chromosome conformation capture methods, 5C and Hi-C, across the cell cycle and revealed two distinct three-dimensional folding states of the human genome. We show that the highly compartmentalized and cell type-specific organization described previously for nonsynchronous cells is restricted to interphase. In metaphase, we identified a homogenous folding state that is locus-independent, common to all chromosomes, and consistent among cell types, suggesting a general principle of metaphase chromosome organization. Using polymer simulations, we found that metaphase Hi-C data are inconsistent with classic hierarchical models and are instead best described by a linearly organized longitudinally compressed array of consecutive chromatin loops.
Figures


Comment in
-
Molecular biology. Chromosome capture brings it all together.Science. 2013 Nov 22;342(6161):940-1. doi: 10.1126/science.1247514. Science. 2013. PMID: 24264982 Free PMC article.
Similar articles
-
Chromosome disentanglement driven via optimal compaction of loop-extruded brush structures.Proc Natl Acad Sci U S A. 2019 Dec 10;116(50):24956-24965. doi: 10.1073/pnas.1906355116. Epub 2019 Nov 22. Proc Natl Acad Sci U S A. 2019. PMID: 31757850 Free PMC article.
-
Simulation of different three-dimensional polymer models of interphase chromosomes compared to experiments-an evaluation and review framework of the 3D genome organization.Semin Cell Dev Biol. 2019 Jun;90:19-42. doi: 10.1016/j.semcdb.2018.07.012. Epub 2018 Aug 24. Semin Cell Dev Biol. 2019. PMID: 30125668 Review.
-
Hierarchical looping of zigzag nucleosome chains in metaphase chromosomes.Proc Natl Acad Sci U S A. 2016 Feb 2;113(5):1238-43. doi: 10.1073/pnas.1518280113. Epub 2016 Jan 19. Proc Natl Acad Sci U S A. 2016. PMID: 26787893 Free PMC article.
-
Mitotic metaphase cells from different cell lines cause different levels of expression of the alpha-form of interphase chromosome breaks in irradiated CHO cells.Mutat Res. 1994 Oct 1;310(1):65-71. doi: 10.1016/0027-5107(94)90009-4. Mutat Res. 1994. PMID: 7523885
-
Genome Organization and Chromosome Architecture.Cold Spring Harb Symp Quant Biol. 2015;80:83-91. doi: 10.1101/sqb.2015.80.027318. Epub 2016 Jan 22. Cold Spring Harb Symp Quant Biol. 2015. PMID: 26801160 Review.
Cited by
-
Two-Parameter Mobility Assessments Discriminate Diverse Regulatory Factor Behaviors in Chromatin.Mol Cell. 2020 Aug 20;79(4):677-688.e6. doi: 10.1016/j.molcel.2020.05.036. Epub 2020 Jun 22. Mol Cell. 2020. PMID: 32574554 Free PMC article.
-
Hi-C-constrained physical models of human chromosomes recover functionally-related properties of genome organization.Sci Rep. 2016 Oct 27;6:35985. doi: 10.1038/srep35985. Sci Rep. 2016. PMID: 27786255 Free PMC article.
-
Guiding functions of the C-terminal domain of topoisomerase IIα advance mitotic chromosome assembly.Nat Commun. 2021 May 18;12(1):2917. doi: 10.1038/s41467-021-23205-w. Nat Commun. 2021. PMID: 34006877 Free PMC article.
-
A high-sensitivity phospho-switch triggered by Cdk1 governs chromosome morphogenesis during cell division.Genes Dev. 2015 Feb 15;29(4):426-39. doi: 10.1101/gad.253294.114. Genes Dev. 2015. PMID: 25691469 Free PMC article.
-
RNA polymerase backtracking results in the accumulation of fission yeast condensin at active genes.Life Sci Alliance. 2021 Mar 26;4(6):e202101046. doi: 10.26508/lsa.202101046. Print 2021 Jun. Life Sci Alliance. 2021. PMID: 33771877 Free PMC article.
References
-
- Fraser P, Bickmore W. Nature. 2007;447:413. - PubMed
Publication types
MeSH terms
Substances
Grants and funding
LinkOut - more resources
Full Text Sources
Other Literature Sources

