

Golgi enlargement in Arf-depleted yeast cells is due to altered dynamics of cisternal maturation
- PMID: 24190882
- PMCID: PMC3874789
- DOI: 10.1242/jcs.140996
Golgi enlargement in Arf-depleted yeast cells is due to altered dynamics of cisternal maturation
Abstract
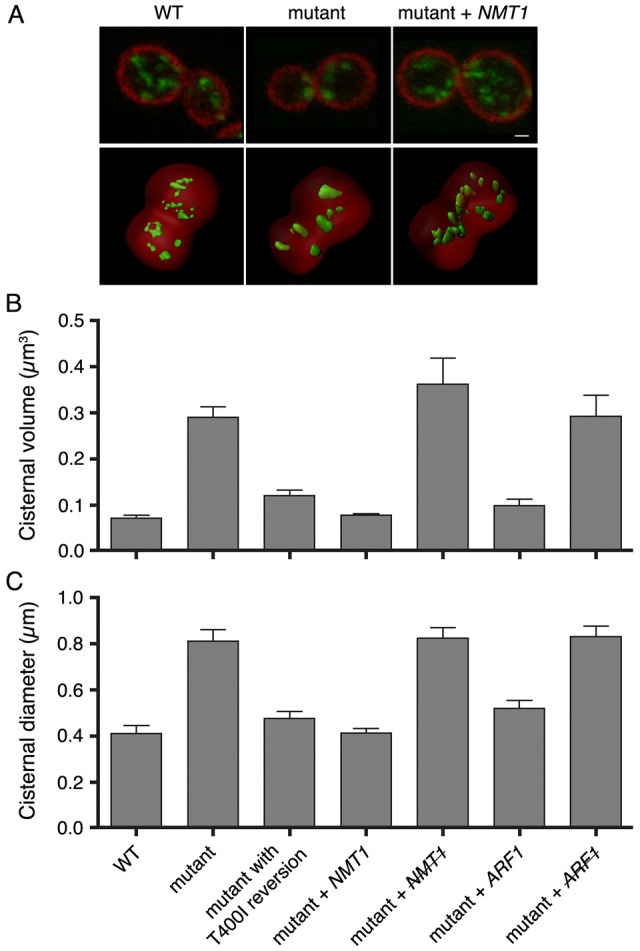
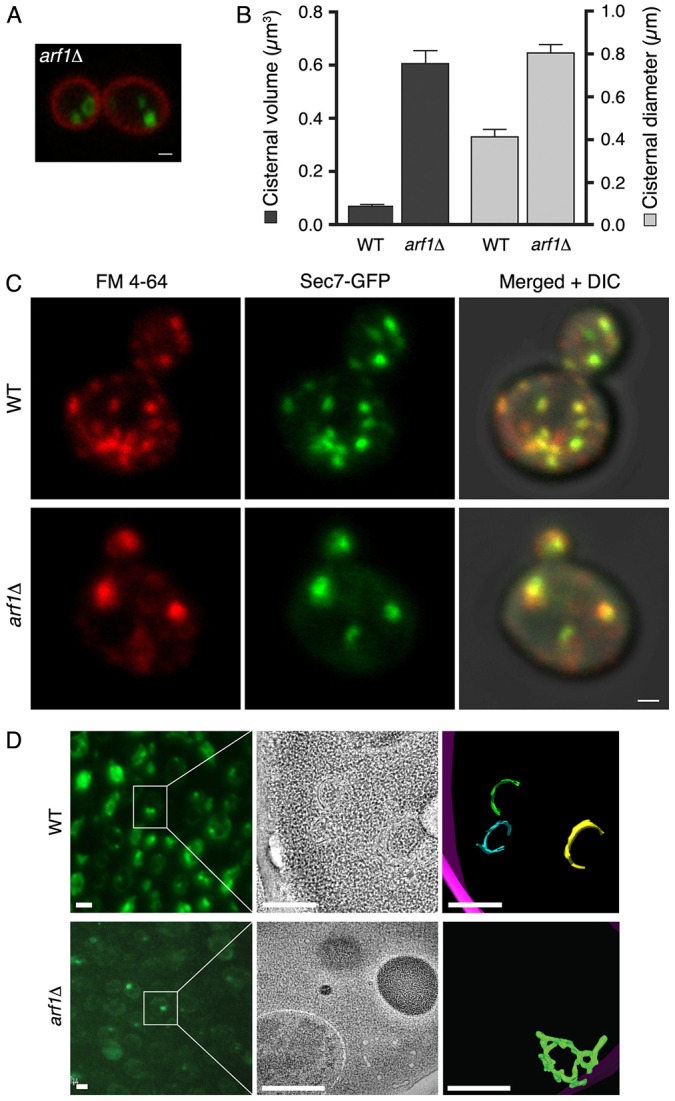
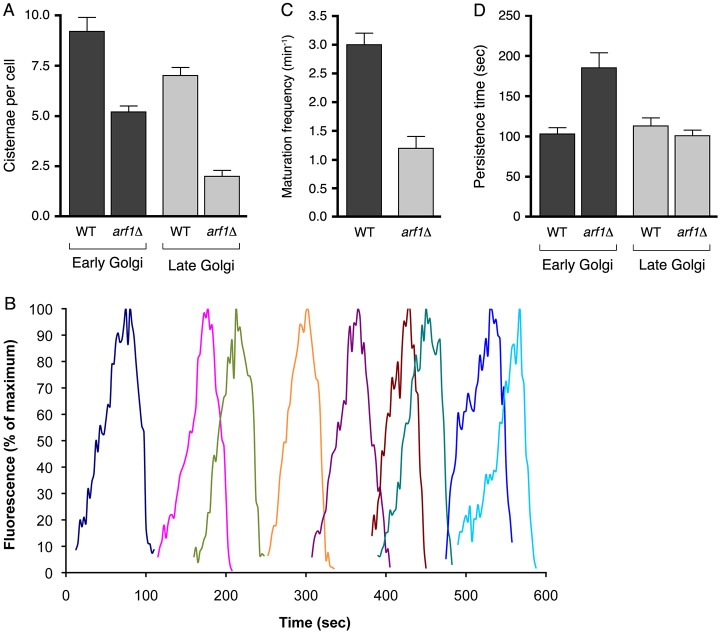
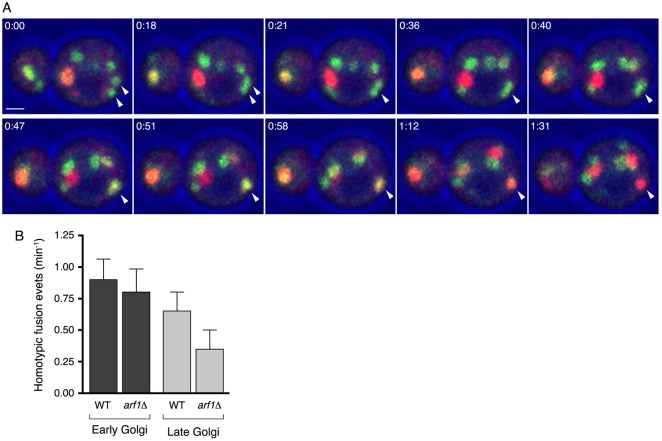
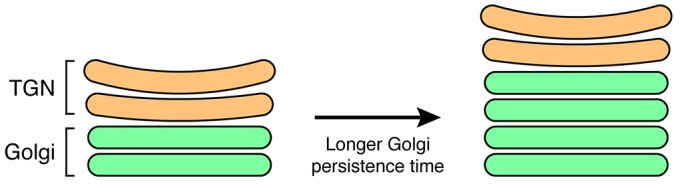
Regulation of the size and abundance of membrane compartments is a fundamental cellular activity. In Saccharomyces cerevisiae, disruption of the ADP-ribosylation factor 1 (ARF1) gene yields larger and fewer Golgi cisternae by partially depleting the Arf GTPase. We observed a similar phenotype with a thermosensitive mutation in Nmt1, which myristoylates and activates Arf. Therefore, partial depletion of Arf is a convenient tool for dissecting mechanisms that regulate Golgi structure. We found that in arf1Δ cells, late Golgi structure is particularly abnormal, with the number of late Golgi cisternae being severely reduced. This effect can be explained by selective changes in cisternal maturation kinetics. The arf1Δ mutation causes early Golgi cisternae to mature more slowly and less frequently, but does not alter the maturation of late Golgi cisternae. These changes quantitatively explain why late Golgi cisternae are fewer in number and correspondingly larger. With a stacked Golgi, similar changes in maturation kinetics could be used by the cell to modulate the number of cisternae per stack. Thus, the rates of processes that transform a maturing compartment can determine compartmental size and copy number.
Keywords: Arf; Cisternal maturation; Golgi; Organelle number; Organelle size.
Figures
Similar articles
-
Vps74p controls Golgi size in an Arf1-dependent manner.FEBS Lett. 2018 Nov;592(22):3720-3735. doi: 10.1002/1873-3468.13266. Epub 2018 Oct 24. FEBS Lett. 2018. PMID: 30291722
-
Establishing Regulation of a Dynamic Process by Ypt/Rab GTPases : A Case for Cisternal Progression.Methods Mol Biol. 2021;2293:189-199. doi: 10.1007/978-1-0716-1346-7_13. Methods Mol Biol. 2021. PMID: 34453718
-
Live imaging of yeast Golgi cisternal maturation.Nature. 2006 Jun 22;441(7096):1007-10. doi: 10.1038/nature04737. Epub 2006 May 14. Nature. 2006. PMID: 16699523
-
The yeast Golgi apparatus.Traffic. 2012 Apr;13(4):505-10. doi: 10.1111/j.1600-0854.2011.01316.x. Epub 2011 Dec 27. Traffic. 2012. PMID: 22132734 Review.
-
Building a secretory apparatus: role of ARF1/COPI in Golgi biogenesis and maintenance.Histochem Cell Biol. 1998 May-Jun;109(5-6):449-62. doi: 10.1007/s004180050247. Histochem Cell Biol. 1998. PMID: 9681627 Review.
Cited by
-
Genetic dissection of early endosomal recycling highlights a TORC1-independent role for Rag GTPases.J Cell Biol. 2017 Oct 2;216(10):3275-3290. doi: 10.1083/jcb.201702177. Epub 2017 Aug 2. J Cell Biol. 2017. PMID: 28768685 Free PMC article.
-
Phosphatidylinositol-4-phosphate-dependent membrane traffic is critical for fungal filamentous growth.Proc Natl Acad Sci U S A. 2015 Jul 14;112(28):8644-9. doi: 10.1073/pnas.1504259112. Epub 2015 Jun 29. Proc Natl Acad Sci U S A. 2015. PMID: 26124136 Free PMC article.
-
Regulation of organelle size and organization during development.Semin Cell Dev Biol. 2023 Jan 15;133:53-64. doi: 10.1016/j.semcdb.2022.02.002. Epub 2022 Feb 8. Semin Cell Dev Biol. 2023. PMID: 35148938 Free PMC article. Review.
-
Golgi compartmentation and identity.Curr Opin Cell Biol. 2014 Aug;29:74-81. doi: 10.1016/j.ceb.2014.04.010. Epub 2014 May 17. Curr Opin Cell Biol. 2014. PMID: 24840895 Free PMC article. Review.
-
Role of Arf GTPases in fungal morphogenesis and virulence.PLoS Pathog. 2017 Feb 13;13(2):e1006205. doi: 10.1371/journal.ppat.1006205. eCollection 2017 Feb. PLoS Pathog. 2017. PMID: 28192532 Free PMC article.
References
Publication types
MeSH terms
Substances
Grants and funding
LinkOut - more resources
Full Text Sources
Other Literature Sources
Molecular Biology Databases
